Part 9 Trading Master Class With Experts What Are Options?
Options are derivative contracts. This means their value is derived from an underlying asset—such as Nifty, Bank Nifty, stocks like Reliance or TCS, commodities, or currencies.
There are two types of options:
Call Options (CE) – Right to buy at a specific price
Put Options (PE) – Right to sell at a specific price
But remember this key point:
Options give a right, not an obligation.
This is what makes options asymmetric:
Buyers have limited risk and unlimited potential gain.
Sellers (writers) have limited profit but potentially high risk.
Contains image

Candle Patterns Practical Trading Tips Using Candle Patterns
Trade only with trend confirmation.
A reversal pattern against a strong trend may fail.
Look for patterns at key levels.
Support, resistance, supply-demand zones enhance accuracy.
Use stop-loss placement wisely.
For example, below the wick of a Hammer or above the wick of a Shooting Star.
Avoid trading every pattern blindly.
Candle patterns tell probabilities, not certainties.
Wait for candle close.
Incomplete candles may give false signals.
Use volume and structure to confirm.
Patterns with volume are more reliable.

[SeoVereign] BITCOIN BEARISH Outlook – November 27, 2025I’m sharing a Bitcoin downside idea as of November 27.
Bitcoin has recently seen a sharp decline, and it’s undeniable that this has gradually increased the possibility of a rebound.
However, when examining the current chart structure closely, the key conditions that, by my standards, would confirm a bullish reversal have not yet been met.
While I expect reversal signals to appear soon and have been observing the chart closely, I’ve identified that, in the current area, short-term downward pressure is actually becoming more prominent. Therefore, I’m sharing a bearish outlook.
The basis for this view is as follows.
First, in the retracement zone of the recent wave, the Fibonacci 0.786 level is acting as strong resistance. This ratio is typically an area near local highs where selling pressure strengthens again, and even if a rebound occurs, it is more likely to be a correction rather than a full trend reversal.
Additionally, the Trend-Based Extension 0.786 level, measured based on the direction of the wave, is also forming resistance. This indicates not just a simple retracement but that structural selling pressure is accumulating within the wave extension. It shows that the current price is still positioned within the continuation of a downward wave.
Lastly, when combining the ratios of the entire wave, a Crab pattern completing at the 1.902 zone is forming validly. The 1.902 zone of the Crab pattern is categorized as an area with a high probability of a reversal at the top, and when multiple patterns and ratios converge at a single point, the reliability of the reversal increases even further.
With these factors operating simultaneously, I assess the current zone as one where short-term downside is more likely than an immediate bullish reversal.
Accordingly, I’ve set the average target at 85,400 USDT, and once the move develops, I expect to decide whether to hold or not at that level.

Premium Chart Patterns Chart patterns provide clues about what buyers and sellers are doing:
Buyers create demand, pushing prices higher.
Sellers create supply, pushing prices lower.
When these forces interact, certain shapes form on the price chart. These shapes—like triangles, flags, head and shoulders, double tops—help traders forecast the next big move.
Patterns can be classified into two major types:
Reversal Patterns – indicate a possible change in trend.
Continuation Patterns – indicate the existing trend is likely to continue.
Understanding both helps traders catch major market moves with good accuracy.

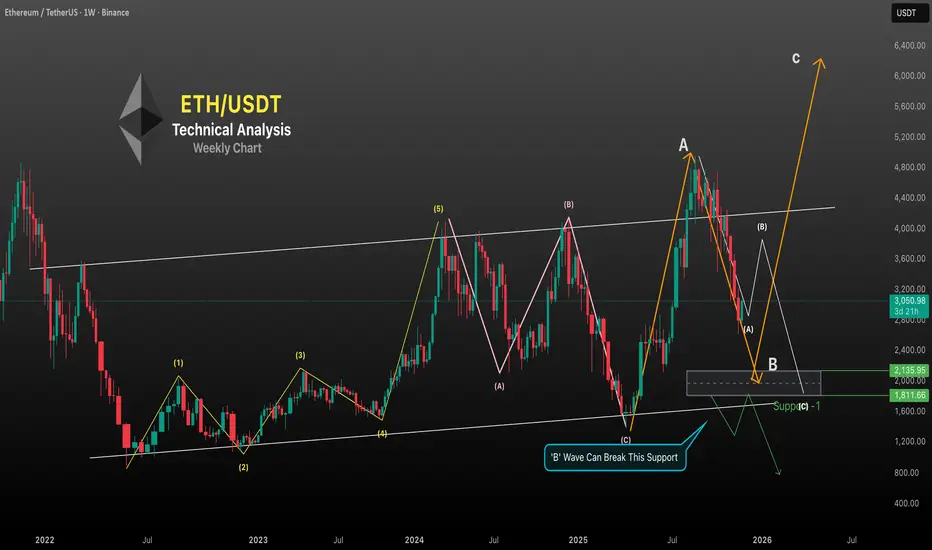
Ethereum – Elliott Wave Analysis (Weekly Chart)
#Phase 1:
Impulse Wave (1–5) Completed
ETH completed a 5-wave impulsive structure from the 2022 lows to the 2024 top:
Wave (1) – Initial reversal from the bear market bottom
Wave (2) – Deep corrective pullback
Wave (3) – Strong expansion wave (typically the largest, as shown here)
Wave (4) – Sideways consolidation within the channel
Wave (5) – Final push into the upper resistance of the long-term channel
This 5-wave structure completed near the $4,093 region.
#Phase 2:
ABC Corrective Pattern Playing Out
After the 5-wave completion, ETH entered a large ABC correction:
(A) Wave
A sharp drop from the top, marking the start of correction.
(B) Wave
A lower-high retracement that couldn’t break above the multi-year channel resistance — classic sign of a corrective rally.
(C) Wave
This wave completed near the lower boundary of the long-term channel (shown on your chart), fulfilling the ABC structure.
#Phase 3:
New Cycle – Larger ABC Structure Forming
After completing the previous ABC cycle, ETH started a new higher-degree correction:
Wave A (up)
A strong rally to ~4,956 created the larger-degree Wave A.
Wave B (current)
Price is now declining in a steep Wave B structure.
Your highlighted grey demand zone ($1,800–$2,200) is the most likely B-wave target.
Notes Must Read
B-waves often break support briefly, creating a sentiment trap
#Phase 4:
Wave C – The Big Expansion (2026?)
After Wave B finishes inside $1,800–$2,200, ETH is likely to start a massive Wave C.
Wave C is typically:
Impulsive
Equal to Wave A or 1.618× Wave A
Target 🎯 $6,000 – $6,400 region
This matches the Elliott Wave rule where Wave C often extends strongly after a deep B-wave.
~Disclaimer~
High Risk Investment
Trading or investing in assets like crypto, equity, or commodities carries high risk and may not suit all investors.
Analysis on this channel uses recent technical data and market sentiment from web sources for informational and educational purposes only, not financial advice. Trading involves high risks, and past performance does not guarantee future results. Always conduct your own research or consult a SEBI-registered advisor before investing or trading.
This channel, Render With Me, is not responsible for any financial loss arising directly or indirectly from using or relying on this information.
Cholafin Long - Investment Ideas & AnalysisTechnical Analysis : Cholamandalam Investment and Finance Co. Ltd.
Current Price: 1,610.30
Multi-Timeframe Technical Analysis
Weekly Timeframe Pattern
The stock has formed a **Cup and Handle** pattern on the weekly chart, which is traditionally considered a bullish continuation pattern. This pattern suggests potential accumulation and a possible breakout scenario.
Daily Timeframe Analysis
On the daily chart, a * *Bullish Pennant* * formation has developed, indicating consolidation after a strong upward move. This pattern typically suggests continuation of the prior trend once a breakout occurs.
Key Technical Levels
Fibonacci Retracement Levels:
- 0 Level: ₹1,491.20
- 0.5 Level: ₹1,567.70 (approximate support zone)
- 0.618 Level: ₹1,595.45 (golden ratio support)
- 1 Level: ₹1,644.20
- 1.272 Level: ₹1,685.80
- 1.414 Level: ₹1,707.55
Current Price Action:
The stock is trading near ₹1,610.30, positioned between the 0.618 and 1.0 Fibonacci levels, suggesting a mid-range consolidation zone.
Upside Targets
If the bullish patterns play out and the stock breaks above recent resistance:
- **Primary Target:** Based on the Fibonacci extension, the measured move suggests potential toward ₹1,685-₹1,708 range
- **Pattern Target:** The Cup and Handle height projection aligns with Fibonacci extension levels
Support Analysis
- **Immediate Support:** ₹1,595-₹1,600 zone (0.618 Fibonacci level)
- **Strong Support:** ₹1,567 region (0.5 Fibonacci level)
- **Major Support:** ₹1,491 (pattern base/0 level)
With Nifty made a Bounce back and if the rally continues, adds advantage for the stock to break previous resistance." This highlights the **correlation with broader market sentiment** (Nifty index), suggesting the stock's performance may be influenced by overall market conditions.
Swing Trading Perspective
For short-term traders, the Cup and Handle height provides a **measured move target**. However, confirmation of breakout above resistance with volume would be essential before entry.
**Disclaimer:** This is a technical analysis based on chart patterns and historical price action. This is not financial advice. Traders should conduct their own research, consider risk management strategies, and consult with financial advisors before making trading decisions. Past performance does not guarantee future results.

Kirloskar Oil Engines - Swing TradeKirloskar Oil Engines Limited - Technical Analysis Report
Current Market Price: 1,005.70
MARKET BIAS: BULLISH RECOVERY IN PROGRESS
Kirloskar Oil Engines is currently trading at 1,005.70, showing signs of bottoming out after a significant correction from its all-time highs of ₹1,450+. The stock is now forming a potential reversal pattern.
KEY TECHNICAL OBSERVATIONS:
1. Major Support Zone - HOLDING STRONG ✅
The stock has found solid support in the 900-950 zone, which coincides with:
- Multiple moving average convergence (EMA 20/50/100/200)
- Previous resistance-turned-support from mid-2025
- Psychological round number support at 900
The price has bounced decisively from this zone, suggesting accumulation by institutional investors.
2. Consolidation Rectangle Pattern (Daily/Weekly)
A clear *rectangular consolidation box* :
- Upper Range: 1,016 - 1,050
- Lower Range: 900 - 950
This sideways movement indicates Distribution completion and potential energy buildup for the next directional move.
All major EMAs are converging in the 890-910 zone, creating a strong support cluster.
TARGET ANALYSIS:
Immediate Resistance Targets:
Target 1: 1,180 - 1,200 (First Major Resistance)
- Previous consolidation high from December 2025
- 61.8% Fibonacci retracement of the recent decline
Target 2: 1,334 (Secondary Target)
- Major swing high marked on weekly chart
- Psychological resistance zone
Target 3: 1,450 (Extended Target)
- Previous all-time high zone
- Final resistance before new highs
Critical Support Levels:
- 1,000: Immediate psychological support
- 900-920: MAJOR SUPPORT (EMA cluster + pattern base)
BULLISH BREAKOUT (Higher Probability - 65%)**
CONCLUSION:
Kirloskar Oil Engines is at a Critical juncture with strong technical setup favoring a Bullish breakout. The stock has:
- ✅ Successfully held major support zones
- ✅ Maintained position above all key moving averages
- ✅ Formed higher lows indicating accumulation
- ✅ Built a strong base for the next upward move
Disclaimer: This analysis is for educational purposes only. Please consult with your financial advisor before making investment decisions. Past performance does not guarantee future results.

Hindustan Petroleum Corporation Ltd – Weekly Chart AnalysisPricePrice has been moving inside a rising wedge structure, forming higher highs & higher lows over the past several months. Recently, the stock attempted a breakout above the wedge resistance but is now trading near the upper trendline, showing signs of pullback or retest behavior.
Volume has remained moderate, suggesting the market is waiting for a clear direction.
Now price action is at a decision zone — either a successful retest could resume bullish momentum, or failure may lead to profit-booking and a slide toward lower support trendlines.
This zone becomes crucial for directional clarity.

Cup & Handle Breakout in HDFCLIFEThe chart idea posted shows a classic Cup & Handle breakout in HDFC Life Insurance Co. Ltd.
, signaling a bullish opportunity. The cup features a rounded bottom, followed by a handle—the short consolidation before price surges above resistance. This breakout is confirmed by strong buying volume and an 18% move in the option price, indicating momentum. Traders commonly enter above the handle’s high, set stop-loss below the handle, and target gains equivalent to the cup’s depth projected upward. The Cup & Handle pattern is reliable and widely used for trend continuation trades


Part 8 Trading Master Class With Experts Role of Volume & Open Interest
These indicators help understand market participation:
Volume shows activity
Open Interest shows fresh positions
Rising OI + rising price → strong trend
Rising OI + falling price → trend strength in opposite direction
Falling OI → position unwinding
Options with high OI often influence intraday support/resistance.

Part 7 Trading Master Class With Experts Risks in Option Trading
1. For Option Buyers
High time decay
Need sharp moves
Volatility drop can cause losses
2. For Option Sellers
Large potential loss
Requires strict stop-loss
High volatility can spike premiums unpredictably

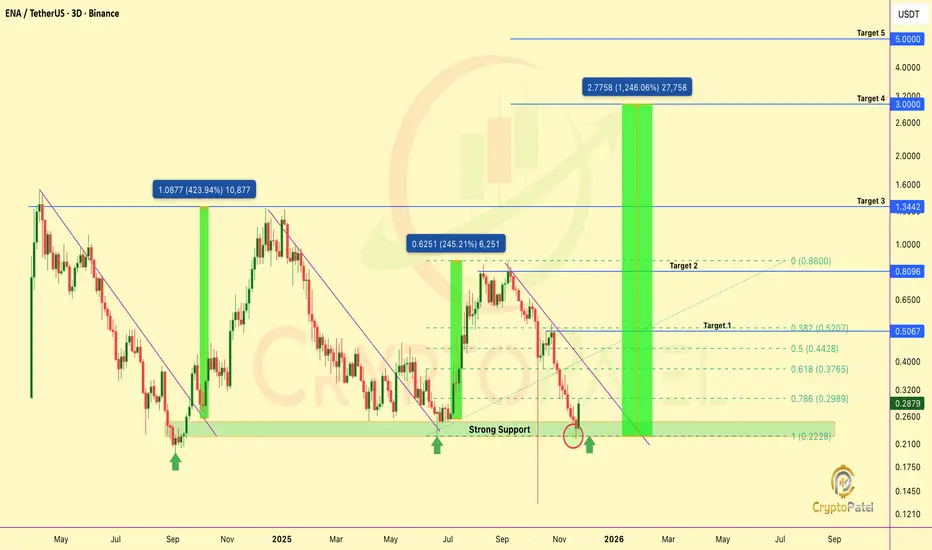
$ENA Technical Outlook: Major Reversal Signal TriggeredMIL:ENA Technical Outlook: Major Reversal Signal Triggered
ENA has cleanly rebounded from its structural support at $0.24–$0.22, a zone that has historically defined trend inflection. As long as price holds above this base, the bullish probability sharply increases, with a potential multi-fold expansion ahead.
Accumulation Zone: $0.28–$0.24
Targets: $0.50 / $0.80 / $1.34 / $3 / $5
Invalidation: HTF close below $0.19
Notably, ENA has now completed a full 0.0 Fibonacci retracement, an event that rarely occurs and often precedes a fresh all-time high breakout in structurally strong assets.
$0.50–$0.80 remain conservative upside targets; the higher projections depend on investor risk profile and time horizon.
Risk remains limited, while the asymmetry is exceptionally high.
NFA & DYOR
Nifty Intraday Analysis for 26th November 2025NSE:NIFTY
Index has resistance near 26075 – 26125 range and if index crosses and sustains above this level then may reach near 26275 – 26325 range.
Nifty has immediate support near 25725 – 25675 range and if this support is broken then index may tank near 25525 – 25475 range.

Part 6 Learn Institutional TradingWhat Is Premium?
Premium is the cost of buying an option.
It depends on multiple factors:
Underlying price
Strike price
Time to expiry
Volatility (IV)
Interest rates
Market demand and supply
If implied volatility is high, premium rises.
If expiry date is near, premium decays faster.

Part 4 Learn Institutional Trading Option Buyer vs. Option Seller
There are two sides to every option trade:
Option Buyer (Holder)
Pays premium
Limited loss
Unlimited profit potential
Needs strong directional movement
Time decay works against them
Option Seller (Writer)
Receives premium
Limited profit (premium only)
Large potential risk
Benefits from sideways/slow markets
Time decay works in favor

Part 3 Learn Institutional Trading Put Option Simplified
A put option is useful when you expect the market to go down.
When you buy a put, you are paying a premium for the right to sell.
If the underlying falls below your strike, your put gains value.
Example:
BANK NIFTY at 48,000. You buy a 48,000 PE.
If it falls to 47,500, your put becomes profitable.
Again, your maximum loss is limited to the premium.

Part 2 Ride The Big Moves Call Option Simplified
A call option is useful when you expect the market to go up.
If you buy a call option, you are paying a premium to the seller.
If the price rises above your strike price before expiry, your call option gains value.
Example:
NIFTY trading at 22,000. You buy a 22,000 CE.
If NIFTY goes to 22,300, your call becomes profitable because you have the right to buy at 22,000.
If the market falls instead, you lose only the premium you paid.

Options TradingIntroduction to Options Trading
Options trading is one of the most powerful yet misunderstood segments of the financial markets. Unlike stocks, which represent ownership in a company, options are financial contracts that give the holder the right, but not the obligation, to buy or sell an underlying asset at a predetermined price within a specific timeframe. Options are part of the derivatives family, meaning their value derives from the price movements of another asset, such as stocks, indices, commodities, or currencies.
Options trading allows investors to hedge risks, generate income, and speculate on market movements with comparatively smaller capital. They are versatile instruments, suitable for conservative hedging strategies as well as aggressive speculative plays. In India, options are actively traded on exchanges like NSE (National Stock Exchange) and are available on equities, indices (like Nifty 50), and commodities.
At its core, options trading is about flexibility and strategy. Unlike buying a stock outright, options let traders create positions that profit in bullish, bearish, or neutral market conditions. This flexibility is why professional traders and institutions frequently use options to manage risk, leverage capital, and optimize returns.
What Are Options?
An option is a contract between two parties: the buyer and the seller (writer). The buyer pays a price called a premium for the right to buy or sell the underlying asset at a specific price, known as the strike price, before the option expires. The seller, in turn, is obligated to fulfill the contract if the buyer exercises it.
Options are categorized into two main types:
Call Options – Give the holder the right to buy the underlying asset at the strike price.
Put Options – Give the holder the right to sell the underlying asset at the strike price.
The price of an option (premium) depends on multiple factors, such as:
The current price of the underlying asset.
The strike price relative to the current price.
Time until expiration (time decay).
Volatility of the underlying asset.
Interest rates and dividends (for equities).
Because options are derivative instruments, they allow traders to control a larger position with smaller capital. For instance, buying one Nifty 50 call option might give exposure equivalent to 50 shares of the index, but at a fraction of the capital required to buy the shares directly.
Options come with an expiration date, after which they become worthless if not exercised or closed. This characteristic introduces an important concept called time decay (Theta), which significantly influences option pricing and strategy.
Calls vs Puts: The Basics
Options are essentially bets on market direction, and the two main instruments—calls and puts—represent opposite positions.
1. Call Options
Definition: A call option gives the buyer the right, but not the obligation, to buy the underlying asset at a predetermined strike price before or on the expiration date.
When to Buy: Traders buy call options when they expect the price of the underlying asset to rise.
Profit Potential: The potential profit is theoretically unlimited, as the asset price can rise indefinitely above the strike price.
Risk: The maximum risk for the call option buyer is the premium paid, which is the cost of acquiring the option.
Example: Suppose Reliance Industries is trading at ₹2,500. A trader buys a call option with a strike price of ₹2,600, paying a premium of ₹50. If the stock rises to ₹2,700, the intrinsic value is ₹100, resulting in a profit of ₹50 per share after deducting the premium.
2. Put Options
Definition: A put option gives the buyer the right, but not the obligation, to sell the underlying asset at a predetermined strike price before or on expiration.
When to Buy: Traders buy put options when they expect the price of the underlying asset to fall.
Profit Potential: The potential profit increases as the price of the underlying asset declines. In theory, the maximum gain occurs if the asset price drops to zero.
Risk: Like calls, the maximum risk is limited to the premium paid.
Example: Suppose Infosys is trading at ₹1,500. A trader buys a put option with a strike price of ₹1,450 for a premium of ₹30. If Infosys falls to ₹1,400, the intrinsic value of the put is ₹50, resulting in a profit of ₹20 per share after deducting the premium.
Comparison Table: Calls vs Puts
Feature Call Option Put Option
Right To buy underlying asset To sell underlying asset
Market Expectation Bullish (price rise) Bearish (price fall)
Maximum Loss Premium paid Premium paid
Maximum Gain Unlimited Strike price minus premium (asset cannot
go below zero)
Used for Speculation, hedging long Speculation, hedging short positions
positions
Importance of Understanding Option Mechanics
Understanding the mechanics of options is crucial for traders to make informed decisions and manage risk effectively. Options are not standalone investments—they interact with market dynamics, time decay, volatility, and pricing models. Misunderstanding these mechanics can lead to significant losses, even in seemingly simple trades.
1. Pricing Factors
The pricing of options depends on variables like the underlying asset’s price, strike price, time to expiration, volatility, and interest rates. Using models like Black-Scholes (for European options) or Binomial models (for American options) helps traders understand fair value and identify mispriced options.
2. Risk Management
Options can limit risk for buyers because the maximum loss is the premium paid, while sellers face theoretically unlimited risk (especially naked call sellers). Understanding the payoff structure allows traders to balance reward vs. risk and design hedging strategies.
3. Strategic Flexibility
Options mechanics allow for sophisticated strategies beyond just buying calls and puts. Traders can combine calls, puts, and underlying assets to create strategies like:
Covered Calls – Generating income on existing holdings.
Protective Puts – Hedging against downside risk.
Spreads and Straddles – Leveraging volatility for profit.
Without a solid grasp of how options work, implementing these strategies can become confusing and risky.
4. Timing and Volatility
Time decay (Theta) erodes option value as expiration approaches. Traders must understand how timing affects profitability. Similarly, volatility (Vega) impacts premiums: higher volatility increases option prices, offering potential for greater profit but also higher cost. Ignoring these factors can lead to unexpected losses even if the market moves in the anticipated direction.
5. Hedging and Speculation
Options are invaluable for hedging. For example, an investor holding a long stock position can buy puts as insurance against market decline. Conversely, options can be used for speculation with leverage, allowing traders to control large positions with limited capital. Understanding mechanics ensures these strategies are applied effectively.
Conclusion
Options trading is a dynamic and versatile arena within financial markets. Understanding what options are, the distinction between calls and puts, and the mechanics behind option pricing is essential for anyone looking to trade wisely. Calls allow traders to profit from rising markets, while puts benefit from falling prices. Both offer defined risk for buyers and strategic opportunities when used correctly.
Mastering option mechanics is not just about predicting market direction—it’s about timing, volatility, premium management, and strategic deployment. Traders who understand these nuances can leverage options for hedging, income generation, and speculation, making them one of the most powerful tools in modern finance.

Technical Indicators Used in Momentum Trading1. Relative Strength Index (RSI)
The Relative Strength Index (RSI) is one of the most popular momentum indicators used by traders. Developed by J. Welles Wilder, the RSI measures the speed and magnitude of price movements over a specified period, typically 14 days. The indicator oscillates between 0 and 100 and helps identify overbought and oversold conditions in the market.
Overbought Condition: RSI above 70 suggests that the asset might be overbought, indicating potential for a price correction or trend reversal.
Oversold Condition: RSI below 30 suggests the asset may be oversold, providing potential buying opportunities.
RSI is particularly effective in momentum trading because it reflects the strength of price trends and highlights potential entry and exit points. Traders often combine RSI with other indicators to confirm momentum.
2. Moving Average Convergence Divergence (MACD)
The MACD is another essential tool in momentum trading. It measures the relationship between two moving averages, typically the 12-day and 26-day exponential moving averages (EMA), and produces a MACD line. A 9-day EMA of the MACD, known as the signal line, helps identify buy or sell signals.
Bullish Signal: When the MACD line crosses above the signal line, it suggests upward momentum.
Bearish Signal: When the MACD line crosses below the signal line, it indicates downward momentum.
MACD is valuable for momentum traders because it captures trend strength and potential reversals, allowing traders to time entries and exits more effectively.
3. Stochastic Oscillator
The Stochastic Oscillator is a momentum indicator that compares the closing price of an asset to its price range over a specific period, usually 14 periods. It consists of two lines: %K (fast line) and %D (slow line).
Overbought Condition: Readings above 80 suggest that the asset may be overbought.
Oversold Condition: Readings below 20 indicate that the asset may be oversold.
The Stochastic Oscillator is particularly effective in identifying short-term momentum shifts and spotting potential reversals in both trending and range-bound markets. Traders often use stochastic divergences, where price moves contrary to the oscillator, to detect weakening trends.
4. Average Directional Index (ADX)
The Average Directional Index (ADX) measures the strength of a trend rather than its direction. It is derived from the +DI and −DI lines, which indicate upward and downward directional movement. ADX values range from 0 to 100:
Strong Trend: ADX above 25 indicates a strong trend.
Weak or No Trend: ADX below 20 suggests a weak or sideways market.
Momentum traders rely on ADX to identify when a trend is gaining strength, which is essential for confirming momentum-driven trades. Unlike oscillators, ADX does not provide overbought or oversold signals but instead signals trend strength.
5. Bollinger Bands
While Bollinger Bands are primarily used to measure volatility, they also help identify momentum changes. Bollinger Bands consist of a moving average (usually 20-period SMA) and two standard deviation lines above and below it.
Price Breakout: When the price moves outside the bands, it indicates strong momentum.
Squeeze: Narrow bands indicate low volatility and potential for a momentum breakout.
Momentum traders use Bollinger Bands to spot explosive moves and gauge the strength of trends. When prices ride the upper or lower band, it often signifies strong trend momentum.
6. Commodity Channel Index (CCI)
The Commodity Channel Index (CCI) measures the deviation of the asset's price from its moving average. Typically, a 20-period CCI is used, oscillating between +100 and −100.
Overbought: CCI above +100.
Oversold: CCI below −100.
CCI is particularly useful in momentum trading for identifying cyclical trends and potential reversals. It is often combined with trend-following indicators to improve accuracy.
7. On-Balance Volume (OBV)
The On-Balance Volume (OBV) is a volume-based momentum indicator. It accumulates volume based on whether the price closes higher or lower than the previous period.
Rising OBV: Confirms upward price momentum.
Falling OBV: Confirms downward price momentum.
OBV is valuable for traders to confirm price trends with volume support. Momentum traders often rely on OBV divergences to spot potential reversals before they occur.
8. Ichimoku Cloud
The Ichimoku Cloud is a comprehensive indicator that combines trend, momentum, and support/resistance in a single view. Key components include the Tenkan-sen, Kijun-sen, Senkou Span A, and Senkou Span B.
Bullish Momentum: Price above the cloud.
Bearish Momentum: Price below the cloud.
Ichimoku Cloud helps momentum traders identify trend direction and potential entry/exit points while also providing a sense of trend strength.
9. Practical Tips for Using Momentum Indicators
Combine Indicators: No single indicator provides perfect signals. Traders often combine RSI, MACD, and ADX for better confirmation.
Confirm Trend Direction: Use trend-following indicators alongside oscillators to avoid false signals in sideways markets.
Time Frame Selection: Short-term traders may prefer 5–15 minute charts, while swing traders use daily or weekly charts.
Watch for Divergence: Momentum divergence, where price moves contrary to an indicator, often signals weakening momentum.
Risk Management: Momentum trading can be fast-moving; always use stop-loss orders and position sizing.
10. Conclusion
Momentum trading relies heavily on technical indicators to make informed decisions. Indicators such as RSI, MACD, Stochastic Oscillator, ADX, ROC, Bollinger Bands, CCI, OBV, and Ichimoku Cloud provide traders with quantitative insights into trend strength, potential reversals, and overbought or oversold conditions. By understanding the strengths and limitations of each indicator, momentum traders can optimize their strategies, identify high-probability trade setups, and manage risk effectively.
While technical indicators are powerful tools, successful momentum trading also requires discipline, market awareness, and a solid risk management plan. Using indicators in conjunction with proper trading psychology and market knowledge increases the likelihood of consistent profitability in dynamic markets.
Impact of Geopolitical Risks on Indian Financial MarketsIntroduction
Geopolitical risks have emerged as a significant determinant of financial market behavior across the globe. Defined as the potential for political, social, or military events to disrupt the stability of economies and financial markets, these risks can profoundly impact investor sentiment, capital flows, and asset prices. India, as one of the fastest-growing emerging economies, is particularly sensitive to geopolitical developments due to its strategic location, dependency on energy imports, and integration with global trade networks. From regional conflicts in South Asia to global trade tensions, geopolitical events create volatility in Indian financial markets and influence both domestic and international investors’ decision-making processes.
Channels Through Which Geopolitical Risks Affect Markets
The impact of geopolitical risks on Indian financial markets occurs through several interlinked channels:
Investor Sentiment and Market Volatility:
Geopolitical instability can trigger uncertainty among investors, leading to sudden sell-offs in equity markets. Fear of potential disruptions in economic activity prompts investors to adopt risk-averse strategies, often reallocating capital to safe-haven assets such as gold, U.S. Treasury securities, or currencies like the Swiss Franc. In India, major geopolitical shocks have historically led to heightened volatility in the Bombay Stock Exchange (BSE) and the National Stock Exchange (NSE).
Foreign Institutional Investment (FII) Flows:
India relies significantly on foreign institutional investors (FIIs) to provide liquidity and drive equity market growth. Geopolitical tensions can prompt FIIs to withdraw or reduce investments in emerging markets due to perceived risks, adversely affecting stock indices. For instance, conflicts in the Middle East impacting oil prices often lead to capital outflows from Indian markets, weakening the rupee and exerting downward pressure on equity valuations.
Commodity Prices and Inflation:
India is heavily dependent on imports for critical commodities, particularly crude oil. Geopolitical disruptions in oil-producing regions, such as the Middle East, directly impact crude oil prices, influencing inflation and fiscal policy. Rising crude prices increase production and transportation costs, squeezing corporate margins and reducing disposable income for consumers. This ripple effect negatively impacts stock markets, especially sectors like transportation, manufacturing, and consumer goods.
Currency Fluctuations:
The Indian rupee is highly sensitive to global geopolitical developments. Crises in oil-rich regions, U.S.-China trade tensions, or conflicts affecting major global economies can lead to capital flight from emerging markets, depreciating the rupee. Currency depreciation increases import costs, fuels inflation, and heightens uncertainty for foreign investors, creating further pressure on equity and bond markets.
Interest Rates and Monetary Policy:
Geopolitical shocks can indirectly influence monetary policy decisions. Rising inflation due to higher commodity prices or currency depreciation can compel the Reserve Bank of India (RBI) to adopt a tighter monetary stance, raising interest rates to stabilize prices. Higher interest rates may dampen investment and consumption, affecting corporate earnings and stock market performance.
Historical Examples of Geopolitical Risk Impact on Indian Markets
Gulf Wars and Oil Price Shocks:
During the Gulf War in 1990-1991, crude oil prices surged due to conflict in the Middle East, creating inflationary pressures in India. The Indian stock market experienced volatility, and capital outflows intensified due to investor concerns about the country’s balance of payments and economic stability. The rupee depreciated significantly, and sectors dependent on imported oil and petrochemicals were hit hardest.
U.S.-China Trade Tensions:
Although primarily affecting global markets, trade wars between the U.S. and China had spillover effects on India. Investor apprehension about global growth slowdown led to FII outflows from Indian equities. Export-oriented industries in India, such as IT and manufacturing, faced uncertainty regarding demand and pricing, impacting their stock performance.
Russia-Ukraine Conflict (2022):
The Russia-Ukraine war caused a global energy crisis and disrupted commodity markets. India faced rising crude oil and gas prices, leading to inflationary pressures and fiscal stress. Indian equities reacted with short-term volatility, particularly in energy-intensive sectors and industries heavily reliant on imports. Currency depreciation and bond market stress were also observed as global risk sentiment deteriorated.
Border Tensions with China and Pakistan:
Regional conflicts have historically influenced investor sentiment in India. Escalating tensions along the India-China border or cross-border skirmishes with Pakistan often create uncertainty regarding domestic stability, prompting investors to temporarily reduce equity exposure, resulting in short-term market corrections.
Sectoral Impacts of Geopolitical Risks
The impact of geopolitical risks is often sector-specific:
Energy and Oil & Gas: Directly affected due to import dependency and global supply disruptions.
Defense and Infrastructure: Geopolitical tensions often increase defense spending, benefiting defense contractors and infrastructure companies.
IT and Exports: Trade disruptions and sanctions affect export-oriented businesses, including IT and pharmaceutical sectors.
Banking and Financial Services: Volatility affects investor confidence, credit growth, and risk-weighted assets, impacting banking profitability.
Strategies Adopted by Investors and Policymakers
Portfolio Diversification:
Investors often diversify across asset classes and geographies to hedge against geopolitical risks. Gold and other safe-haven assets are popular choices during periods of heightened uncertainty.
Derivative Hedging:
Hedging using futures, options, and currency swaps allows investors and corporates to mitigate exposure to market and currency volatility induced by geopolitical developments.
Policy Interventions:
The Indian government and RBI actively monitor global developments. Strategic petroleum reserves, currency interventions, and monetary policy adjustments are tools used to manage external shocks. For instance, during periods of oil price spikes, the government has reduced excise duties to contain inflationary pressures.
Long-Term Investment Outlook:
While short-term market movements are highly sensitive to geopolitical shocks, long-term investors often focus on India’s underlying growth potential, robust domestic consumption, and reform-driven policies to maintain confidence.
Challenges and Risks
Despite strategies to mitigate geopolitical risks, certain challenges persist:
Unpredictability: Geopolitical events are inherently uncertain and often occur suddenly, making it difficult for investors and policymakers to respond immediately.
Global Interconnectedness: India’s integration with global financial markets amplifies the impact of distant geopolitical events.
Inflationary Pressures: Persistent inflation due to commodity price shocks can undermine economic stability and erode investor confidence.
Currency Depreciation: Continuous volatility in the rupee can create uncertainty for foreign investors and corporates with significant external debt exposure.
Conclusion
Geopolitical risks represent a complex and multifaceted challenge for Indian financial markets. They affect market sentiment, investment flows, commodity prices, currency stability, and monetary policy decisions. Historical evidence demonstrates that both global and regional geopolitical events have significant short-term impacts, often causing volatility and sector-specific repercussions. However, India’s robust economic fundamentals, strategic policy interventions, and long-term growth potential provide a cushion against sustained market disruption. For investors, a careful blend of risk management strategies, diversification, and a long-term outlook remains essential to navigate the uncertainties posed by geopolitical risks. As India continues to integrate further into global markets, understanding and managing these risks will remain a crucial aspect of financial market strategy.
Introduction to Futures HedgingUnderstanding Futures Contracts
A futures contract is a standardized legal agreement to buy or sell an asset at a predetermined price at a specified future date. These contracts are traded on organized exchanges, ensuring liquidity, transparency, and regulatory oversight. The underlying asset in a futures contract could be a physical commodity such as crude oil, wheat, or gold, or a financial instrument like an index, bond, or currency.
Futures contracts have key characteristics:
Standardization: The contract specifies the quantity, quality, and delivery date of the underlying asset.
Margin Requirements: Traders must maintain a margin—a fraction of the contract value—to enter into futures positions.
Mark-to-Market: Gains and losses are settled daily based on the contract’s market value.
Leverage: Futures allow traders to control large positions with relatively small capital, magnifying both potential gains and losses.
These features make futures contracts ideal tools for hedging because they provide predictability and protection against price volatility.
The Concept of Hedging
Hedging is the practice of taking an investment position in one market to offset potential losses in another. In essence, it acts like insurance: while it may limit potential profits, it also minimizes exposure to losses. There are two main types of hedging:
Long Hedge: Used when a business anticipates purchasing an asset in the future and wants to lock in the current price to avoid rising costs.
Example: An airline expects to buy jet fuel in six months. To protect against rising fuel prices, it can buy futures contracts now at the current price. If fuel prices rise, the gain on the futures contract offsets the higher cost of purchasing fuel in the future.
Short Hedge: Used when a business holds an asset and wants to protect against falling prices.
Example: A wheat farmer expects to harvest in three months. To avoid losses if wheat prices fall, the farmer can sell wheat futures contracts now. If the price drops, the profit on the futures contract compensates for the lower market price of the physical wheat.
By employing hedging strategies, both buyers and sellers can stabilize cash flows and plan their operations with more certainty.
Importance of Futures Hedging
Risk Management: The primary objective of futures hedging is to manage price risk. Businesses in agriculture, energy, metals, and finance frequently use futures to minimize the impact of adverse price movements.
Price Discovery: Futures markets facilitate price discovery, reflecting expectations of supply and demand. Hedgers benefit by gaining insight into future price trends.
Financial Stability: Hedging provides stability to earnings and costs. For companies with significant exposure to commodity or currency fluctuations, this stability supports strategic planning, investment, and growth.
Speculation Reduction: By hedging, companies avoid excessive exposure to speculation-driven market movements, focusing instead on their core business operations.
Enhanced Creditworthiness: Companies with effective hedging programs are viewed as financially prudent by lenders and investors, improving access to capital.
Mechanics of Futures Hedging
Hedging with futures involves several steps:
Identify the Exposure: Determine which assets, commodities, or financial instruments are exposed to price risk.
Select the Appropriate Futures Contract: Choose a futures contract that closely matches the underlying asset in terms of quantity, quality, and timing.
Decide the Hedge Ratio: The hedge ratio determines the number of futures contracts needed to offset the risk. Perfect hedges are rare; often, partial hedges are employed to balance risk reduction and cost.
Enter the Futures Position: Buy or sell futures contracts depending on whether a long or short hedge is appropriate.
Monitor and Adjust: As market conditions change, hedgers must monitor their positions and adjust contracts to maintain effective risk coverage.
Close or Offset the Hedge: Futures contracts can be offset before expiration by taking an opposite position or allowed to expire if physical delivery aligns with the hedger’s requirements.
Examples of Futures Hedging
1. Agricultural Hedging:
A corn farmer expects to harvest 10,000 bushels in four months. Concerned about falling prices, the farmer sells corn futures contracts now. When harvest time arrives, even if the market price has dropped, the farmer’s futures gains compensate for the lower sale price, ensuring financial stability.
2. Corporate Hedging:
A multinational company expects to receive €5 million in payments in six months but operates primarily in USD. To protect against EUR/USD exchange rate fluctuations, the company sells euro futures contracts. If the euro depreciates, gains on the futures offset the reduced dollar value of the payment.
3. Commodity Hedging:
An airline hedges against rising fuel costs by buying crude oil futures. If oil prices increase, the gain on the futures contracts compensates for higher fuel costs, helping maintain profitability.
Advantages of Futures Hedging
Predictable Cash Flows: Hedging reduces uncertainty in revenue and costs.
Flexibility: Futures can be tailored to different commodities, currencies, or indices.
Liquidity: Exchange-traded futures offer easy entry and exit.
Leverage: Efficient capital use allows risk management without tying up large amounts of money.
Transparency: Prices are visible and regulated, reducing counterparty risk.
Limitations of Futures Hedging
Basis Risk: The futures price may not move perfectly in line with the underlying asset, resulting in imperfect hedges.
Cost: Margins and transaction fees add to the cost of hedging.
Limited Profit Potential: Hedging locks in prices, reducing the opportunity to benefit from favorable market movements.
Complexity: Understanding contract specifications, hedge ratios, and market dynamics requires expertise.
Over-hedging Risk: Using excessive futures positions can create unintended exposure and losses.
Conclusion
Futures hedging is a vital risk management tool in modern financial and commodity markets. It allows businesses and investors to stabilize cash flows, plan effectively, and mitigate losses arising from adverse price movements. By understanding the mechanics, advantages, and limitations of futures contracts, market participants can use hedging strategies to navigate volatile markets with confidence. While futures hedging does not eliminate risk entirely, it transforms unpredictable market movements into manageable financial outcomes, fostering greater stability and strategic decision-making.
In an increasingly globalized and interconnected economy, the role of futures hedging has expanded beyond traditional commodities to include financial instruments, currencies, and indices. Companies, investors, and financial institutions that employ well-structured hedging strategies are better positioned to withstand market shocks, protect their profitability, and achieve long-term growth.
Introduction to the AI-Driven Trading EraThe Evolution of Trading Technology
To understand the AI-driven era, it is important to look back at how trading technology has evolved. Markets moved from the open-outcry system to electronic trading, and from electronic trading to algorithmic models. Algorithmic trading introduced systematic rule-based execution, but these systems still relied heavily on predefined human logic. AI changes that framework by enabling trading systems to learn, adapt, and optimize themselves using vast amounts of data.
This evolution happened because markets became too fast, too complex, and too data-driven for human traders to handle manually. AI emerged as the natural solution for processing huge datasets, identifying hidden patterns, and executing trades in microseconds.
What Makes AI a Game Changer in Trading?
AI’s advantage lies in its ability to detect nonlinear patterns, its speed, and its capacity to learn autonomously. Unlike conventional formulas that follow static rules, AI models adjust themselves based on new market behavior, making them exceptionally powerful during volatility, regime shifts, or unexpected market events.
Some key strengths of AI-driven trading systems include:
1. Big Data Processing
Financial markets produce enormous amounts of data: price ticks, news, economic indicators, global sentiments, social media activity, institutional flows, and alternative datasets like satellite images or credit card spending. AI models can process all of these simultaneously, generating insights far beyond the reach of human analysis.
2. Predictive Modeling
Machine learning models learn from historical price data and trading patterns to predict potential future outcomes. While no model is perfect, AI significantly improves the probabilities and timing of accurate predictions.
3. Automation and Emotion-Free Decision Making
Human traders often suffer from fear, greed, overconfidence, and biases. AI systems remove emotional interference entirely, sticking to mathematical probabilities and risk-adjusted models.
4. Multi-Factor Integration
AI can combine dozens—or even hundreds—of variables to evaluate a trading opportunity, something impossible for a human trader. These include:
Technical indicators
Market microstructure signals
Volume patterns
Macroeconomic trends
Order book depth
Options flow
Global market correlations
5. Speed and Precision
AI-powered high-speed execution ensures minimal slippage, instant order routing, and accurate position sizing. This is crucial in markets where milliseconds can mean the difference between profit and loss.
The Rise of Machine Learning Models in Trading
Three major categories of ML models dominate AI trading today:
1. Supervised Learning
Models learn from labeled historical data to predict future price movements. Examples include:
Linear regression
Random forests
Gradient boosting models
Neural networks
These models are excellent at forecasting price direction, volatility, and risk.
2. Unsupervised Learning
Used for clustering, anomaly detection, and market regime identification. These models identify hidden structures in the market such as:
Patterns preceding trend reversals
Unusual behavior indicating manipulation
Shifts in market sentiment
3. Reinforcement Learning (RL)
One of the most exciting developments in AI trading, RL models learn by trial and error. They self-optimize by interacting with market environments, much like how AlphaGo learned to play Go. RL trading systems continuously adjust strategies based on reward maximization, making them extremely adaptive.
AI in High-Frequency Trading (HFT)
High-frequency trading firms were among the earliest adopters of AI. Their algorithms operate at lightning speed, executing thousands of trades per second. AI enhances HFT through:
Ultra-fast pattern recognition
Statistical arbitrage
Market-making
Latency arbitrage
Liquidity prediction
HFT remains one of the most profitable yet highly competitive areas of AI-powered markets.
AI for Retail Traders
The democratization of AI has brought powerful tools to retail traders in India and around the world. Cloud computing, open-source ML libraries, and broker APIs allow individuals to build and deploy their own AI models. Many retail traders now use:
AI-based scanners
Sentiment analysis bots
Automated trading systems
Options flow predictors
Reinforcement learning strategies
Platforms like Zerodha, Upstox, and Interactive Brokers support API-driven execution, enabling retail participants to operate like mini-quant firms.
AI and Market Microstructure
Advanced AI tools analyze market microstructure to exploit tiny inefficiencies. They evaluate:
Bid-ask spreads
Order book imbalances
Liquidity pockets
Iceberg orders
Hidden institutional flows
For traders, this means precise entries, better exit timing, and improved risk management.
Sentiment Analysis: The New Frontier
In the AI era, price is no longer the only source of truth. Sentiment is equally powerful. AI models scan:
News
Financial reports
Twitter
Reddit
Analyst commentary
CEO statements
Global events
Natural Language Processing (NLP) converts all this into actionable trading signals. For example, a sudden surge in negative sentiment often predicts a short-term drop in price.
Risks and Limitations of AI-Driven Trading
Despite its advantages, AI also brings challenges:
1. Overfitting
Models may perform well on historical data but poorly in live markets.
2. Black-Box Behavior
Deep learning models can be difficult to interpret.
3. Market Regime Shifts
AI can struggle when markets behave in ways not seen in training data.
4. Data Quality Issues
Incorrect, insufficient, or biased data leads to inaccurate predictions.
5. Overdependence
Traders relying entirely on AI may overlook fundamental risks or black swan events.
Successful AI trading requires human judgment, risk management, and continuous monitoring.
The Future of AI-Driven Trading
The AI trading era has only just begun. The future will likely include:
Fully autonomous trading systems
AI-powered portfolio optimization
Predictive risk models
Quantum computing–based trading algorithms
Personalized AI trading advisors
Real-time global sentiment heat maps
Markets will continue becoming faster, smarter, and more efficient. Traders who adopt AI early will have a powerful edge, while those who ignore it risk falling behind.