Bullish in all time frame good for swing tradingExpert Quantitative Analysis: Constructing High-Conviction Technical Momentum Screeners on Screener.in
I. Executive Summary: The Quantitative Rationale for Trend-Following
The successful implementation of quantitative swing trading strategies necessitates a disciplined approach to stock selection, focused on identifying assets where structural trends align with immediate momentum and institutional liquidity. This report outlines the construction of a multi-factor technical momentum screener designed specifically for the Screener.in platform. The resulting query identifies companies exhibiting established bullish structural trends, characterized by a long-term moving average alignment, confirmed by short-term price strength, significant trading volume, and adequate market capitalization for tradability.
The core strategy is rooted in classical trend-following principles, specifically leveraging the "Golden Crossover" where intermediate-term price action surpasses the long-term historical mean. Quantitative strategies gain validity when multiple, independent indicators converge to confirm the same directional bias. The simultaneous use of Moving Averages (defining trend structure), Relative Strength Index (measuring momentum velocity), and Volume (confirming institutional conviction) drastically reduces the incidence of false positives, which is critical for maximizing signal quality and minimizing drag in an execution environment. The report also addresses the platform’s limitations, proposing compensation strategies, including hybrid fundamental filters and proxies for sophisticated volatility analysis like the Volatility Contraction Pattern (VCP).
II. Architectural Analysis: Platform Constraints and Data Normalization
2.1 Screener.in's Quantitative Bias and the Limitation of Quantification
As an analytical tool, Screener.in focuses heavily on quantifiable financial and technical metrics. This specialization introduces a known limitation: the exclusion of crucial qualitative factors necessary for comprehensive due diligence. No stock screener provides direct information regarding idiosyncratic risks such as pending lawsuits, unresolved labor problems, or deteriorating customer satisfaction levels.
This confinement to quantifiable data requires the analyst to recognize that the output generated by the technical screener is merely a preliminary prospect list. A perfectly executed technical screen identifying stocks with optimal momentum characteristics can still yield a company facing severe fundamental or operational decay. The inherent limitation of quantification implies that post-screening qualitative and fundamental due diligence is a mandatory step to mitigate non-financial, idiosyncratic risks. Furthermore, analysts must be mindful of the data integrity. Since screeners rely on databases that update on varying schedules, verifying the relevance and timeliness of the data is paramount; untimely data renders the screening exercise analytically meaningless.
2.2 Data Integrity and Internal Calculation Adjustments
The reliability of any screening query, particularly those integrating fundamental filters, depends on the underlying calculation methodology. Screener.in standardizes several key financial ratios, enhancing data robustness.
For example, when calculating important metrics such as Price to Earnings (P/E) and Return on Capital Employed (ROCE), the platform removes extra-ordinary items. This adjustment is vital as it provides a cleaner, normalized measure of core operational performance and valuation, filtering out one-time windfalls or losses that might otherwise distort the perception of a company's sustained profitability. Additionally, the platform prioritizes Trailing-12-Months (TTM) numbers where available. The utilization of TTM metrics smoothes out volatility and seasonality inherent in raw quarterly data, offering a more stable and representative view of financial health, which is a significant advantage when combining technical and fundamental filters.
The standardization also extends to capital efficiency metrics. For calculating Return on Equity (ROE) and ROCE, the platform uses the average of the opening and closing capital employed. This practice prevents distortions caused by large, sporadic injections or withdrawals of capital at period ends, ensuring the calculated return ratios accurately reflect the efficiency of capital utilization over time. This standardization increases the confidence in integrating fundamental quality screens, such as a minimum ROCE requirement, alongside technical filters.
Screener.in Calculated Ratio Adjustments
Ratio Calculation Adjustment Quantitative Implication
Price to Earnings (P/E) Exclusion of Extra-Ordinary Items Cleaner, normalized measure of valuation based on core profitability.
Return on Capital Employed (ROCE) Exclusion of Extra-Ordinary Items; Use of Average Capital Employed
Higher integrity in measuring management efficiency and capital allocation.
Various Financials Use of Trailing-12-Months (TTM)
Smoother, less volatile representation of financial performance, avoiding quarterly seasonality.
2.3 Query Language Structure and Syntax
The Screener.in engine utilizes a straightforward, yet powerful, query language based on simple comparison logic (e.g., > or <) and supports the linkage of multiple criteria using Boolean operators such as AND and OR. This structure facilitates the creation of complex, layered screens, allowing the analyst to define a high-specificity profile that simultaneously satisfies requirements for trend, momentum, liquidity, and even quality. For example, screens can combine technical requirements (like DMA comparisons) with fundamental thresholds (like Market Capitalization, P/E, and ROCE) seamlessly.
III. Core Component 1: Defining the Macro Trend (Structural Analysis)
The foundation of any successful momentum or swing trading strategy is identifying a stock whose long-term structural integrity remains bullish. This structural analysis is best accomplished through the comparison of long-term and intermediate-term moving averages.
3.1 Structural Integrity: The Golden Crossover
The primary filter for confirming a sustained bullish structural trend is the Golden Crossover, defined as the 50-day Moving Average (DMA 50) crossing above the 200-day Moving Average (DMA 200).
The 200 DMA represents the long-term price trend, spanning approximately ten months of trading, while the 50 DMA represents the intermediate trend, reflecting two to three months of price action. When the intermediate trend surpasses the long-term trend, it signals that the recent price momentum is strong enough to sustain an overall bullish market phase.
The required filter for structural trend confirmation is expressed as: DMA 50 > DMA 200.
3.2 Mandatory Price Positioning (Immediate Strength)
While the Golden Crossover confirms the overall structural bias, it does not guarantee immediate buying interest; a stock might still be consolidating or pulling back toward the 50 DMA within an established bull trend. To maximize bullish momentum at the point of screening, it is necessary to filter for current price strength. By ensuring the current trading price is above the 50 DMA, the screen isolates stocks actively trending upward, rather than those undergoing a deep correction or consolidation phase.
The required filter for immediate strength is: Current price > DMA 50.
3.3 Moving Average Methodology and Implications
Technical analysis platforms distinguish between Simple Moving Averages (SMA) and Exponential Moving Averages (EMA). EMA applies greater weight to recent price data, making it more responsive and exhibiting lower latency compared to the SMA. While Screener.in uses the general term "DMA" , the typical implementation for major structural trends in conventional screeners defaults to SMA.
The selection of moving average methodology impacts strategy latency. If "DMA" defaults to SMA, the trend signal exhibits higher latency but offers greater stability and reliability over extended periods, making the structural filter robust against minor price fluctuations (whipsaws). This methodology ensures the resultant list is suitable for medium-term swing and position trading, aligning with the strategic objective of high-conviction momentum detection.
IV. Core Component 2: Ensuring Tradability and Liquidity
For effective algorithmic or discretionary trading, the selected stocks must possess sufficient liquidity to handle the required position size without significant price slippage during entry or exit. This requires filters based on both company size and trading volume.
4.1 Market Capitalization Thresholds (Risk Mitigation)
Market Capitalization serves as an excellent proxy for liquidity and institutional interest. Stocks with low market capitalization (e.g., micro-caps under Rs 500 Cr.) are inherently prone to higher volatility and potential manipulation. By setting a minimum market cap threshold, the screener targets established companies that attract greater institutional oversight and exhibit more stable price action.
Screener examples show various thresholds, such as Market Capitalization > 500 and Market Capitalization > 1000. For a high-conviction screen targeting stocks with substantial liquidity and institutional appeal, a minimum threshold of Rs 1000 Cr. is recommended.
The filter applied is: Market Capitalization > 1000
4.2 Volume Confirmation: Identifying Institutional Accumulation
A price movement, especially one confirmed by the Golden Crossover, requires validation from trading volume. Increased volume accompanying a price rise signals strong institutional or heavy retail interest, lending conviction to the momentum signal. Filtering for above-average trading volume provides confidence that the move above the moving averages is strongly supported and likely to continue.
The platform supports comparative volume metrics, allowing the volume of the latest day/week to be compared against historical averages, such as the 1-month average. The analysis suggests calibrating volume sensitivity carefully. While extremely aggressive filters, such as requiring volume to be five times the monthly average (Volume > Volume 1month average * 5) , indicate an explosive, often climax-like event, this magnitude frequently signals the tail end of a massive move or a short-lived anomaly. For sustainable swing trade setups that reflect consistent accumulation, a moderate yet significant volume increase is preferred. Requiring volume to be at least two times the 1-month average provides confirmation of heavy buying pressure without demanding an unsustainable spike.
The required filter for confirmed accumulation is: Volume > Volume 1month average * 2
V. Core Component 3: Confirming Momentum and Price Health (Oscillators)
Oscillators are essential for measuring the velocity of the current price trend and ensuring that the stock is participating robustly in the uptrend identified by the moving averages.
5.1 Relative Strength Index (RSI) for Momentum Velocity
The Relative Strength Index (RSI) measures the magnitude of recent price changes to evaluate overbought or oversold conditions. For bullish swing trading, the objective is to find stocks that demonstrate strong bullish momentum (RSI above 50) but have not yet entered immediate overbought territory (typically 70 or higher), thus retaining headroom for price appreciation.
Combining the structural trend filter (DMA 50 > DMA 200) with an RSI filter ensures that not only is the trend structurally up, but the stock is also currently experiencing active buying pressure and momentum. The minimum threshold to confirm bullish velocity is 50.
The required momentum filter is: RSI > 50.
5.2 Secondary Confirmation: MACD Crossover Analysis
The Moving Average Convergence Divergence (MACD) indicator provides a lagging, trend-following momentum signal derived from the difference between two exponential moving averages. Screener.in supports screening for the MACD crossing its signal line.
The MACD filter serves as an optional, secondary confirmation signal. The standard, default MACD settings utilized by most analytic platforms, including the likely standard for Screener.in, are: Fast Length (12 periods), Slow Length (26 periods), and Signal Line (9 periods), typically all based on the closing price using Exponential Moving Averages (EMA). Since the platform does not offer customization for these parameters, the MACD filter functions as a binary confirmation based on conventional, intermediate-term settings. A bullish MACD crossover—where the MACD line moves above the signal line—suggests accelerating momentum.
An optional filter for MACD confirmation: Use the pre-defined screen or filter if available on the Screener.in interface: MACD crossing the MACD Signal Line.
VI. Synthesis: The Master Technical Screener Query
The synthesis of the core components yields a high-conviction technical momentum screen. This query is designed to systematically eliminate low-quality, illiquid, or non-trending stocks, leaving a refined list of candidates suitable for swing trading entry.
6.1 The High-Conviction Momentum Query Logic
The final query combines all five essential criteria using the AND operator to ensure that every stock identified satisfies the requirements for structural trend, short-term strength, bullish momentum, high liquidity, and confirmed institutional accumulation.
6.2 Final Optimized Query Syntax
The Master Technical Screener Query
Component Constraint / Rationale Screener.in Query Syntax Source(s)
Structural Trend Golden Crossover (50-day above 200-day) DMA 50 > DMA 200
Immediate Trend Current price above short-term support Current price > DMA 50
Momentum Health Strong bullish pressure, not overbought RSI > 50
Liquidity Minimum Filtering for stable mid/large-cap stocks Market Capitalization > 1000
Accumulation Spike Confirmed by significant buying volume Volume > Volume 1month average * 2
Full Compound Query (Combines all above with AND logic) DMA 50 > DMA 200 AND Current price > DMA 50 AND RSI > 50 AND Market Capitalization > 1000 AND Volume > Volume 1month average * 2 Multiple
6.3 Step-by-Step Implementation Guide on Screener.in
The execution of this query follows a standardized process:
Access the Creation Tool: Navigate to the Screener.in homepage and click on the "Create a stock screen" option, typically found in the tools menu or main navigation.
Input the Query: Copy and paste the full compound query string directly into the main search box provided for customized queries.
Run and Review: Execute the query by clicking "Run this Query."
Save and Monitor: To ensure the analyst can track signals dynamically, the screen should be saved for future use and an email alert set up. This step is crucial for capturing trade signals in real-time as market data and TTM financials are updated.
VII. Advanced Quantitative Techniques: Simulating Volatility Contraction and Quality (VCP/ATR Proxy)
While the Master Technical Screener focuses on momentum breakouts, algorithmic strategies often benefit from identifying consolidation patterns before the breakout occurs. This requires measuring volatility contraction, a concept often associated with the Volatility Contraction Pattern (VCP).
7.1 The Limitation of Direct Volatility Measurement
Advanced volatility metrics, such as Average True Range expressed as a percentage of price (ATR%), are essential for comparing volatility relatively across different instruments and timeframes. ATR% is calculated by dividing the ATR (a measure of true price range, including gaps) by the closing price and multiplying by 100. This normalization is crucial for identifying market regime shifts (volatility expansion/contraction). However, standard screeners like Screener.in typically lack the complex syntax necessary to calculate and filter using this normalized metric directly.
Consequently, to identify stocks forming a VCP—which typically requires proximity to a high, contracting volatility, and contracting volume —the analyst must construct robust proxies using available platform filters.
7.2 Proxy 1: Price Proximity to Highs
The VCP pattern usually culminates in a tight price contraction near a pivot point (a recent high), signaling that supply has dried up and the price is poised for a high-volume breakout. We can simulate this proximity by requiring the current price to be within a certain percentage of its historical high price. A constraint requiring the price to be greater than 85% of its high price is a commonly used method to isolate stocks near breakout potential.
VCP Filter (Proximity): Current price > 0.85 * High price
7.3 Proxy 2: Volume Contraction
In contrast to the momentum screen, which seeks expanding volume (accumulation), the VCP setup requires contracting volume during the consolidation phase. Contracting volume signifies that the sellers who opposed the previous high have been exhausted, confirming reduced selling pressure before the expected price expansion. This requires the recent average volume to be lower than the intermediate average volume.
VCP Filter (Contraction Volume): Volume 1week average < Volume 1month average
7.4 Proxy 3: Integrating Fundamental Quality for VCP Conviction
VCP is often most reliable when observed in fundamentally strong companies. Institutional investors typically maintain large positions in quality firms, leading to consolidation patterns as they hold through volatility, allowing supply to diminish naturally. Integrating filters for efficient capital deployment (ROCE) and sales growth leverages the platform’s reliable, TTM-based fundamental data. Requiring a high ROCE (e.g., above 22%) and robust multi-year sales growth ensures that the technical pattern is backed by demonstrable corporate performance.
VCP Filter (Quality): Return on Capital Employed > 22% AND Sales growth 3Years > 25%
7.5 The VCP Proxy Screener (Alternative Consolidation Query)
This alternative query identifies stocks in a strong structural uptrend that are currently consolidating with low volume near recent highs, suggesting they are primed for a high-volume momentum breakout.
VCP (Volatility Contraction Pattern) Proxy Screener Query
Component VCP Concept Proxied Screener.in Query Syntax Source(s)
Structural Trend Long-term support for pattern DMA 50 > DMA 200
Pivot Proximity Price near historical resistance Current price > 0.85 * High price
Volume Contraction Quiet consolidation/drying up of supply Volume 1week average < Volume 1month average
(Implied)
Fundamental Quality Institutional holding conviction Return on Capital Employed > 22% AND Sales growth 3Years > 25%
VIII. Risk Management and Algorithmic Workflow Integration
8.1 The Techno-Fundamental Hybrid Approach
To mitigate the technical blind spots inherent in pure momentum screens (such as identifying stocks that are Market Laggers rather than true Momentum Stocks ) and to address the platform's qualitative limitations , the final workflow must integrate foundational fundamental filters. These hybrid checks add a layer of financial soundness to the technically generated signal.
Examples provided in the Screener.in syntax demonstrate the integration of valuation and efficiency metrics alongside technical criteria. Recommended hybrid filters, applied after the technical criteria are met, include:
A valuation cap to avoid excessively speculative pricing: Price to earning < 30.
A minimum efficiency standard: Return on Capital Employed > 20%.
8.2 Dynamic Monitoring and Alert Systems
Momentum-based strategies thrive on timely execution. The dynamic nature of price and volume data necessitates rapid responsiveness. After saving the high-conviction query, the crucial step of setting up email alerts ensures that the analyst receives actionable trade signals immediately following the update of daily technical data and TTM figures. This dynamic monitoring transforms the static screen into a proactive detection system.
8.3 Defining Exit Criteria (Stop-Loss Reference)
A robust quantitative framework necessitates that the criteria used for entry are structurally linked to the criteria used for exit. The moving averages utilized in the initial screen serve as ideal dynamic stop-loss references.
If a stock is selected because its price demonstrates strength, specifically due to the constraint Current price > DMA 50 , the subsequent breaking of the 50 DMA constitutes a clear invalidation of the short-term trend premise. The logical extension of this rule is that the 50 DMA should function as the initial stop-loss reference (whether implemented as a hard or mental stop). This critical linkage ensures the screening input directly dictates a key risk management output, completing a systematic and objective trade lifecycle.
8.4 Industry-Specific Blind Spots
Technical analysis should always be contextualized by industry norms. The analyst must recognize that screeners inherently possess industry-specific blind spots. For instance, expecting very low Price to Earnings (P/E) valuations in high-growth technology companies is often unrealistic due to sector-specific valuation methodologies.
Therefore, if the general P/E filter (e.g., P/E < 30) excessively limits results in a fast-growing sector like IT Services or Financial Technology , the analyst should consider running the screen specifically within those sectors and adjusting the P/E multiplier upward. Conversely, running the screen across highly cyclical industries (e.g., Metals & Mining) may require stricter P/E controls or prioritizing ROCE and growth metrics over short-term valuation. This specialized tuning based on sector analysis maximizes the efficacy of the momentum strategy by adjusting for industry-standard valuation deviations.
Contains IO script
Infibeam Avenue BullishScreaming Bullish on both daily and weekly setup.
Created a double bottom, ( there is no breakout though)
breaking a previous high.
There is resistance at square box, but once it is broken it should go up easy.
It crossed it's 200 EMA and above all moving averages.
RSI showing strength.

sell side trade in GoldGold has taken rejection from top liquidity sweep .. taking sell side trade in Gold with a Sl of 4268 for target 4223 target 1 .. bearish target will be updated once new bearish levels are plotted on the chart .

PNB Pulling back from a decade long Monthly resistance#PNB is pulling from a decade-long monthly resistance.
I will be selling futures/CE for the target of 104.
Not a recommendation.
#PNB #Trading #Tradingview #OptionTrading #Nifty #BANKNIFTY

#POLYCAB breaking crucial support along with forming COCH#POLYCAB has broken the crucial support of the 7300-7280 range. Might move towards the 0.236 Fibonacci level.
It's Sell CE for me.
Not a recommendation.
#Trading #Tradingview #POLYCAB #NIFTY #OptionTrading

Gold bullish trade golden reversal level holds the power to change the trend of price .
if price comes here and take rejection we can see a bullish price moment from here and if price closes below golden reversal we can see a bearish moment from here .. so todays important level for gold is golden reversal . bullish and bearish levels are not yet plotted on the chart i will update once levels get active on the chart .

bullish trade in nifty anticipating this buy trade in nifty from mid reversal level .
there was gap on this nifty chart for 26th Nov, Gap filled and we had mid reversal level there .. so expecting a price to turn bullish from here .

silver buy trade buy silver from bottom liquidity sweep with sl below the zone as we have seen rejection on smaller time frame . target liquidity sweep top .
bullish levels are not yet open I will update the chart once above bullish levels are active .

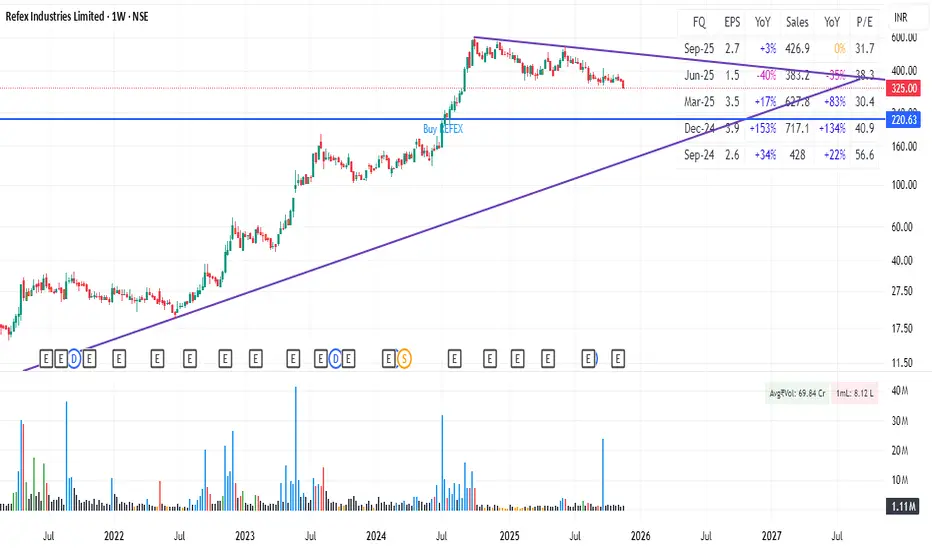
A DIRTY SCAM - DECODED BY GOOGLE GEMINI AIThe connection between Refex Industries and Gensol Engineering is not just a random business deal; it traces back to a tight-knit relationship between their promoters and a failed attempt to "bail out" Gensol from its mounting debt crisis.
The "smoking gun" is a specific transaction in early 2025 that was announced and then abruptly cancelled when regulatory heat increased.
The "Rescue Act" Chronology
1. The Personal Link (The Foundation)
The Players: Anmol Singh Jaggi (Promoter of Gensol & BluSmart) and Anil Jain (MD of Refex Industries).
The Connection: Anil Jain was an early angel investor in BluSmart, the ride-hailing app founded by the Jaggi brothers.
The Business: Refex Industries (via its subsidiary Refex Green Mobility) was already a vendor to BluSmart, leasing over 1,000 electric cars to them. This created a symbiotic relationship: Gensol made the cars (allegedly), and Refex leased them to the Jaggi brothers' other company, BluSmart.
2. The "Bailout" Attempt (January 16, 2025)
The Crisis: By late 2024, Gensol was drowning in debt and facing questions about "missing" EV assets. They needed to get debt off their books fast.
The Deal: Gensol announced it would sell 2,997 EVs to Refex Green Mobility.
The Catch: Refex wouldn't just pay cash; they agreed to take over ₹315 Crore of Gensol's loan liabilities.
The Optic: This would have instantly cleaned up Gensol's balance sheet, making it look debt-light to investors. Gensol stock jumped 7% on this news.
3. The Cancellation & SEBI Probe (March 28, 2025)
The Trigger: SEBI’s investigation deepened. The regulator found that Gensol had taken loans for 6,400 cars but only physically bought ~4,704. The "missing" cars were a major red flag.
The U-Turn: On March 28, just days before the SEBI interim order, Refex and Gensol "mutually cancelled" the deal.
The Result: Refex walked away safe. Gensol was left holding the toxic debt and the "ghost" assets. Gensol stock crashed 5% immediately.
The Verdict: Is Refex "Dirty"?
While Gensol is the primary offender (accused of fraud/diversion), Refex’s role raises valid concerns about Capital Allocation.
The "Friendly" Risk: Refex management was willing to take on ₹300Cr+ of debt from a related party (where their MD is an investor) just to help them out. This is a classic "Corporate Governance" yellow flag—using public company money to help a friend’s distressed company.
The Saver: To their credit, Refex did back out before the deal closed, protecting their shareholders from the actual loss. This suggests they have a "kill switch" when risks get too high, unlike Gensol.
Actionable Insight for You
Gensol: Uninvestable. The "missing cars" and SEBI ban on promoters are fatal flaws.
Refex: Watch with Caution. They are not "fraudulent" like Gensol, but their willingness to entertain such a risky deal suggests their Board might be too cozy with the Jaggi ecosystem. If you own Refex, monitor their Related Party Transactions closely in the next quarterly report.
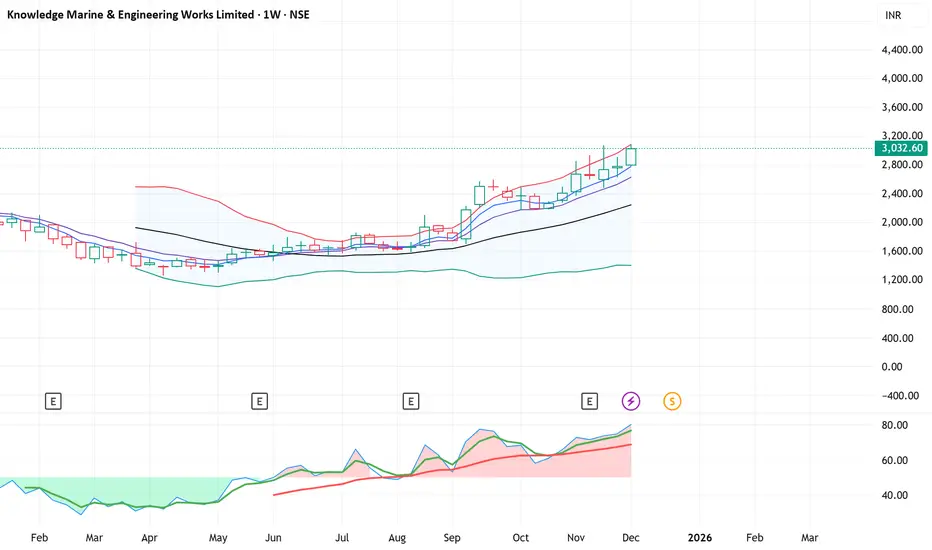
Nifty Hits Our 26250 Target — Now Time to ObserveNifty Hits Our 26250 Target — Now Time to Observe
NSE:NIFTY has been moving exactly the way we planned.
The target we marked — 26250 — got achieved today.
I’m more than satisfied trading this entire 300-point move in the index, especially when swing setups weren’t matching my environment.
Nifty still isn’t too stretched to say a proper pullback is here, but a small squat can’t be ruled out.
My indicator is already showing “BP” — meaning weekly traders may start profit booking.
I want to see if that reflects on the daily chart the same way it showed up on the hourly.
So tomorrow I won’t trade aggressively. I’ll just observe and prepare for next week’s structure.
Here are the levels for tomorrow:
Support: 26132
Resistance: 26250 — above this, the next move can push towards 26303
Market breadth has dropped, so I won’t be focusing on stock picking for now.
My eyes will stay on the index and a few large-cap FnO setups only.
That will be all for the day.
Take care. Have a profitable tomorrow.
WTI crude getting ready for 67$It has been a while preparing for this and the lower Bollinger band has moved up to 58.58 in the meantime as immediate support. The indication remains that wave c higher will unfold. I cannot determine right away if this is wave c or iii and that we can conclude later but one leg higher first is what I am seeing.

Silver ends wave ii of CYes, that was quick for silver to end wave II of C, but exactly at 61.8% is not a surprise. Wave iii of C should take it down to 47.55 now so ride the wave lower. Silver has topped out for the year

Dr Reddy ,option buying(1260Ce)
Monthly price has crossed 20ema, currently price has entered one weekly tested supply zone.
Weekly all the supply zones are tested ,and currently price is moving from a point where previous upward rally was observed.
In daily time zone , one gap which was created by previous downfall is filled, a minor consolidation at current price is expected and then upmove is expected till 1300.
If price cross weekly 20ema , which give entry confirmation ,one can enter the trade
One can buy option and hold till 1300 price is touched and then can make an exit.

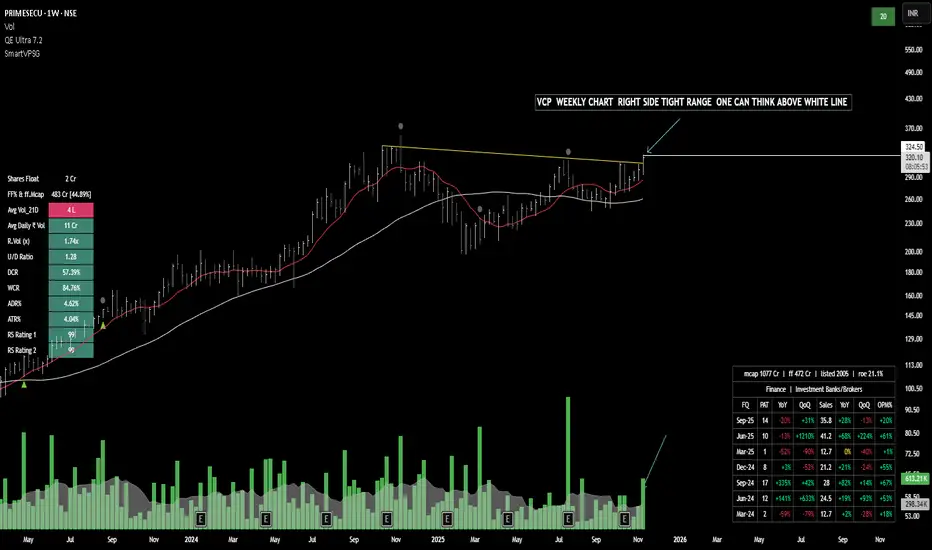
TRADE WITH SIMPLE LINEchart is looking good on weekly time frame, it is all time high , volume buildup and range clear right hand side , keep eye on above white line
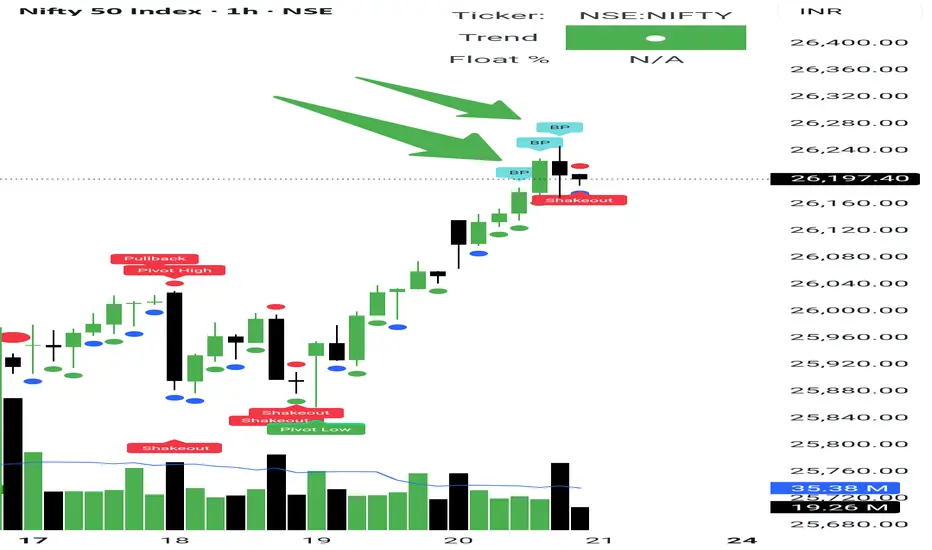
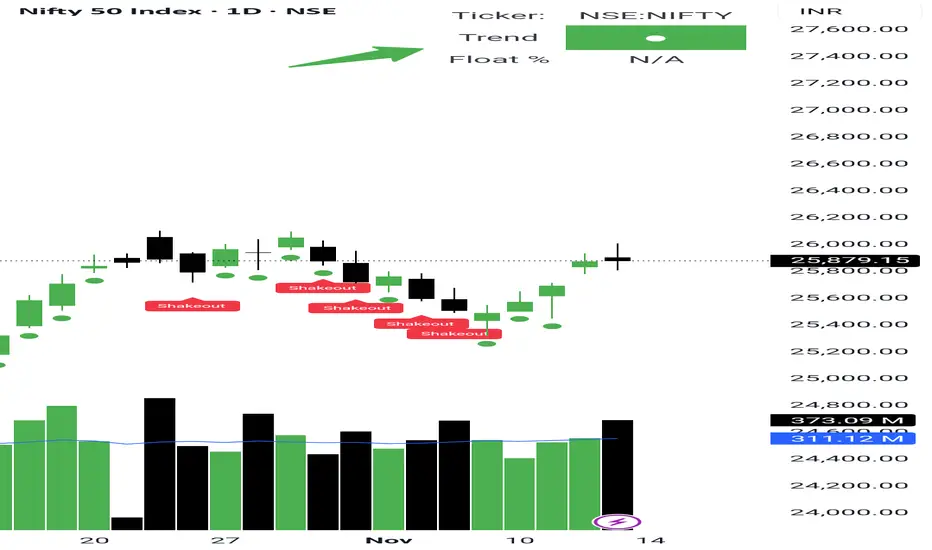
Nifty’s Shakeout Sets the Stage for a Bullish Run Yesterday’s sellers’ data played out perfectly today — after touching 26000, NSE:NIFTY closed below the day’s open. A classic shakeout.
Pivot has now climbed to 25899 despite a red candle, which clearly shows long buildup is still happening.
The plan is simple — go long on a dip, or go long above 25909 with a target of 26200.
But if 25834 breaks, then 25700 becomes the next support zone to accumulate fresh longs again.
Now here’s the interesting part — even with today’s low close and higher sellers’ volume, Nifty’s health has turned Green (top-right corner on the chart).
This is a very strong signal for the coming weeks.
Trend has clearly turned positive. Bulls are getting ready to roar.
As mentioned yesterday, pharma stocks continue to build strength for short term opportunities.
📊 Levels at a glance:
Pivot: 25899
Long above: 25909
Support: 25834 / 25700 (buy zone)
Upside target: 26200
Market Health: Green
Bias: Bullish with shakeout confirmation
Sector to watch: NSE:CNXPHARMA
Gold to make one final pushGold is falling today, but probably in wave iv of C. Gold is bouncing back in ABC or three waves inside an X wave or a counter-trend bounce. This should be the final push toward the 61.8% retracement mark near 4192. Some people want me to use hourly charts and mark the end hurriedly. Even on the hourly silver chart, I could only see wave iv yesterday. A daily time frame is a better confirmation. Wait for your turn.

OPENDOOR AnalysisI have done the analysis on OPENDOOR. It has consolidated for 2 months after making the recent high. There was big pull back on Friday. And this pullback will continue in next week. All upcoming targets are coming.

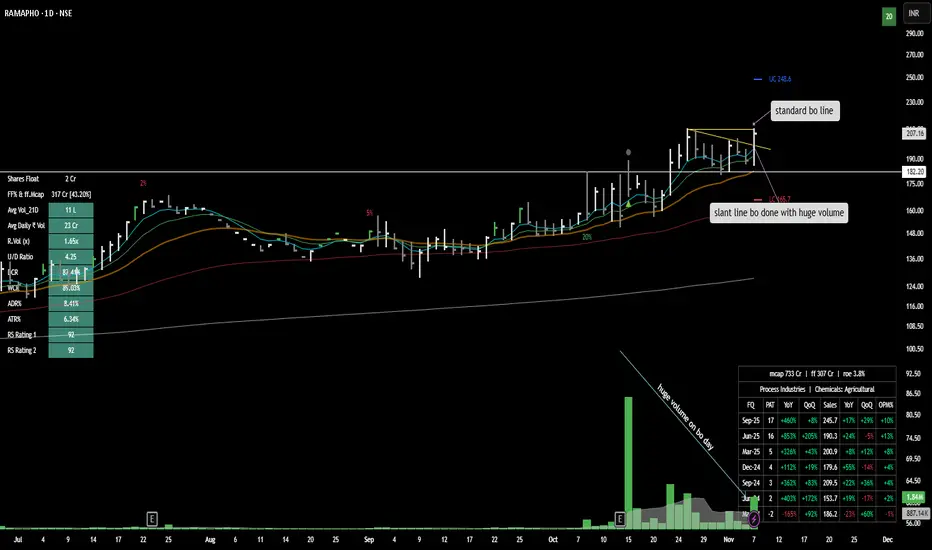
long base bo and forming small base1. Breakout Confirmation With Huge Volume
The chart highlights a slant line breakout accompanied by exceptionally high volume, signaling strong market participation and increased buying interest on the breakout day.
2. Standard Breakout Line Resistance
A standard breakout line is marked, showing price action tested and subsequently surpassed this resistance, confirming a bullish setup.
3. Strong Up/Down Ratio and Relative Strength
The U/D (Up/Down) ratio is 4.25 and RS Rating is 92, indicating strong outperformance compared to the market and buying pressure relative to selling.
4. Healthy Float and Liquidity Metrics
Shares float stands at 2 Crore and the free float market cap is 317 Cr, supporting decent liquidity for trading, while the daily average turnover is 23 Cr.
5. Consistent Financial Growth
Quarterly summary boxes show substantial profit and sales growth, with YoY and QoQ improvements in PAT, Sales, and OPM%, highlighting healthy fundamentals.
6. Technical Breadth And Momentum
The stock maintains high CCI (87) and WCK (85%), and is above key moving averages, while ADR (8.41%) and ATR (6.34%) signal strong price volatility and ongoing momentum.
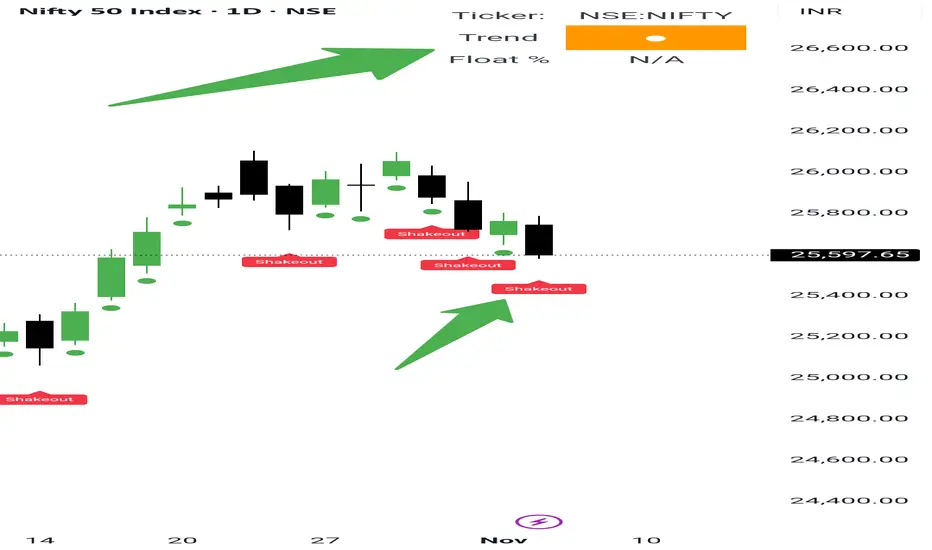
Bulls accumulating with Shakeouts in index! Stay sharp. NSE:NIFTY has now closed below our support level of 25666, exactly as we discussed over the last few days.
You guys were already warned back on October 24 that Nifty’s health was turning “Orange”, so if still your portfolio is showing losses, it’s time to take learning seriously. First you learn, then you earn.
Also remember, when the overall market environment turns weak, your intraday and momentum stocks won’t work the same way they usually do. It’s okay. It’s normal.
We might need to wait through this week. From next week, conditions should start improving as the monthly breadth continues to get stronger.
Yesterday, #Nifty gave a big red candle, but it was just a shakeout within the ongoing uptrend. The overall market health is still orange and hasn’t turned red yet.
Now, Nifty’s Pivot has slipped slightly lower to 25654. This will act as intraday resistance for tomorrow. Once this level breaks, we could see sharp short covering.
Remember — this is just a shakeout within a normal pullback, and bulls are still accumulating quietly.
The next key support is at 25550. If that breaks too, 25350 would be the next target. However, that’s less likely since the broader trend remains bullish. But still, market is market — so stay alert.
Short-term traders should keep an eye on #Defence, #Finance, and #Auto_Ancillaries sectors.
Long-term investors should study #Infra, #Metals, #NewAgeTech, and #ShipBuilding sectors — including their proxy plays.
This is a good time to accumulate quality stocks with a TechnoFunda approach. Focus on companies showing strong sales growth, rising earnings, improving EPS, and high accumulation on technical charts.
📊Levels at a glance:
Pivot: 25654 (Intraday resistance)
Support: 25550 / 25350
Market Health: Orange (cautious accumulation phase)
Bias: Bullish long term, short-term shakeout ongoing
Sectors for short term: Defence, Finance, Auto Ancillaries
Sectors for long term: Infra, Metals, New Age Tech, Ship Building
Strategy: Accumulate quality stocks with strong TechnoFunda setup
That’s all for the day. Take care and have a profitable tomorrow.
poclStrong long-term uptrend still intact.
Minor pullback (-12.9 %) is likely a normal consolidation.
RS 90 and EPS Growth +45 % = leadership stock in current cycle.
Volume pattern confirms accumulation, not distribution.
New breakout possible if price clears ₹1,500 with volume > 1 M shares.
Stop-loss for traders could be near ₹1,200 (8 – 9 % below current).
Long-term investors may trail stops below ₹1,000 support.
Fundamental backdrop (lead recycling, green metals) supports trend continuation.
No red technical divergences visible yet.
Overall rating: Bullish / Strong Uptrend Continuation candidate

XAUUSD Down TrendMultiple confirmation shows and confirms that XAUUSD Down Trend entry made on next candle opening good to go
Deslamer: not a financial advice do your own research and enter in a trade its for just educational purpose only to know more message

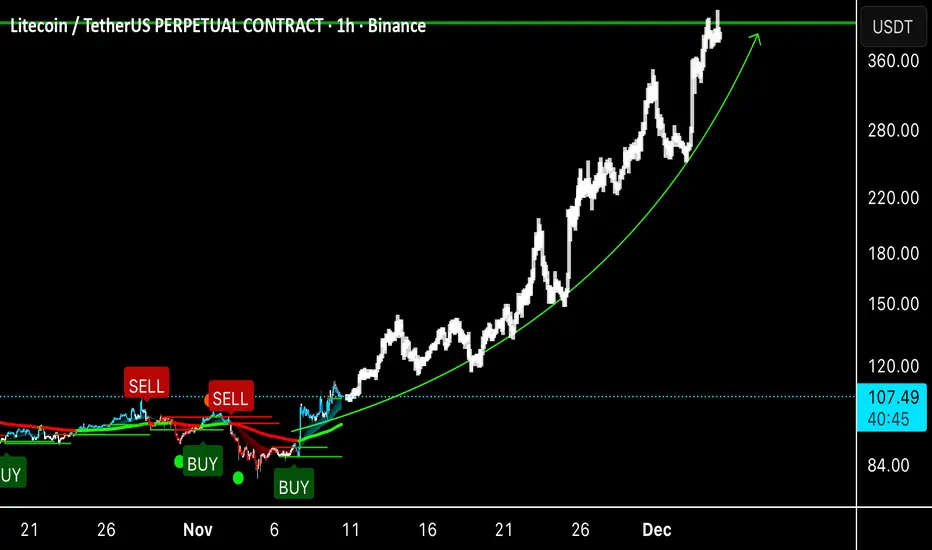
A very simple method of trading with the trendA very simple method of making sure you are trading with overall trend using PAR looking at TOTAL 3
