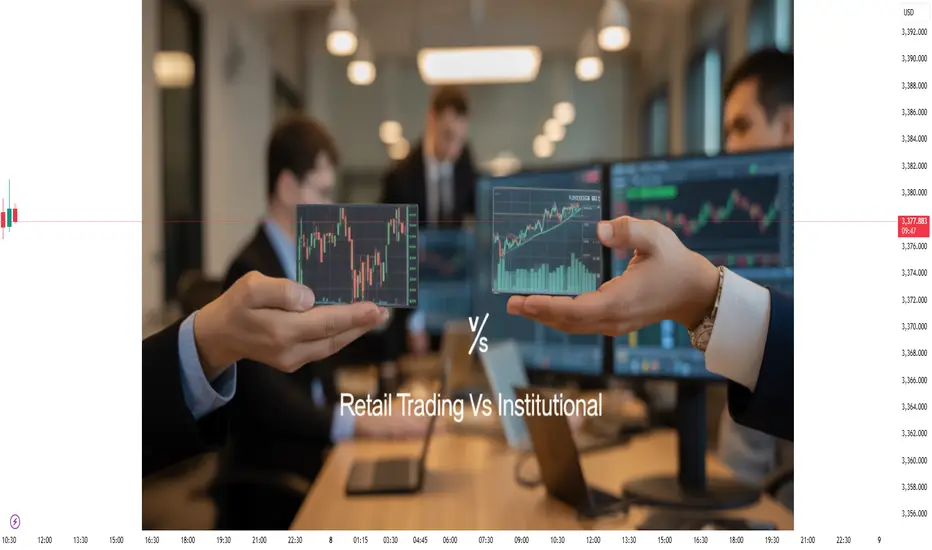
Retail vs Institutional Trading Introduction
The stock market serves as a vast arena where two primary participants operate — retail traders and institutional traders. Both these groups play crucial roles in the financial ecosystem but differ drastically in terms of capital, strategies, access to information, and influence on the market.
Understanding the dynamics between retail and institutional trading is vital for any market participant — whether you're an investor, trader, analyst, or policymaker. This in-depth analysis unpacks the core differences, strategies, advantages, disadvantages, and market impact of both retail and institutional traders.
1. Definition and Key Characteristics
Retail Traders
Retail traders are individual investors who trade in their personal capacity, usually through online brokerage accounts. They use their own capital and typically trade in smaller volumes.
Key characteristics of retail traders:
Trade small positions (1–1000 shares)
Use online brokerages like Zerodha, Robinhood, or E*TRADE
Rely on public news, retail-focused tools, and charts
Often influenced by social media and sentiment
Usually part-time or hobbyist traders
Institutional Traders
Institutional traders trade on behalf of large organizations, such as:
Mutual funds
Hedge funds
Pension funds
Insurance companies
Sovereign wealth funds
Banks and proprietary trading firms
Key characteristics:
Trade large blocks (10,000+ shares)
Access to sophisticated tools, real-time data, and dark pools
Employ quantitative models and professional teams
Long-term investment strategies or high-frequency trading
Can move markets with a single trade
2. Access to Information & Tools
Retail Access
Retail traders are usually last in line when it comes to access:
Get news after it's public
Use delayed or less granular market data
Basic tools (e.g., TradingView, MetaTrader, ThinkOrSwim)
May rely on YouTube, Twitter, Reddit (e.g., r/WallStreetBets)
Institutional Access
Institutions enjoy early and exclusive access:
Bloomberg Terminal, Reuters Eikon, proprietary feeds
Real-time Level II and III market data
Insider connections (e.g., earnings calls, conferences)
AI-powered data analytics and algorithmic models
Conclusion: Institutional traders operate with a significant information edge.
3. Capital and Buying Power
Retail Traders
Typically operate with limited capital — from ₹10,000 to ₹10 lakhs (or more)
Use margin cautiously due to high risks and interest costs
Constrained by capital preservation and risk tolerance
Institutional Traders
Manage hundreds of crores to billions in assets
Use prime brokerages for margin, shorting, and leverage
Can influence market pricing and supply-demand dynamics
Conclusion: Institutions have a massive capital advantage, enabling economies of scale.
4. Market Impact
Retail Traders’ Impact
Minimal direct impact on prices individually
Collectively can drive momentum trades or short squeezes (e.g., GameStop, Adani stocks)
More reactionary than proactive
Institutional Traders’ Impact
Can shift entire sectors or indices with a single reallocation
Often deploy block trades, iceberg orders, and dark pools to mask intent
Central to price discovery and volume
Conclusion: Institutional flow is the dominant force in price action, while retail adds volatility and liquidity.
5. Trading Strategies
Retail Traders' Strategies
Retail traders typically rely on:
Technical Analysis: Candlesticks, RSI, MACD, chart patterns
Swing Trading / Intraday
News-based or Sentiment-based Trading
Options trading with small lots
Copy trading or Telegram tips (not recommended)
Behavioral tendencies:
Fear of missing out (FOMO)
Overtrading
Chasing breakouts or rumors
Institutional Strategies
Institutions use more structured approaches:
Fundamental Analysis: DCF, macro trends, earnings forecasts
Quantitative Trading: Algorithms, statistical arbitrage
Hedging & Risk Modeling
Portfolio Diversification & Rebalancing
High-Frequency Trading (HFT)
Behavioral tendencies:
Discipline over emotion
Regulatory compliance
Portfolio-level thinking, not trade-by-trade
Conclusion: Retail strategies are shorter-term and emotional, while institutional strategies are data-driven and systematic.
6. Cost of Trading
Retail Traders
Pay higher brokerage fees (especially in traditional full-service brokers)
Have wider bid-ask spreads
Face slippage during volatile moves
No access to negotiated commissions
Institutional Traders
Enjoy preferential fee structures
Access lower spreads via direct market access (DMA)
Use smart order routing to reduce costs
May participate in dark pools to hide trade intent
Conclusion: Institutions enjoy cheaper and more efficient execution.
7. Emotional vs Rational Decision-Making
Retail Traders
Highly influenced by emotions: greed, fear, hope
Overreact to headlines and rumors
Lack discipline and trade management
Often trade without stop-loss
Institutional Traders
Decision-making is systematic and risk-managed
Operate with clear mandates, risk teams, and drawdown controls
Use quantitative models to remove human error
Conclusion: Institutions are generally rational and rule-based, while retail is often impulsive.
8. Regulations and Restrictions
Retail Traders
Face basic regulations (e.g., KYC, margin limits)
No oversight in strategy or risk exposure
Limited access to instruments (e.g., no direct access to foreign derivatives or institutional debt)
Institutional Traders
Heavily regulated by bodies like SEBI, RBI, SEC, etc.
Must follow:
Disclosure norms
Risk-based capital adequacy
Audit and compliance checks
Subject to insider trading laws, fiduciary responsibilities
Conclusion: Retail is freer but riskier, institutional is compliant but structured.
9. Education and Skill Levels
Retail Traders
Largely self-taught
Learn via:
YouTube, Udemy, Twitter
Paid telegram groups, mentors
Often lack deep financial literacy
Institutional Traders
Often have backgrounds in:
Finance, Economics, Math, Computer Science
MBAs, CFAs, PhDs
Supported by quant teams, analysts, economists
Conclusion: Institutional traders have stronger academic and experiential grounding.
10. Time Horizon and Holding Period
Retail Traders
Mostly short-term focused: scalping, intraday, swing
Rarely think in portfolio terms
Less concerned with long-term CAGR
Institutional Traders
Long-term focused (mutual funds, pension funds)
Hedge funds may have medium-term or tactical outlook
Often look at multi-year trends, sector rotation, macro cycles
Conclusion: Retail thinks in days or weeks, institutions think in years.
Conclusion
The divide between retail and institutional traders is significant but narrowing. While institutions dominate in terms of capital, technology, and influence, retail traders now have unprecedented access to tools and knowledge.
For success in modern markets:
Retail traders must focus on discipline, risk, and learning
Institutional players must remain agile and avoid herd behavior
Both groups are vital to the health and vibrancy of the financial markets. Understanding the strengths and limitations of each helps investors better navigate today’s complex market landscape.
Corecrypto
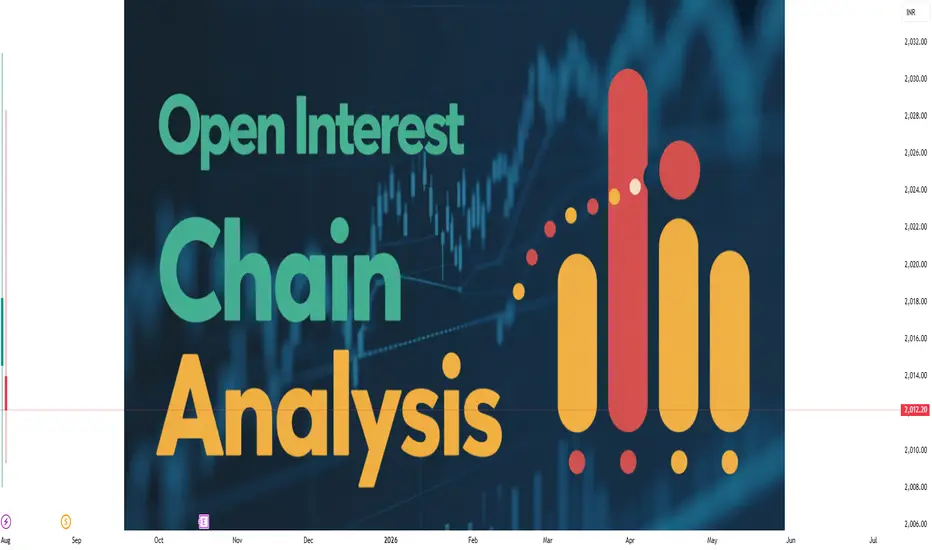
Open Interest & Option Chain AnalysisOptions trading has grown rapidly among retail and institutional traders due to its strategic flexibility and leverage. Two of the most critical tools for options traders are Open Interest (OI) and Option Chain Analysis. These tools provide deep insights into market sentiment, potential support and resistance levels, and liquidity zones. This guide will walk you through the concepts of Open Interest, Option Chain interpretation, real-world strategies, and how to apply this knowledge for smarter trading decisions.
🔹 What is Open Interest?
Open Interest refers to the total number of outstanding options contracts (calls or puts) that have not been settled or closed. It reflects how much active participation exists in a particular strike price and expiry.
Key Points:
Increase in OI: Indicates that new positions are being added (either long or short).
Decrease in OI: Means traders are closing out positions.
High OI: Signals strong interest in that strike price – potentially a key level for support or resistance.
Unlike volume (which resets daily), OI is cumulative and updates after the close of each trading day.
Example:
You buy 1 lot of Nifty 17000 CE, and someone sells it to you → OI increases by 1.
You later sell it and the counterparty closes their position too → OI decreases by 1.
🔹 What is an Option Chain?
An Option Chain is a table displaying all available option contracts for a specific stock/index across various strike prices and expiries. It includes data such as:
Strike Call OI Call LTP Put LTP Put OI
17500 1,20,000 ₹75 ₹30 90,000
17600 2,40,000 ₹45 ₹40 2,00,000
Key Elements:
Strike Price: Price at which the option can be exercised.
Calls vs Puts: Calls are on the left; puts on the right (or vice versa).
LTP: Last Traded Price.
OI & Change in OI: Used to spot where the smart money is positioned.
🔹 How to Read Open Interest in the Option Chain
OI provides crucial support and resistance data. Here's how to read it:
1. High Call OI ➝ Resistance
Traders are selling call options at that level, expecting the price won’t rise above it.
2. High Put OI ➝ Support
Traders are selling puts, expecting the price won’t fall below it.
3. Change in OI (Today’s change) ➝ Trend confirmation
Positive change in Call OI + Price Falling → Bearish
Positive change in Put OI + Price Rising → Bullish
🔹 Multi-Strike OI Build-Up
Sometimes, OI builds up in multiple strike prices above/below the spot. This forms resistance/support zones.
Example:
Call OI: 17800 (3L), 17900 (2.7L), 18000 (4.1L)
Strong resistance between 17800–18000
Breakout above 18000 is significant.
🔹 Intraday Option Chain Analysis
For intraday traders, changes in OI on a 5- to 15-minute basis can reveal sharp shifts in sentiment.
Use Change in OI (Live updates).
Look at IV (Implied Volatility): Spikes can indicate event-based risk.
Combine with Volume Profile, VWAP, and Price Action.
Example:
At 11 AM, sudden jump in Put OI at 17700.
Price bouncing from 17720 → Intraday long trade setup.
🔹 Common Mistakes to Avoid
Looking at absolute OI only – Always compare to change in OI.
Ignoring context – Use OI in combination with price, volume, and trend.
Chasing false breakouts – Wait for OI shift confirmation.
Trading illiquid options – Stick to strikes with high volume and OI.
🔹 Tools for Option Chain Analysis
NSE India Website – Free option chain.
Sensibull, Opstra, StockMock – Visual OI charts and PCR.
TradingView OI Indicators – Live OI overlays.
Fyers/Webull/Zerodha – Broker-integrated data.
🔹 Advanced: OI Spreads & Traps
OI data can also reveal where retail traders are trapped:
Call writers trapped when price shoots up → Short covering leads to spikes.
Put writers trapped when price falls → Sudden breakdown.
Watch for spikes in volume + OI unwinding.
🔹 Summary: Step-by-Step Framework
Step Action
1 Identify spot price and trading range.
2 Look for highest Call & Put OI levels.
3 Observe changes in OI throughout the day.
4 Use PCR for overall bias.
5 Confirm with price action before trade.
6 Exit if OI starts shifting against your trade.
🔹 Conclusion
Open Interest and Option Chain Analysis are powerful tools when used correctly. They offer traders a real-time look at market sentiment, help identify key levels, and give clues about institutional activity. However, they should not be used in isolation. Combine them with price action, volume, and technical analysis for the best results.
Whether you're an intraday trader, swing trader, or options strategist, mastering the art of reading the option chain and open interest will give you a strong edge in today's fast-moving markets.
Advance Institutions Option Trading - Lecture 3Options trading might feel like gambling on a single trade, but informed decisions make it fundamentally different. Reckless trading without a plan can resemble gambling but is not the proper way to trade. With discipline and skill, options trading stands apart from luck-based activities.
Options involve risk and are not suitable for all investors. Certain requirements must be met to trade options. Before engaging in the purchase or sale of options, investors should understand the nature of and extent of their rights and obligations and be aware of the risks involved in investing with options.

DOGS/USDT: BUY ZONE ACTIVATED! 60-70% PROFIT POTENTIAL!!Hey everyone!
If you're enjoying this analysis, a thumbs up and follow would be greatly appreciated!
DOGS looks promising right now, breaking out from a falling wedge and currently retesting the wedge. I recommend going long here with a tight stop loss and low leverage.
Targets:
$0.00094
$0.00108
$0.00121
$0.00133
Stop Loss: $0.000736
Leverage: 5x
What are your thoughts on DOGS's current price action? Do you see a bullish pattern? Share your analysis in the comments below!
