TATASTEEL 1 Week Time Frame 📌 Current Price Snapshot
Tata Steel is trading around ₹183–₹185 on the NSE.
📊 Weekly Technical Levels (Support & Resistance)
🟢 Resistance Levels (Upside Targets)
These are zones where price may face selling pressure or struggle to break above on a weekly basis:
1. ₹188 – ₹190 — Immediate key resistance, near recent highs/52-week high zone.
2. ₹192 – ₹195 — Next resistance if the stock decisively clears ₹190 on weekly closes.
3. ₹195 + — Higher psychological area and extended targets for bullish continuation.
👉 Bullish trigger: Weekly close above ₹188–₹190 strengthens upside momentum.
🔴 Support Levels (Downside Zones)
These act as buying interest zones if the stock pulls back:
1. ₹181 – ₹182 — Immediate support keeping the uptrend intact.
2. ₹178 – ₹180 — Stronger base zone from recent swing lows & pivot cluster.
3. ₹174 – ₹176 — Deeper support if the key zones above break.
👉 Bearish risk: Weekly close below ₹178 could lead to tests around the ₹172–₹175 zone.
📉 Weekly Trend & Indicators
Long-term trend on weekly appears neutral–bullish with moving averages generally supportive and RSI around neutral–positive.
Market news also shows price recently hitting or near 52-week highs, indicating strong sector interest.
📌 How to Use These Levels on Weekly Timeframe
Bullish Scenario
Stay above ₹181–₹182 on weekly close → strengthens chance towards ₹188–₹190 resistance.
Above ₹190 weekly → next targets ₹192–₹195 and beyond.
Neutral/Range Scenario
Trading between ₹178–₹188 → range-bound movement likely; buy near support, sell near resistance.
Bearish Scenario
Weekly close below ₹178 → risk testing lower supports ₹174–₹176 / ₹172–₹175 area.
Course

PCR Trading Strategies How to Trade Options
Many brokers today allow access to options trading for qualified customers. If you want access to options trading, you will have to be approved for both margin and options with your broker.
Once approved, there are four basic things you can do with options:
Buy (long) calls
Sell (short) calls
Buy (long) puts
Sell (short) puts

Part 1 Ride The Big Moves What Are Options?
Options are financial derivatives—meaning their value is derived from an underlying asset such as stock, index, commodity, etc. They are contracts between two parties: the option buyer and the option seller (writer).
There are two types of options:
Call Option (CE) – Right to buy the asset at a fixed price.
Put Option (PE) – Right to sell the asset at a fixed price.
The key point:
The buyer has a right but no obligation. The seller has an obligation but no rights.

Part 1 Support and Resistance Options Trading vs. Stock Trading
Compared to stock trading, options trading offers:
Lower capital requirement
More strategic flexibility
Ability to profit in rising, falling, or sideways markets
However, it also demands deeper knowledge, discipline, and continuous monitoring.

Part 12 Trading Master Class With Experts Types of Options
Options are mainly divided into two categories:
Call Options
A call option gives the buyer the right to buy the underlying asset at a specified price (strike price) before or on the expiration date.
Example: Suppose a stock trades at ₹1,000, and you buy a call option with a strike price of ₹1,050, expiring in one month. If the stock rises to ₹1,100, you can buy it at ₹1,050 and profit from the difference, minus the premium paid.
Put Options
A put option gives the buyer the right to sell the underlying asset at a specified price before or on the expiration date.
Example: Suppose a stock trades at ₹1,000, and you buy a put option with a strike price of ₹950. If the stock drops to ₹900, you can sell it at ₹950 and profit, minus the premium paid.

Choosing Banks Wisely for Success in the Trading MarketImportance of Banks in the Trading Market
Banking stocks attract traders because of their high liquidity, strong institutional participation, and regular price movements. Stocks like HDFC Bank, ICICI Bank, SBI, Axis Bank, and Kotak Mahindra Bank often show clear trends and good volumes, making them suitable for intraday, swing, and positional trading. Since banks are directly influenced by interest rates, inflation, government policies, and economic growth, they tend to react quickly to news and macroeconomic data. This responsiveness creates frequent trading opportunities but also demands careful selection.
Understanding the Business Model of Banks
Before trading a bank stock, it is important to understand its business model. Some banks are retail-focused, others are corporate-lending heavy, while a few specialize in niche segments such as MSMEs or digital banking. Retail-focused banks generally have stable earnings and lower risk, which often results in smoother price trends. Corporate-heavy banks may offer higher returns during economic booms but can be volatile during slowdowns due to stressed assets. Traders who understand these differences can align their strategy with the risk profile of the bank they choose.
Asset Quality and Risk Management
Asset quality is one of the most critical factors when selecting banks for trading. Indicators such as Gross NPA (Non-Performing Assets), Net NPA, and provision coverage ratio reflect the bank’s ability to manage credit risk. Banks with improving or stable asset quality are preferred by institutional investors, leading to stronger price support and reliable trends. Sudden deterioration in asset quality often triggers sharp sell-offs, which can be risky for traders without proper stop-losses.
Capital Adequacy and Financial Strength
Capital adequacy ratio (CAR) shows how well a bank is capitalized to absorb potential losses. Well-capitalized banks inspire confidence among investors and traders, especially during uncertain market conditions. Banks with strong capital buffers tend to recover faster after market corrections, making them better candidates for positional and swing trading. Weakly capitalized banks may show erratic movements and are more vulnerable to negative news.
Impact of Interest Rates and RBI Policies
Interest rates and Reserve Bank of India (RBI) policies have a direct impact on banking stocks. Changes in repo rates, CRR, SLR, and liquidity measures influence banks’ margins and profitability. Traders should track RBI monetary policy announcements closely when trading bank stocks. Banks that manage interest rate cycles efficiently often outperform peers, offering better trading opportunities during both bullish and bearish phases.
Public Sector vs Private Sector Banks
Choosing between public sector banks (PSUs) and private sector banks is another important consideration. Private banks generally have better asset quality, advanced technology, and efficient management, leading to more consistent price movements. PSU banks, on the other hand, are more sensitive to government policies, recapitalization news, and reforms. While PSU banks can deliver sharp rallies, they also carry higher risk. Traders should select based on their risk appetite and market conditions.
Role of Technical Analysis in Bank Selection
Technical analysis plays a crucial role in choosing banks for trading. Banks with clear chart patterns, strong support and resistance levels, and high trading volumes are more suitable for traders. Indicators such as moving averages, RSI, MACD, and VWAP help identify trends and entry-exit points. A fundamentally strong bank showing technical confirmation provides a higher probability trade compared to a weak bank with random price movements.
Liquidity and Volatility Considerations
Liquidity is essential for trading, especially for intraday traders. Highly liquid bank stocks allow easy entry and exit without significant slippage. Volatility is also important, as it determines profit potential. The best bank stocks for trading offer a balance—enough volatility to generate profits but not so much that price movements become unpredictable. Overly volatile banks can lead to emotional decision-making and losses.
News, Results, and Event Sensitivity
Bank stocks are highly sensitive to quarterly results, credit growth data, mergers, regulatory actions, and management commentary. Traders should be aware of upcoming events and avoid taking large positions without a clear plan. Positive surprises in earnings or guidance can lead to strong breakouts, while negative news can break key support levels. Wise traders factor event risk into their bank selection process.
Long-Term Trends and Market Leadership
Banks that consistently outperform the market often become leaders during bull phases. Trading such leaders increases the probability of success, as they attract continuous institutional interest. Observing relative strength compared to the index helps traders identify which bank stocks are likely to sustain trends. Avoiding laggards and focusing on leaders is a key principle of wise bank selection.
Risk Management and Position Sizing
Even the best bank stock can move against expectations. Therefore, risk management is non-negotiable. Traders should define stop-loss levels, position size according to capital, and avoid overexposure to a single stock or event. Wise selection combined with disciplined risk management helps protect capital and ensures longevity in the trading market.
Conclusion
Choosing banks wisely for the trading market is a combination of understanding fundamentals, tracking macroeconomic factors, applying technical analysis, and managing risk effectively. Banks are powerful trading instruments, but they demand respect due to their sensitivity to economic and policy changes. Traders who focus on financially strong, well-managed, and technically sound banks increase their chances of consistent profits. In the long run, success in trading bank stocks does not come from frequent trades, but from informed selection, patience, and disciplined execution.

The Resurgence of India’s Public Sector Banking PowerHistorical Challenges Faced by PSU Banks
For a long time, PSU banks struggled under the weight of stressed assets, particularly after the corporate lending boom of the mid-2000s. Aggressive lending to infrastructure, power, steel, and telecom sectors, combined with economic slowdowns and policy bottlenecks, led to a sharp rise in NPAs. Weak credit appraisal systems, governance challenges, and limited autonomy further constrained performance. As a result, profitability declined, capital adequacy weakened, and market valuations remained subdued compared to private sector banks.
Government-Led Reforms and Recapitalization
A major catalyst behind the rise of PSU banks has been decisive government intervention. Large-scale recapitalization programs injected much-needed capital into banks, strengthening their balance sheets and enabling them to meet regulatory requirements. The government also initiated governance reforms, including improved board oversight, professional management practices, and performance-linked accountability. These steps restored stability and provided PSU banks with the confidence to resume lending activity.
Resolution of NPAs and Improved Asset Quality
One of the most significant contributors to the revival of PSU banks is the sharp improvement in asset quality. The introduction of the Insolvency and Bankruptcy Code (IBC) created a structured mechanism for resolving stressed assets. Through recoveries, write-offs, and better provisioning practices, gross and net NPAs declined substantially across major PSU banks. Improved asset quality reduced credit costs, directly boosting profitability and strengthening investor sentiment.
Robust Credit Growth and Economic Recovery
India’s economic recovery and sustained growth momentum have provided a favorable backdrop for PSU banks. Rising demand for credit from infrastructure, manufacturing, MSMEs, agriculture, and retail segments has supported healthy loan growth. Government-led capital expenditure on roads, railways, defense, and renewable energy has especially benefited PSU banks, given their strong presence in project financing and public sector lending. This renewed credit cycle has translated into higher interest income and better utilization of capital.
Digital Transformation and Operational Efficiency
PSU banks have made significant strides in digital transformation, narrowing the gap with private sector peers. Investments in core banking systems, digital payment platforms, mobile banking apps, and fintech partnerships have improved customer experience and operational efficiency. Automation and data analytics have enhanced risk management and credit monitoring, reducing the likelihood of future asset quality stress. These technological upgrades have helped PSU banks remain competitive in an increasingly digital financial ecosystem.
Improved Profitability and Financial Metrics
As asset quality improved and credit growth picked up, PSU banks began reporting strong financial results. Many leading PSU banks have posted record profits, supported by lower provisioning requirements, stable net interest margins, and improved cost management. Capital adequacy ratios have strengthened, return on assets has improved, and balance sheets appear more resilient. This financial turnaround has been a key driver behind the rising stock market performance of PSU bank shares.
Investor Confidence and Market Re-Rating
The improved fundamentals of PSU banks have not gone unnoticed by investors. After years of underperformance, PSU bank stocks have seen significant re-rating in the equity markets. Domestic institutional investors and retail participants have shown renewed interest, attracted by improving earnings visibility, reasonable valuations, and strong dividend potential. The rising performance of PSU banks has also contributed positively to broader banking and financial sector indices.
Strategic Role in Financial Inclusion and Social Objectives
Beyond profitability, PSU banks continue to play a vital role in financial inclusion and social development. They are instrumental in implementing government schemes such as Jan Dhan Yojana, Direct Benefit Transfers (DBT), Mudra loans, and agricultural credit programs. Their extensive branch network in rural and semi-urban areas enables them to support inclusive growth while simultaneously expanding their customer base. This dual role of commercial performance and social responsibility strengthens their long-term relevance.
Challenges That Remain
Despite the impressive rise, PSU banks still face challenges. Competition from agile private banks and fintechs remains intense. Maintaining asset quality during rapid credit expansion requires disciplined risk management. Governance reforms must be sustained to ensure autonomy, transparency, and accountability. Additionally, global economic uncertainties, interest rate volatility, and sector-specific stress could test the resilience of PSU banks in the future.
Outlook: A Sustainable Revival
The rise of PSU banks marks a structural shift rather than a short-term recovery. With cleaner balance sheets, stronger capital positions, improved governance, and supportive macroeconomic conditions, PSU banks are well-positioned to sustain growth. Their role in financing India’s infrastructure push, supporting MSMEs, and expanding financial inclusion will remain crucial in the coming years. If reforms continue and risk management remains prudent, PSU banks are likely to emerge as stable, profitable, and trusted institutions in India’s financial landscape.
Conclusion
The resurgence of PSU banks represents one of the most significant success stories in India’s financial sector in recent times. From grappling with severe stress to delivering strong financial performance, PSU banks have demonstrated resilience and adaptability. Their rising trajectory reflects the combined impact of policy reforms, economic recovery, and internal transformation. As they continue to evolve, PSU banks are set to play a central role in shaping India’s growth story, reinforcing confidence in the public sector banking system, and contributing to long-term economic stability.

Part 1 Technical Analysis VS. Institutional Option Trading Types of Options by Moneyness
In the Money (ITM)
At the Money (ATM)
Out of the Money (OTM)
Deep ITM
Deep OTM
OTM options are cheap but risky.
ATM options are expensive but stable.
ITM options are ideal for directional trading.

Part 10 Trade Like Institutions Open Interest (OI) – The Most Important Tool
OI reveals:
Where option writers (big money) are active
Market expectations
Support and resistance zones
CE OI Buildup
Resistance zone
Option sellers expect market to stay below these strikes.
PE OI Buildup
Support zone
Sellers expect market to stay above these strikes.
OI Shift
When PE writers exit and CE writers build → Trend reversal.

Part 9 Trading Master Class With Experts How Institutions Trade Options
Institutions focus on:
Selling premium (because they have capital)
Hedged positions
Large OI levels
Neutral strategies like condors and spreads
Market-making
Risk-neutral trades using delta-neutral strategies
Retail traders tend to chase:
Lottery OTM options
Low probability trades
News-based speculation
Institutions focus on consistency.

Sub-Brokers in the Indian Stock MarketRole, Structure, Opportunities, and Challenges
The Indian stock market is one of the fastest-growing financial markets in the world, supported by a wide network of intermediaries who connect investors with stock exchanges. Among these intermediaries, sub-brokers play a crucial role. They act as an important bridge between registered stockbrokers and retail investors, especially in semi-urban and rural regions of India. Understanding sub-brokers is essential for anyone looking to participate in the Indian securities market, either as an investor or as a market intermediary.
Meaning of Sub-Brokers in India
A sub-broker is an individual or entity that acts on behalf of a registered stockbroker to assist investors in trading securities. Sub-brokers do not have direct membership with stock exchanges such as NSE (National Stock Exchange) or BSE (Bombay Stock Exchange). Instead, they operate under a main broker (also called a trading member) and help clients open trading and demat accounts, place trades, and understand market products.
Sub-brokers are registered with SEBI (Securities and Exchange Board of India) and must comply with its regulations. Their primary role is client acquisition and servicing, while the execution of trades and clearing is handled by the main broker.
Regulatory Framework and Registration
SEBI governs the functioning of sub-brokers in India to ensure transparency, investor protection, and ethical conduct. To become a sub-broker, an individual or firm must:
Register with SEBI through a registered stockbroker
Fulfill eligibility criteria such as educational qualifications and certification (e.g., NISM certification)
Pay the prescribed registration fees
Comply with SEBI’s code of conduct
Sub-brokers must also adhere to KYC (Know Your Customer) norms, anti-money laundering guidelines, and regular compliance reporting. In recent years, SEBI has streamlined and modernized regulations, encouraging digital onboarding and higher accountability.
Role and Functions of Sub-Brokers
Sub-brokers perform multiple functions in the Indian market ecosystem:
Client Acquisition
One of the most important roles of a sub-broker is to bring new investors into the stock market. They leverage personal relationships, local presence, and trust to onboard clients who may not be comfortable dealing directly with large brokerage firms.
Investor Education and Guidance
Sub-brokers educate clients about equity, derivatives, mutual funds, commodities, and other financial instruments. They help investors understand market risks, trading strategies, and regulatory requirements.
Account Opening and Documentation
They assist clients in opening trading and demat accounts, completing KYC formalities, and linking bank accounts.
Order Placement and Trade Support
Sub-brokers help clients place buy and sell orders through the broker’s trading platform and provide support during market hours.
Relationship Management
Personalized service is a key strength of sub-brokers. They maintain long-term relationships with clients, offering customized solutions and timely support.
Types of Sub-Brokers in India
Sub-brokers in India can be broadly classified into different categories:
Individual Sub-Brokers: Independent professionals operating in a specific locality
Franchise Sub-Brokers: Operating under a brokerage brand with office infrastructure
Remisiers: Focus mainly on client referrals and earn commission without handling operations
Digital Partners: Sub-brokers associated with online or discount brokers, focusing on digital client acquisition
Each type differs in terms of responsibilities, revenue sharing, and operational involvement.
Revenue Model and Earnings
Sub-brokers earn income through commission sharing with the main broker. The revenue depends on:
Trading volume generated by clients
Brokerage structure (percentage-based or flat fee)
Number of active clients
Product mix (equity, derivatives, commodities, mutual funds)
Typically, sub-brokers receive 40% to 70% of the brokerage generated by their clients. Those with a strong client base and high trading volumes can earn substantial and recurring income. However, earnings are not fixed and depend heavily on market activity.
Importance of Sub-Brokers in the Indian Market
Sub-brokers have been instrumental in expanding the reach of the Indian stock market. Their importance includes:
Financial Inclusion: Bringing first-time investors into the market
Regional Penetration: Serving small towns and rural areas
Trust-Based Relationships: Offering comfort to investors unfamiliar with online trading
Market Awareness: Promoting financial literacy and investment culture
Even with the rise of discount brokers and online platforms, sub-brokers remain relevant due to their personalized approach.
Impact of Technology and Changing Market Structure
Technology has significantly transformed the role of sub-brokers. Online trading platforms, mobile apps, and digital KYC have reduced manual processes. Modern sub-brokers now focus more on advisory, education, and relationship management rather than just order placement.
At the same time, the growth of discount brokers has increased competition, putting pressure on traditional commission-based models. Sub-brokers who adapt by offering value-added services such as portfolio guidance, research insights, and financial planning are better positioned for long-term success.
Challenges Faced by Sub-Brokers
Despite their importance, sub-brokers face several challenges:
Regulatory Compliance: Increasing compliance requirements demand time and resources
Margin Pressure: Lower brokerage rates reduce earnings
Technological Adaptation: Need to stay updated with digital platforms
Market Volatility: Income fluctuates with market conditions
Client Expectations: Investors expect faster service and expert-level guidance
To survive and grow, sub-brokers must continuously upgrade skills and services.
Future of Sub-Brokers in India
The future of sub-brokers in India is evolving rather than disappearing. While pure execution-based roles may decline, advisory-driven and relationship-focused sub-brokers will remain in demand. SEBI’s emphasis on investor protection and transparency will further professionalize the sub-broker ecosystem.
Sub-brokers who embrace technology, diversify product offerings, and focus on long-term client value will continue to play a significant role in India’s capital markets.
Conclusion
Sub-brokers are a vital part of the Indian stock market structure. They act as trusted intermediaries, educators, and facilitators for millions of investors. Despite facing regulatory and competitive challenges, sub-brokers continue to contribute to market growth and financial inclusion. As the Indian market matures, the role of sub-brokers will shift from simple intermediaries to comprehensive financial partners, ensuring their relevance in the years to come.

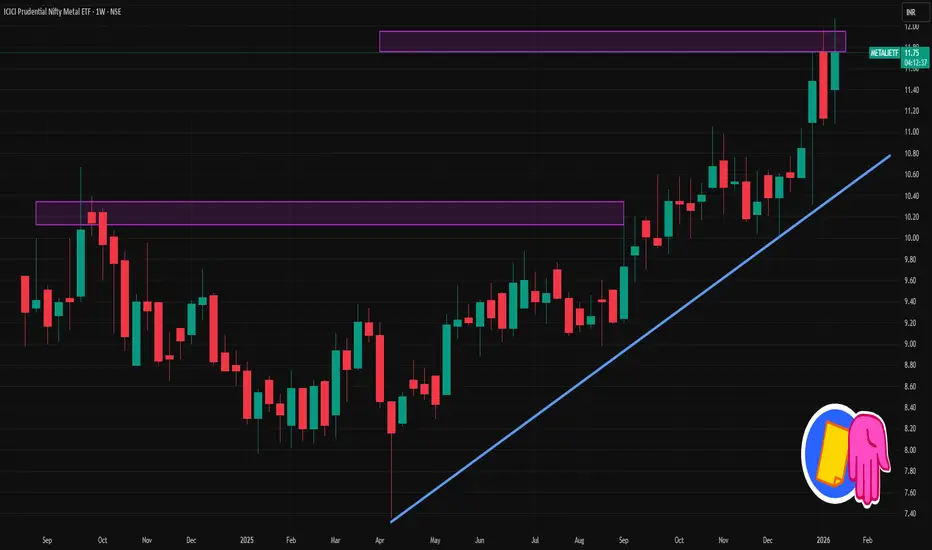
METALIETF 1 Week Time Frame 📊 Current Context (Latest Price)
• The ETF is trading around ₹11.6–₹11.8 (mid‑Jan 2026 data).
📈 Weekly Technical Levels (Pivot‑Based Support / Resistance)
From the weekly pivot point analysis:
Weekly Pivot Point (Center): ~ ₹11.38
This is a key level — above it suggests bullish bias on weekly charts.
Weekly Resistance Levels:
R1: ~ ₹11.71 — first upside target/resistance
R2: ~ ₹12.28 — secondary resistance zone
R3: ~ ₹12.61 — further supply zone if momentum continues
Weekly Support Levels:
S1: ~ ₹11.05 — initial support on pullbacks
S2: ~ ₹10.81 — next support below
S3: ~ ₹10.48 — deeper weekly support
Central Pivot Range (CPR):
Top CPR ~ 11.51
Bottom CPR ~ 11.26
This band often acts as a weekly equilibrium zone — trading above it keeps bulls in control.
📌 Summary – Weekly Key Levels
Level Type Price (₹)
Weekly Resistance 3 (R3) ~11.52
Weekly Resistance 2 (R2) ~11.28
Weekly Resistance 1 (R1) ~11.06
Weekly Pivot ~10.82
Weekly Support 1 (S1) ~10.60
Weekly Support 2 (S2) ~10.36
Weekly Support 3 (S3) ~10.14
HINDZINC 1 Week Time Frame 📌 Current Context (mid‑Jan 2026)
• The stock is trading around ~₹640‑₹654 on NSE.
📊 1‑Week Key Levels (Support & Resistance)
🔄 Weekly Pivot (Standard)
Pivot (weekly baseline): ~₹615‑₹642 (varies slightly by method)
📈 Resistance Levels
R1: ~₹642‑₹677 (immediate weekly resistance)
R2: ~₹677‑₹688 (secondary supply zone)
R3: ~₹704‑₹706+ (higher hurdle)
📉 Support Levels
S1: ~₹579‑₹614 (first weekly support band)
S2: ~₹552‑₹580 (next downside cushion)
S3: ~₹516‑₹553 (deeper support zone)
📉 Weekly Swing Range (Indicative)
Likely weekly range for HINDZINC over next 4–5 sessions:
➡️ Upside: ~₹675‑₹705+ (on strong bullish momentum)
➡️ Downside: ~₹550‑₹580 (if markets soften)
This range assumes standard weekly pivot behavior and typical momentum — actual moves may vary with broader market catalysts like metals index moves or commodity price shifts.

Part 1 Support and Resistance Intraday vs Positional Option Trading
Intraday
Quick profits
Higher volatility
Good for scalping
Needs strict discipline
Positional
Rely on swings
Theta decay risk
Good for spreads

Part 2 Intraday Master ClassTypes of Options
There are two primary types of options:
a) Call Option
A call option gives the buyer the right to buy the underlying asset at the strike price before or at expiry. Traders buy call options when they expect the price of the underlying asset to rise.
Buyer’s risk: Limited to the premium paid
Buyer’s reward: Potentially unlimited
Seller’s risk: Potentially unlimited
b) Put Option
A put option gives the buyer the right to sell the underlying asset at the strike price before or at expiry. Traders buy put options when they expect the price to fall.
Buyer’s risk: Limited to the premium paid
Buyer’s reward: Significant but capped by the price going to zero
Seller’s risk: Substantial

Part 1 Intraday Master Class What Is Option Trading?
An option is a financial derivative contract that gives the buyer the right, but not the obligation, to buy or sell an underlying asset at a predetermined price (called the strike price) on or before a specific date (known as the expiry date). The seller (or writer) of the option, on the other hand, has the obligation to fulfill the contract if the buyer chooses to exercise the option.
Option trading involves buying and selling these contracts in the derivatives market. In India, options are commonly traded on stocks and indices such as NIFTY, BANK NIFTY, and FINNIFTY.

Mastering Emotional Discipline for Long-Term Trading SuccessCan You Control Revenge Trading?
Revenge trading is one of the most common yet destructive behaviors in financial markets. It happens when a trader, after experiencing a loss, immediately tries to “win back” the money by placing impulsive, emotionally driven trades. Instead of following a well-defined strategy, the trader reacts to frustration, anger, fear, or ego. The result is often a spiral of losses that damages not only the trading account but also confidence and mental well-being. The critical question every trader eventually faces is: can you control revenge trading? The answer is yes—but only with awareness, discipline, and structured systems in place.
Understanding Revenge Trading
Revenge trading is rooted in human psychology. When money is lost, the brain interprets it as a threat or injustice, triggering emotional responses similar to anger or anxiety. Traders feel compelled to “fix” the loss quickly, believing that another trade will restore balance. This mindset shifts focus away from probability and risk management toward emotional satisfaction. The market, however, is indifferent to emotions. It does not reward urgency or desperation; it rewards discipline, patience, and consistency.
Revenge trading often shows up in specific patterns: increasing position size after a loss, abandoning stop-loss rules, overtrading in low-quality setups, or trading outside one’s planned timeframe. Many traders recognize these behaviors only after significant damage has been done, which is why controlling revenge trading requires proactive measures rather than reactive regret.
The Cost of Revenge Trading
The financial cost of revenge trading can be severe. One controlled loss can quickly turn into multiple uncontrolled losses, wiping out weeks or months of gains. Beyond money, the psychological cost is equally damaging. Traders may lose confidence in their strategy, begin doubting their skills, or develop anxiety around trading. Over time, this emotional strain can lead to burnout or complete withdrawal from the markets.
Importantly, revenge trading also disrupts learning. Losses are valuable feedback when analyzed objectively, but revenge trading replaces analysis with emotion. Instead of asking “what went wrong?”, the trader asks “how do I get my money back?”—a question that rarely leads to improvement.
Awareness: The First Step to Control
You cannot control what you do not recognize. The first step in controlling revenge trading is self-awareness. Traders must learn to identify their emotional triggers. Common triggers include a sudden large loss, a series of small losses, missing a profitable trade, or seeing others profit while you lose. By journaling trades and emotions, traders can spot patterns between emotional states and poor decisions.
When you notice physical or mental signals—racing heart, frustration, impulsive thoughts, or the urge to place a trade immediately—it is often a warning sign. Awareness creates a pause between emotion and action, and that pause is where control begins.
Building a Rule-Based Trading System
One of the most effective ways to control revenge trading is to rely on a strict, rule-based trading system. Rules remove discretion at moments when emotions are high. These rules should define entry criteria, exit criteria, stop-loss levels, position sizing, and maximum daily loss.
For example, a daily loss limit is a powerful safeguard. If a trader decides in advance that they will stop trading after losing a certain percentage or amount in a day, it prevents emotional spirals. Similarly, fixed position sizing ensures that no single trade—or emotional impulse—can cause catastrophic damage.
The key is commitment. Rules only work if they are followed even when emotions resist them. Many successful traders treat their rules as non-negotiable, similar to safety protocols in aviation or medicine.
Risk Management as Emotional Protection
Risk management is not just about protecting capital; it is about protecting the trader’s psychology. When risk per trade is kept small, losses become easier to accept. A loss that represents 1% of capital feels manageable, while a loss of 10% can trigger panic and revenge behavior.
Proper risk-reward planning also helps. When traders know that one winning trade can cover multiple small losses, they are less likely to feel desperate after a single loss. This probabilistic mindset—understanding that losses are part of the process—reduces emotional attachment to individual trades.
The Power of Taking a Break
Sometimes the best trade is no trade. Stepping away from the screen after a loss can prevent revenge trading entirely. A short break allows emotions to settle and rational thinking to return. Professional traders often schedule mandatory breaks after significant wins or losses, recognizing that emotional extremes—positive or negative—can impair judgment.
Breaks can be structured, such as a rule to stop trading for the day after two consecutive losses, or informal, such as a walk, meditation, or physical exercise. The goal is to reset emotionally before making another decision.
Developing Emotional Discipline
Emotional discipline is a skill that improves with practice. Techniques such as mindfulness, meditation, or breathing exercises can help traders manage stress and remain present. Over time, traders learn to observe emotions without acting on them. This does not mean suppressing emotions, but rather acknowledging them and choosing not to let them dictate actions.
Reframing losses is another powerful tool. Instead of viewing losses as failures, successful traders see them as business expenses or data points. This mindset shift reduces the emotional sting and the urge to retaliate against the market.
Long-Term Perspective and Professional Mindset
Revenge trading thrives on short-term thinking. A long-term perspective weakens its grip. When traders focus on monthly or yearly performance rather than individual trades, losses feel less personal. Professional traders understand that consistency over hundreds of trades matters more than the outcome of any single one.
Adopting a professional mindset also means accepting responsibility. The market is not an enemy to defeat; it is an environment to navigate. Once traders stop blaming the market and start refining their process, emotional reactions naturally decrease.
Conclusion: Yes, You Can Control Revenge Trading
Revenge trading is not a sign of weakness—it is a natural human response to loss. However, allowing it to dictate decisions is a choice. Through awareness, structured rules, disciplined risk management, emotional regulation, and a long-term mindset, traders can control revenge trading and protect both capital and confidence.
Mastering this aspect of trading often marks the transition from a struggling trader to a consistently profitable one. Markets will always test emotions, but those who learn to respond with discipline rather than revenge gain a decisive edge. In the end, controlling revenge trading is less about controlling the market and more about mastering yourself.

F&O Trading (Futures and Options Trading): A Comprehensive GuideUnderstanding F&O Trading
F&O trading is part of the derivatives market, where the value of contracts is derived from an underlying asset. The underlying asset can be stocks, stock indices (like NIFTY or BANK NIFTY), commodities, currencies, or interest rates. Unlike cash market trading, where investors buy or sell actual shares, F&O trading involves contracts that derive their value from price movements of these assets.
The two main instruments in this segment are Futures and Options, each with distinct characteristics and risk profiles.
Futures Trading Explained
A futures contract is a legally binding agreement between two parties to buy or sell an underlying asset at a predetermined price on a specified future date. In futures trading, both the buyer and seller are obligated to fulfill the contract at expiry unless they exit the position earlier.
Futures are widely used by traders to speculate on price direction. If a trader expects the price of a stock or index to rise, they take a long futures position. If they expect a fall, they take a short futures position. One of the defining features of futures trading is leverage, where traders need to pay only a margin (a fraction of the total contract value) to control a large position.
While leverage increases profit potential, it equally amplifies losses. A small unfavorable movement in price can result in significant losses, making risk management critical.
Options Trading Explained
An options contract gives the buyer the right but not the obligation to buy or sell the underlying asset at a specific price (called the strike price) before or on a specific date (expiry). The seller (or writer) of the option, however, has an obligation to fulfill the contract if the buyer exercises the option.
There are two main types of options:
Call Options: Give the right to buy the asset.
Put Options: Give the right to sell the asset.
Options buyers pay a premium, which is the maximum loss they can incur. This limited-risk feature makes options attractive to beginners. On the other hand, option sellers earn the premium but face potentially unlimited risk, especially in naked option selling.
Options trading allows traders to profit not only from price direction but also from factors like time decay (theta), volatility (vega), and price sensitivity (delta).
Key Differences Between Futures and Options
Futures contracts involve obligation for both parties, while options involve a right for the buyer and obligation for the seller. Futures have linear profit and loss, meaning gains and losses move directly with price changes. Options have non-linear payoffs, allowing for complex strategies such as hedging, income generation, and volatility trading.
Why Traders Use F&O Trading
One of the primary reasons for F&O trading is hedging. Investors use futures and options to protect their portfolios from adverse market movements. For example, an investor holding a large equity portfolio may buy index put options to hedge against a market crash.
Another major use is speculation. Traders attempt to profit from short-term price movements using leverage. Since derivatives require lower capital compared to the cash market, traders can take larger positions.
F&O trading also supports arbitrage opportunities, where price differences between the cash and derivatives markets can be exploited for low-risk returns.
Leverage and Margin in F&O Trading
Leverage is both an advantage and a risk in F&O trading. Traders are required to maintain initial margin and maintenance margin with their brokers. If the market moves against their position, they may receive a margin call, requiring them to add funds.
Poor understanding of margin requirements often leads to forced position closures and heavy losses, especially during volatile market conditions.
Risks Involved in F&O Trading
F&O trading carries significant risk, particularly for inexperienced traders. The major risks include:
High volatility risk, leading to sudden losses
Leverage risk, magnifying losses beyond expectations
Time decay, especially harmful for option buyers
Unlimited loss potential for option sellers
Emotional and psychological pressure, leading to poor decision-making
Many retail traders lose money in F&O trading due to overtrading, lack of strategy, and inadequate risk management.
Risk Management in F&O Trading
Successful F&O trading relies heavily on risk management. Traders must define position size, use stop-loss orders, and avoid risking more than a small percentage of capital on a single trade. Hedged strategies, such as spreads and straddles, help limit losses.
Maintaining discipline, following a trading plan, and avoiding revenge trading are equally important.
Role of Strategy in F&O Trading
F&O trading is not about prediction alone but about probability and strategy. Common futures strategies include trend following and breakout trading. Options strategies range from simple ones like buying calls or puts to advanced strategies such as iron condors, butterflies, calendar spreads, and straddles.
The choice of strategy depends on market conditions—whether the market is trending, range-bound, or highly volatile.
Who Should Trade in F&O?
F&O trading is best suited for traders with:
Strong understanding of market mechanics
Ability to handle risk and volatility
Adequate capital and emotional discipline
Knowledge of technical analysis and derivatives pricing
Beginners should start with education, paper trading, and small position sizes before committing significant capital.
Conclusion
F&O trading is a powerful financial tool that offers immense opportunities for profit, hedging, and portfolio optimization. However, it is not a shortcut to quick wealth. The same leverage that amplifies gains can also magnify losses. Success in F&O trading requires deep knowledge, disciplined execution, robust risk management, and continuous learning.
For traders who respect its complexity and approach it with patience and preparation, F&O trading can become a valuable component of long-term market participation. For those who treat it as gambling, it often results in significant financial loss. Understanding the mechanics, risks, and strategies is the first and most crucial step toward sustainable success in the F&O segment.

GIFT NiftyA Strategic Bridge Between the Indian and Global Financial Markets
GIFT Nifty has emerged as one of the most important instruments linking the Indian stock market with global financial markets. It represents India’s growing integration with international capital flows and reflects how global investors perceive Indian equities in real time. With the establishment of GIFT City (Gujarat International Finance Tec-City) as an international financial services hub, GIFT Nifty has replaced the earlier SGX Nifty and has become the primary offshore derivative for tracking and trading the Nifty 50 index outside mainland India. Its relevance has increased significantly for traders, investors, institutions, and policymakers alike.
Understanding What GIFT Nifty Is
GIFT Nifty is a futures contract based on the Nifty 50 index, traded on the NSE International Exchange (NSE IX) located at GIFT City, Gujarat. Unlike the traditional Nifty futures traded on NSE India during Indian market hours, GIFT Nifty trades for extended hours, closely overlapping with global market sessions such as Asia, Europe, and the US. This extended trading window allows global investors to take positions on Indian equities almost round the clock.
In simple terms, GIFT Nifty acts as a price discovery mechanism for the Indian market when domestic exchanges are closed. It reflects how global news, macroeconomic data, geopolitical developments, and overnight cues are likely to influence the Indian stock market when it opens.
Evolution from SGX Nifty to GIFT Nifty
Earlier, SGX Nifty, traded on the Singapore Exchange, was the most popular offshore derivative for tracking Indian markets. However, to bring offshore trading volumes back to India and strengthen GIFT City as a global financial hub, NSE International Exchange launched GIFT Nifty. Gradually, liquidity shifted from SGX Nifty to GIFT Nifty, making it the primary reference point for global investors.
This transition marked a significant milestone for India’s financial ecosystem, as it reduced dependency on foreign exchanges and enhanced India’s control over its own benchmark derivatives.
Role of GIFT Nifty in the Indian Market
For Indian market participants, GIFT Nifty serves as a powerful indicator of how the market is likely to open. Traders closely monitor GIFT Nifty movements early in the morning to gauge opening gaps—whether the market may open higher, lower, or flat.
If GIFT Nifty is trading significantly higher than the previous Nifty close, it suggests a positive opening sentiment driven by global cues. Conversely, if it is trading lower, it signals potential weakness. This makes GIFT Nifty especially valuable for:
Index traders and scalpers planning pre-market strategies
Options traders adjusting volatility and gap-risk assumptions
Institutional desks managing overnight risk
However, it is important to note that GIFT Nifty is an indicator, not a guarantee. Domestic news, RBI announcements, corporate earnings, and pre-market order flows can still alter the actual opening.
Importance in the Global Market Context
From a global perspective, GIFT Nifty allows international investors to gain exposure to India’s growth story without trading directly on Indian exchanges. India is one of the fastest-growing major economies, and global funds actively track Indian indices for allocation decisions.
GIFT Nifty enables:
Hedging of India exposure by global funds
Speculative positioning based on global macro events
Portfolio rebalancing outside Indian trading hours
For example, if US markets react sharply to inflation data, Federal Reserve commentary, or geopolitical tensions, global investors can immediately adjust their India exposure through GIFT Nifty instead of waiting for Indian markets to open.
Impact of Global Macroeconomic Events
GIFT Nifty is highly sensitive to global macroeconomic developments. Events such as US Federal Reserve interest rate decisions, US CPI data, crude oil price movements, dollar index fluctuations, and geopolitical conflicts often first reflect in GIFT Nifty before impacting Indian markets.
This sensitivity makes GIFT Nifty a real-time barometer of global risk sentiment toward India. During periods of risk-off sentiment, GIFT Nifty may trade at a discount, signaling cautious openings. During risk-on phases, strong buying interest can push it higher, indicating optimism.
Liquidity, Participants, and Market Structure
Liquidity in GIFT Nifty has grown steadily, supported by participation from foreign institutional investors, proprietary trading firms, hedge funds, and global banks. The contract structure, margin efficiency, and tax-friendly environment of GIFT City have further encouraged participation.
Trading in US dollar terms also makes it convenient for global players who prefer avoiding currency conversion complexities associated with onshore Indian markets.
Advantages of GIFT Nifty
Some key advantages include:
Extended trading hours aligned with global markets
Efficient price discovery for the Nifty 50
Reduced dependency on foreign exchanges
Strengthening of India’s international financial standing
Better risk management tools for global and domestic investors
Limitations and Risks
Despite its importance, GIFT Nifty is not without limitations. Liquidity, though improving, may still be lower compared to onshore NSE during peak Indian hours. Sudden domestic news can override global cues, leading to divergence between GIFT Nifty and actual market openings.
Additionally, retail Indian investors do not directly trade GIFT Nifty; its influence is indirect through sentiment and price signals.
Future Outlook of GIFT Nifty
As GIFT City continues to develop and attract global financial institutions, GIFT Nifty is expected to gain deeper liquidity and wider acceptance. With India’s increasing weight in global indices and rising foreign participation, GIFT Nifty will likely play an even larger role in shaping pre-market sentiment and global perception of Indian equities.
In the long term, GIFT Nifty symbolizes India’s ambition to be a global financial powerhouse—offering world-class infrastructure, regulatory clarity, and market access.
Conclusion
GIFT Nifty is far more than just an offshore derivative; it is a critical link between the Indian and global financial markets. It reflects global sentiment toward India, aids in efficient price discovery, and helps both domestic and international participants manage risk and opportunity. As India’s economic influence grows, GIFT Nifty will remain a central pillar in connecting Indian markets with the world, shaping how global capital engages with one of the most dynamic economies of the 21st century.

A Timeless Strategy for Protecting Wealth and Managing RiskHedging with Gold:
Gold has occupied a unique position in human civilization for thousands of years. Beyond its aesthetic appeal and cultural significance, gold has long been regarded as a reliable store of value and a powerful financial hedge. In modern investing, “hedging with gold” refers to using gold as a protective asset to reduce portfolio risk, preserve wealth during uncertainty, and counterbalance losses from other asset classes. In an era marked by inflationary pressures, volatile equity markets, currency fluctuations, and geopolitical tensions, gold continues to play a critical role in risk management strategies.
Understanding Hedging and Gold’s Role
Hedging is an investment technique designed to offset potential losses in one asset by holding another asset that is expected to perform well under adverse conditions. Gold fits naturally into this framework because its price behavior often differs from that of stocks, bonds, and currencies. While equities thrive during economic growth, gold tends to perform better during periods of uncertainty, financial stress, or declining confidence in paper assets.
Gold is not dependent on the performance of a company, government, or financial institution. It does not carry credit risk or default risk, making it fundamentally different from stocks and bonds. This independence is what gives gold its hedging power.
Gold as a Hedge Against Inflation
One of the most important reasons investors hedge with gold is inflation protection. Inflation erodes the purchasing power of money, reducing the real value of savings and fixed-income investments. Historically, gold has maintained its value over long periods, even when fiat currencies lose purchasing power.
When inflation rises, central banks often respond with loose monetary policies or delayed interest rate hikes, which can weaken currencies. As currencies depreciate, gold prices—often quoted in those currencies—tend to rise. This makes gold an effective tool for preserving real wealth during inflationary cycles. Investors view gold as “real money” because it cannot be printed or devalued by policy decisions.
Gold as a Safe-Haven Asset
Gold is widely recognized as a safe-haven asset. During periods of financial crises, market crashes, or geopolitical instability, investors often shift capital from risky assets like equities into gold. This flight to safety increases demand for gold and supports its price when other assets are under pressure.
Examples include global financial crises, banking stress, wars, or sudden economic shocks. When confidence in financial systems declines, gold’s tangible and universally accepted nature provides psychological and financial reassurance. This inverse or low correlation with risk assets makes gold an effective hedge during extreme market events.
Currency Risk and Gold Hedging
Gold also acts as a hedge against currency depreciation. Since gold is priced globally and traded in international markets, it is not tied to the fate of any single currency. When domestic currencies weaken due to trade deficits, monetary expansion, or economic instability, gold prices in that currency often rise.
For investors in emerging markets, where currencies may be more volatile, gold offers protection against exchange-rate risk. By holding gold, investors can partially insulate their portfolios from losses caused by currency devaluation.
Portfolio Diversification Benefits
Diversification is a cornerstone of sound investment strategy, and gold plays a crucial role in this process. Gold typically has a low or negative correlation with equities and, at times, with bonds. Including gold in a portfolio can reduce overall volatility and improve risk-adjusted returns.
Even a modest allocation to gold—often between 5% and 15%—can enhance portfolio resilience. During bull markets, gold may underperform equities, but during bear markets, it can help cushion losses. This balancing effect is central to gold’s role as a hedge rather than a high-growth asset.
Gold as a Hedge Against Systemic Risk
Systemic risk refers to the potential collapse of an entire financial system due to interconnected failures. Events such as banking crises, sovereign debt defaults, or extreme leverage in financial markets can trigger systemic shocks. Gold, being outside the traditional financial system, provides protection in such scenarios.
Unlike bank deposits or financial securities, physical gold does not rely on intermediaries. This makes it particularly attractive during times of financial stress when trust in institutions is weakened. Even gold-backed financial instruments benefit from this perception of stability.
Ways to Hedge with Gold
Investors can hedge with gold through various instruments, each with its own characteristics:
Physical Gold: Coins, bars, and jewelry provide direct ownership and eliminate counterparty risk, though they involve storage and insurance costs.
Gold ETFs and Mutual Funds: These offer liquidity and ease of trading while tracking gold prices.
Gold Mining Stocks: These provide leveraged exposure to gold prices but also carry company-specific and market risks.
Gold Futures and Options: Used mainly by sophisticated investors for short-term hedging and tactical strategies.
The choice depends on investment goals, risk tolerance, time horizon, and accessibility.
Limitations of Gold as a Hedge
While gold is a powerful hedging tool, it is not without limitations. Gold does not generate income like dividends or interest, making it less attractive during stable, high-growth periods. Its price can also be volatile in the short term, influenced by interest rates, currency movements, and speculative flows.
Additionally, gold should not be viewed as a complete replacement for productive assets. Over-allocation can reduce long-term growth potential. Effective hedging with gold requires balance, discipline, and a clear understanding of its role within a diversified portfolio.
Strategic Use of Gold in Modern Portfolios
In today’s complex economic environment, gold remains highly relevant. Rising global debt levels, recurring inflation concerns, monetary policy uncertainty, and geopolitical risks reinforce the need for defensive assets. Gold serves as insurance rather than a speculative bet—its value lies in protection, not rapid appreciation.
Investors who use gold strategically, rather than emotionally, benefit the most. Periodic rebalancing, long-term perspective, and alignment with broader financial goals are essential for effective gold hedging.
Conclusion
Hedging with gold is a time-tested strategy rooted in gold’s unique properties as a store of value, safe haven, and diversification tool. While it may not always deliver high returns, its true strength lies in preserving wealth and stabilizing portfolios during periods of uncertainty. In a world of shifting economic cycles and unpredictable risks, gold continues to shine as a reliable hedge—quietly protecting capital when it is needed most.

SMSPHARMA 1 Day View 📊 Latest Price Context (Indicative)
The stock has recently been trading around ₹340-₹345 on the NSE/BSE.
📈 1-Day Time Frame Levels
🔹 Immediate Resistance Zones
These are levels where supply may increase and price may struggle to rise further:
1. R1: ~₹350–₹351 – First resistance area (short-term pivot zone from intraday studies).
2. R2: ~₹355–₹360 – Next resistance zone based on pivot/EMA clusters.
3. R3: ~₹362–₹365+ – Upper resistance target zone.
🔻 Immediate Support Zone
These are buyers’ areas that may help contain a sell-off on the daily chart:
1. S1: ~₹338–₹339 – Near-term support (intraday pivot support).
2. S2: ~₹331–₹332 – Next support zone (short-term EMA/SMA confluence).
3. S3: ~₹325–₹327 – Stronger support below current price.
📌 Technical Indicators (Daily Box)
Trend & Momentum:
Daily moving averages (20/50/100/200) are generally bullish/bias positive.
RSI on some sources shows moderately bullish / near-neutral conditions, not deeply overbought.
Other oscillators (like MACD, CCI) on alternative platforms vary but can be neutral to bullish on daily context.
Overall, the short-term bias around the daily timeframe is bullish to neutral as long as support levels hold.
⚠️ Important
These levels are indicative and based on technical sources, not real-time live quotes or market orders. Always verify with your trading platform’s live charts (e.g., NSE/BSE live data) before placing trades. This is not financial advice—consider risk management and your own analysis.

Global Market Impact on the Indian MarketInterconnections, Influences, and Future Outlook
The Indian financial market does not operate in isolation. In today’s highly interconnected global economy, movements in international markets significantly influence India’s equity, debt, currency, and commodity markets. Global economic trends, monetary policies of major economies, geopolitical developments, capital flows, and technological shifts all play a crucial role in shaping the direction, volatility, and sentiment of Indian markets. Understanding how global markets impact the Indian market is essential for investors, policymakers, businesses, and traders to make informed decisions and manage risk effectively.
Global Economic Growth and Its Influence on India
Global economic growth directly affects India’s market performance. When major economies such as the United States, China, the European Union, and Japan experience strong growth, global trade expands, benefiting Indian exports in sectors like information technology, pharmaceuticals, engineering goods, textiles, and chemicals. Increased global demand leads to higher revenues and profitability for Indian companies, boosting stock market valuations.
Conversely, a slowdown or recession in global economies negatively impacts Indian markets. Reduced export demand, supply chain disruptions, and lower foreign investments can pressure corporate earnings and investor confidence. For example, global recessions often result in sharp corrections in Indian equity markets as foreign investors turn risk-averse and reduce exposure to emerging markets like India.
Impact of Global Monetary Policies
One of the most powerful global influences on the Indian market is the monetary policy of major central banks, especially the US Federal Reserve. Changes in interest rates in developed economies directly affect global liquidity. When the Federal Reserve raises interest rates, capital tends to flow back to the US in search of higher and safer returns. This often leads to foreign institutional investors (FIIs) withdrawing funds from Indian equities and bonds, causing market volatility, stock price corrections, and pressure on the Indian rupee.
On the other hand, accommodative global monetary policies, such as low interest rates and quantitative easing, increase liquidity in the global financial system. Excess liquidity often flows into emerging markets, including India, supporting equity rallies, bond inflows, and currency stability. Thus, global interest rate cycles have a profound impact on India’s financial markets.
Foreign Institutional Investment (FII) Flows
Foreign institutional investors play a crucial role in the Indian market, and their investment decisions are largely influenced by global market conditions. Risk-on environments—characterized by stable global growth, low inflation, and accommodative policies—encourage FIIs to invest in India due to its growth potential. This leads to rising stock prices, higher trading volumes, and improved market sentiment.
In contrast, during periods of global uncertainty such as financial crises, geopolitical conflicts, or sharp inflation spikes, FIIs often reduce exposure to emerging markets. Large FII outflows can lead to sharp declines in benchmark indices like the Sensex and Nifty, increased volatility, and sector-specific sell-offs, particularly in banking, IT, and large-cap stocks.
Currency Movements and Global Factors
The Indian rupee is highly sensitive to global developments. Strengthening of the US dollar, driven by higher US interest rates or global risk aversion, usually leads to depreciation of the rupee. A weaker rupee increases import costs, especially for crude oil, fertilizers, and electronic goods, which can worsen inflation and affect corporate margins.
However, a depreciating rupee can benefit export-oriented sectors such as IT services, pharmaceuticals, and textiles, as their revenues in foreign currencies translate into higher rupee earnings. Therefore, global currency trends have a mixed but significant impact on different segments of the Indian market.
Global Commodity Prices and Indian Markets
India is a major importer of commodities, particularly crude oil. Global commodity price movements strongly influence India’s inflation, fiscal balance, and corporate profitability. Rising crude oil prices increase input costs for industries, raise transportation expenses, and put pressure on government finances through higher subsidies. This often leads to negative sentiment in equity markets and concerns over inflation and interest rates.
Similarly, global prices of metals like steel, aluminum, copper, and precious metals affect Indian metal companies, infrastructure projects, and manufacturing sectors. A surge in global commodity prices can boost earnings for commodity producers but may hurt downstream industries and consumers.
Geopolitical Events and Global Risks
Geopolitical developments such as wars, trade conflicts, sanctions, and political instability can trigger global market volatility, which spills over into Indian markets. Events like conflicts in oil-producing regions, tensions between major economies, or disruptions in global trade routes increase uncertainty and risk aversion among investors.
During such periods, Indian markets often witness increased volatility, defensive sector rotation, and flight to safety toward gold and government bonds. Geopolitical risks also affect India’s trade relations, energy security, and foreign investment outlook.
Global Equity Market Trends and Correlation
Indian equity markets often show correlation with major global indices such as the S&P 500, Nasdaq, Dow Jones, and Asian markets. Sharp corrections or rallies in global markets can influence opening sentiment and intraday movements in Indian indices. While India has strong domestic growth drivers, global cues still play a critical role in short-term market direction.
However, over the long term, India’s market performance is increasingly driven by domestic factors such as consumption growth, infrastructure development, demographic advantages, and policy reforms. This gradual decoupling highlights India’s growing economic resilience, even as global influences remain relevant.
Technology, Global Capital, and Structural Shifts
Global technological advancements and capital flows are reshaping Indian markets. Increased participation of global investors through ETFs, index funds, and digital platforms has integrated India more deeply into global financial systems. Global trends such as digitization, renewable energy, artificial intelligence, and electric mobility influence sectoral investments in India.
India’s inclusion in global indices and its rising weight in emerging market portfolios also amplify the impact of global rebalancing decisions on Indian markets.
Conclusion: Balancing Global Influence and Domestic Strength
The global market’s impact on the Indian market is deep and multifaceted. Global economic growth, monetary policies, capital flows, currency movements, commodity prices, and geopolitical events collectively shape India’s market dynamics. While these global factors often drive short-term volatility and sentiment, India’s long-term market trajectory is increasingly supported by strong domestic fundamentals.
For investors and market participants, understanding global influences alongside India-specific factors is essential for effective risk management and strategic asset allocation. As India continues to integrate with the global economy while strengthening its domestic growth engines, the interplay between global markets and the Indian market will remain a defining feature of its financial landscape.

Part 9 Trading Master Class with Experts Risk and Reward in Options
Options trading can be profitable, but risk management is crucial:
Maximum Loss for Buyers: Limited to the premium paid.
Maximum Gain for Buyers: Unlimited for calls, limited for puts.
Maximum Loss for Sellers: Unlimited for uncovered (naked) calls, substantial for puts.
Maximum Gain for Sellers: Limited to the premium received.
Key Considerations:
Time decay (theta) erodes the value of options as expiration approaches.
Volatility changes (vega) affect pricing and profits.
Market direction (delta) determines sensitivity to underlying price changes.
