Part 1 Technical Analysis VS. Institutional Option Trading Types of Options by Moneyness
In the Money (ITM)
At the Money (ATM)
Out of the Money (OTM)
Deep ITM
Deep OTM
OTM options are cheap but risky.
ATM options are expensive but stable.
ITM options are ideal for directional trading.
Course

Part 10 Trade Like Institutions Open Interest (OI) – The Most Important Tool
OI reveals:
Where option writers (big money) are active
Market expectations
Support and resistance zones
CE OI Buildup
Resistance zone
Option sellers expect market to stay below these strikes.
PE OI Buildup
Support zone
Sellers expect market to stay above these strikes.
OI Shift
When PE writers exit and CE writers build → Trend reversal.

Part 9 Trading Master Class With Experts How Institutions Trade Options
Institutions focus on:
Selling premium (because they have capital)
Hedged positions
Large OI levels
Neutral strategies like condors and spreads
Market-making
Risk-neutral trades using delta-neutral strategies
Retail traders tend to chase:
Lottery OTM options
Low probability trades
News-based speculation
Institutions focus on consistency.

Sub-Brokers in the Indian Stock MarketRole, Structure, Opportunities, and Challenges
The Indian stock market is one of the fastest-growing financial markets in the world, supported by a wide network of intermediaries who connect investors with stock exchanges. Among these intermediaries, sub-brokers play a crucial role. They act as an important bridge between registered stockbrokers and retail investors, especially in semi-urban and rural regions of India. Understanding sub-brokers is essential for anyone looking to participate in the Indian securities market, either as an investor or as a market intermediary.
Meaning of Sub-Brokers in India
A sub-broker is an individual or entity that acts on behalf of a registered stockbroker to assist investors in trading securities. Sub-brokers do not have direct membership with stock exchanges such as NSE (National Stock Exchange) or BSE (Bombay Stock Exchange). Instead, they operate under a main broker (also called a trading member) and help clients open trading and demat accounts, place trades, and understand market products.
Sub-brokers are registered with SEBI (Securities and Exchange Board of India) and must comply with its regulations. Their primary role is client acquisition and servicing, while the execution of trades and clearing is handled by the main broker.
Regulatory Framework and Registration
SEBI governs the functioning of sub-brokers in India to ensure transparency, investor protection, and ethical conduct. To become a sub-broker, an individual or firm must:
Register with SEBI through a registered stockbroker
Fulfill eligibility criteria such as educational qualifications and certification (e.g., NISM certification)
Pay the prescribed registration fees
Comply with SEBI’s code of conduct
Sub-brokers must also adhere to KYC (Know Your Customer) norms, anti-money laundering guidelines, and regular compliance reporting. In recent years, SEBI has streamlined and modernized regulations, encouraging digital onboarding and higher accountability.
Role and Functions of Sub-Brokers
Sub-brokers perform multiple functions in the Indian market ecosystem:
Client Acquisition
One of the most important roles of a sub-broker is to bring new investors into the stock market. They leverage personal relationships, local presence, and trust to onboard clients who may not be comfortable dealing directly with large brokerage firms.
Investor Education and Guidance
Sub-brokers educate clients about equity, derivatives, mutual funds, commodities, and other financial instruments. They help investors understand market risks, trading strategies, and regulatory requirements.
Account Opening and Documentation
They assist clients in opening trading and demat accounts, completing KYC formalities, and linking bank accounts.
Order Placement and Trade Support
Sub-brokers help clients place buy and sell orders through the broker’s trading platform and provide support during market hours.
Relationship Management
Personalized service is a key strength of sub-brokers. They maintain long-term relationships with clients, offering customized solutions and timely support.
Types of Sub-Brokers in India
Sub-brokers in India can be broadly classified into different categories:
Individual Sub-Brokers: Independent professionals operating in a specific locality
Franchise Sub-Brokers: Operating under a brokerage brand with office infrastructure
Remisiers: Focus mainly on client referrals and earn commission without handling operations
Digital Partners: Sub-brokers associated with online or discount brokers, focusing on digital client acquisition
Each type differs in terms of responsibilities, revenue sharing, and operational involvement.
Revenue Model and Earnings
Sub-brokers earn income through commission sharing with the main broker. The revenue depends on:
Trading volume generated by clients
Brokerage structure (percentage-based or flat fee)
Number of active clients
Product mix (equity, derivatives, commodities, mutual funds)
Typically, sub-brokers receive 40% to 70% of the brokerage generated by their clients. Those with a strong client base and high trading volumes can earn substantial and recurring income. However, earnings are not fixed and depend heavily on market activity.
Importance of Sub-Brokers in the Indian Market
Sub-brokers have been instrumental in expanding the reach of the Indian stock market. Their importance includes:
Financial Inclusion: Bringing first-time investors into the market
Regional Penetration: Serving small towns and rural areas
Trust-Based Relationships: Offering comfort to investors unfamiliar with online trading
Market Awareness: Promoting financial literacy and investment culture
Even with the rise of discount brokers and online platforms, sub-brokers remain relevant due to their personalized approach.
Impact of Technology and Changing Market Structure
Technology has significantly transformed the role of sub-brokers. Online trading platforms, mobile apps, and digital KYC have reduced manual processes. Modern sub-brokers now focus more on advisory, education, and relationship management rather than just order placement.
At the same time, the growth of discount brokers has increased competition, putting pressure on traditional commission-based models. Sub-brokers who adapt by offering value-added services such as portfolio guidance, research insights, and financial planning are better positioned for long-term success.
Challenges Faced by Sub-Brokers
Despite their importance, sub-brokers face several challenges:
Regulatory Compliance: Increasing compliance requirements demand time and resources
Margin Pressure: Lower brokerage rates reduce earnings
Technological Adaptation: Need to stay updated with digital platforms
Market Volatility: Income fluctuates with market conditions
Client Expectations: Investors expect faster service and expert-level guidance
To survive and grow, sub-brokers must continuously upgrade skills and services.
Future of Sub-Brokers in India
The future of sub-brokers in India is evolving rather than disappearing. While pure execution-based roles may decline, advisory-driven and relationship-focused sub-brokers will remain in demand. SEBI’s emphasis on investor protection and transparency will further professionalize the sub-broker ecosystem.
Sub-brokers who embrace technology, diversify product offerings, and focus on long-term client value will continue to play a significant role in India’s capital markets.
Conclusion
Sub-brokers are a vital part of the Indian stock market structure. They act as trusted intermediaries, educators, and facilitators for millions of investors. Despite facing regulatory and competitive challenges, sub-brokers continue to contribute to market growth and financial inclusion. As the Indian market matures, the role of sub-brokers will shift from simple intermediaries to comprehensive financial partners, ensuring their relevance in the years to come.

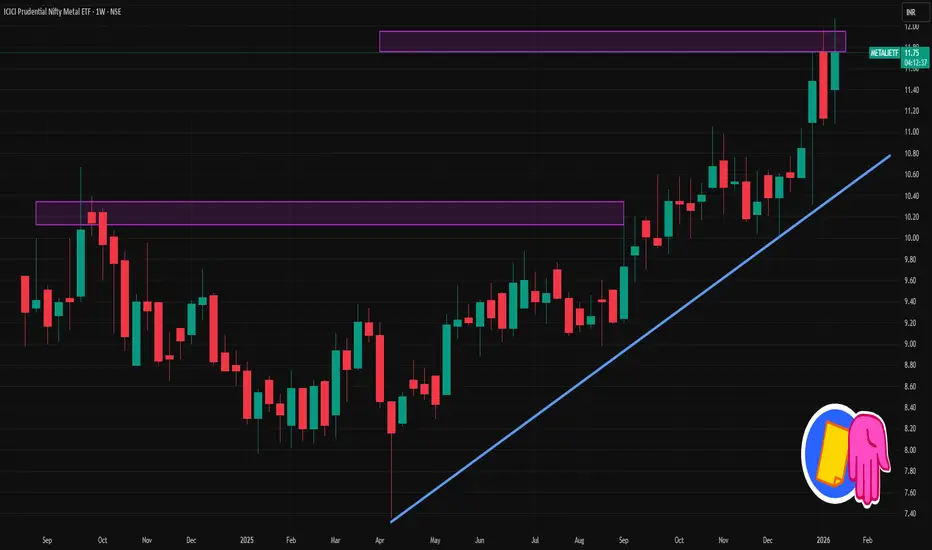
METALIETF 1 Week Time Frame 📊 Current Context (Latest Price)
• The ETF is trading around ₹11.6–₹11.8 (mid‑Jan 2026 data).
📈 Weekly Technical Levels (Pivot‑Based Support / Resistance)
From the weekly pivot point analysis:
Weekly Pivot Point (Center): ~ ₹11.38
This is a key level — above it suggests bullish bias on weekly charts.
Weekly Resistance Levels:
R1: ~ ₹11.71 — first upside target/resistance
R2: ~ ₹12.28 — secondary resistance zone
R3: ~ ₹12.61 — further supply zone if momentum continues
Weekly Support Levels:
S1: ~ ₹11.05 — initial support on pullbacks
S2: ~ ₹10.81 — next support below
S3: ~ ₹10.48 — deeper weekly support
Central Pivot Range (CPR):
Top CPR ~ 11.51
Bottom CPR ~ 11.26
This band often acts as a weekly equilibrium zone — trading above it keeps bulls in control.
📌 Summary – Weekly Key Levels
Level Type Price (₹)
Weekly Resistance 3 (R3) ~11.52
Weekly Resistance 2 (R2) ~11.28
Weekly Resistance 1 (R1) ~11.06
Weekly Pivot ~10.82
Weekly Support 1 (S1) ~10.60
Weekly Support 2 (S2) ~10.36
Weekly Support 3 (S3) ~10.14
HINDZINC 1 Week Time Frame 📌 Current Context (mid‑Jan 2026)
• The stock is trading around ~₹640‑₹654 on NSE.
📊 1‑Week Key Levels (Support & Resistance)
🔄 Weekly Pivot (Standard)
Pivot (weekly baseline): ~₹615‑₹642 (varies slightly by method)
📈 Resistance Levels
R1: ~₹642‑₹677 (immediate weekly resistance)
R2: ~₹677‑₹688 (secondary supply zone)
R3: ~₹704‑₹706+ (higher hurdle)
📉 Support Levels
S1: ~₹579‑₹614 (first weekly support band)
S2: ~₹552‑₹580 (next downside cushion)
S3: ~₹516‑₹553 (deeper support zone)
📉 Weekly Swing Range (Indicative)
Likely weekly range for HINDZINC over next 4–5 sessions:
➡️ Upside: ~₹675‑₹705+ (on strong bullish momentum)
➡️ Downside: ~₹550‑₹580 (if markets soften)
This range assumes standard weekly pivot behavior and typical momentum — actual moves may vary with broader market catalysts like metals index moves or commodity price shifts.

Part 1 Support and Resistance Intraday vs Positional Option Trading
Intraday
Quick profits
Higher volatility
Good for scalping
Needs strict discipline
Positional
Rely on swings
Theta decay risk
Good for spreads

Part 2 Intraday Master ClassTypes of Options
There are two primary types of options:
a) Call Option
A call option gives the buyer the right to buy the underlying asset at the strike price before or at expiry. Traders buy call options when they expect the price of the underlying asset to rise.
Buyer’s risk: Limited to the premium paid
Buyer’s reward: Potentially unlimited
Seller’s risk: Potentially unlimited
b) Put Option
A put option gives the buyer the right to sell the underlying asset at the strike price before or at expiry. Traders buy put options when they expect the price to fall.
Buyer’s risk: Limited to the premium paid
Buyer’s reward: Significant but capped by the price going to zero
Seller’s risk: Substantial

Part 1 Intraday Master Class What Is Option Trading?
An option is a financial derivative contract that gives the buyer the right, but not the obligation, to buy or sell an underlying asset at a predetermined price (called the strike price) on or before a specific date (known as the expiry date). The seller (or writer) of the option, on the other hand, has the obligation to fulfill the contract if the buyer chooses to exercise the option.
Option trading involves buying and selling these contracts in the derivatives market. In India, options are commonly traded on stocks and indices such as NIFTY, BANK NIFTY, and FINNIFTY.

Mastering Emotional Discipline for Long-Term Trading SuccessCan You Control Revenge Trading?
Revenge trading is one of the most common yet destructive behaviors in financial markets. It happens when a trader, after experiencing a loss, immediately tries to “win back” the money by placing impulsive, emotionally driven trades. Instead of following a well-defined strategy, the trader reacts to frustration, anger, fear, or ego. The result is often a spiral of losses that damages not only the trading account but also confidence and mental well-being. The critical question every trader eventually faces is: can you control revenge trading? The answer is yes—but only with awareness, discipline, and structured systems in place.
Understanding Revenge Trading
Revenge trading is rooted in human psychology. When money is lost, the brain interprets it as a threat or injustice, triggering emotional responses similar to anger or anxiety. Traders feel compelled to “fix” the loss quickly, believing that another trade will restore balance. This mindset shifts focus away from probability and risk management toward emotional satisfaction. The market, however, is indifferent to emotions. It does not reward urgency or desperation; it rewards discipline, patience, and consistency.
Revenge trading often shows up in specific patterns: increasing position size after a loss, abandoning stop-loss rules, overtrading in low-quality setups, or trading outside one’s planned timeframe. Many traders recognize these behaviors only after significant damage has been done, which is why controlling revenge trading requires proactive measures rather than reactive regret.
The Cost of Revenge Trading
The financial cost of revenge trading can be severe. One controlled loss can quickly turn into multiple uncontrolled losses, wiping out weeks or months of gains. Beyond money, the psychological cost is equally damaging. Traders may lose confidence in their strategy, begin doubting their skills, or develop anxiety around trading. Over time, this emotional strain can lead to burnout or complete withdrawal from the markets.
Importantly, revenge trading also disrupts learning. Losses are valuable feedback when analyzed objectively, but revenge trading replaces analysis with emotion. Instead of asking “what went wrong?”, the trader asks “how do I get my money back?”—a question that rarely leads to improvement.
Awareness: The First Step to Control
You cannot control what you do not recognize. The first step in controlling revenge trading is self-awareness. Traders must learn to identify their emotional triggers. Common triggers include a sudden large loss, a series of small losses, missing a profitable trade, or seeing others profit while you lose. By journaling trades and emotions, traders can spot patterns between emotional states and poor decisions.
When you notice physical or mental signals—racing heart, frustration, impulsive thoughts, or the urge to place a trade immediately—it is often a warning sign. Awareness creates a pause between emotion and action, and that pause is where control begins.
Building a Rule-Based Trading System
One of the most effective ways to control revenge trading is to rely on a strict, rule-based trading system. Rules remove discretion at moments when emotions are high. These rules should define entry criteria, exit criteria, stop-loss levels, position sizing, and maximum daily loss.
For example, a daily loss limit is a powerful safeguard. If a trader decides in advance that they will stop trading after losing a certain percentage or amount in a day, it prevents emotional spirals. Similarly, fixed position sizing ensures that no single trade—or emotional impulse—can cause catastrophic damage.
The key is commitment. Rules only work if they are followed even when emotions resist them. Many successful traders treat their rules as non-negotiable, similar to safety protocols in aviation or medicine.
Risk Management as Emotional Protection
Risk management is not just about protecting capital; it is about protecting the trader’s psychology. When risk per trade is kept small, losses become easier to accept. A loss that represents 1% of capital feels manageable, while a loss of 10% can trigger panic and revenge behavior.
Proper risk-reward planning also helps. When traders know that one winning trade can cover multiple small losses, they are less likely to feel desperate after a single loss. This probabilistic mindset—understanding that losses are part of the process—reduces emotional attachment to individual trades.
The Power of Taking a Break
Sometimes the best trade is no trade. Stepping away from the screen after a loss can prevent revenge trading entirely. A short break allows emotions to settle and rational thinking to return. Professional traders often schedule mandatory breaks after significant wins or losses, recognizing that emotional extremes—positive or negative—can impair judgment.
Breaks can be structured, such as a rule to stop trading for the day after two consecutive losses, or informal, such as a walk, meditation, or physical exercise. The goal is to reset emotionally before making another decision.
Developing Emotional Discipline
Emotional discipline is a skill that improves with practice. Techniques such as mindfulness, meditation, or breathing exercises can help traders manage stress and remain present. Over time, traders learn to observe emotions without acting on them. This does not mean suppressing emotions, but rather acknowledging them and choosing not to let them dictate actions.
Reframing losses is another powerful tool. Instead of viewing losses as failures, successful traders see them as business expenses or data points. This mindset shift reduces the emotional sting and the urge to retaliate against the market.
Long-Term Perspective and Professional Mindset
Revenge trading thrives on short-term thinking. A long-term perspective weakens its grip. When traders focus on monthly or yearly performance rather than individual trades, losses feel less personal. Professional traders understand that consistency over hundreds of trades matters more than the outcome of any single one.
Adopting a professional mindset also means accepting responsibility. The market is not an enemy to defeat; it is an environment to navigate. Once traders stop blaming the market and start refining their process, emotional reactions naturally decrease.
Conclusion: Yes, You Can Control Revenge Trading
Revenge trading is not a sign of weakness—it is a natural human response to loss. However, allowing it to dictate decisions is a choice. Through awareness, structured rules, disciplined risk management, emotional regulation, and a long-term mindset, traders can control revenge trading and protect both capital and confidence.
Mastering this aspect of trading often marks the transition from a struggling trader to a consistently profitable one. Markets will always test emotions, but those who learn to respond with discipline rather than revenge gain a decisive edge. In the end, controlling revenge trading is less about controlling the market and more about mastering yourself.

F&O Trading (Futures and Options Trading): A Comprehensive GuideUnderstanding F&O Trading
F&O trading is part of the derivatives market, where the value of contracts is derived from an underlying asset. The underlying asset can be stocks, stock indices (like NIFTY or BANK NIFTY), commodities, currencies, or interest rates. Unlike cash market trading, where investors buy or sell actual shares, F&O trading involves contracts that derive their value from price movements of these assets.
The two main instruments in this segment are Futures and Options, each with distinct characteristics and risk profiles.
Futures Trading Explained
A futures contract is a legally binding agreement between two parties to buy or sell an underlying asset at a predetermined price on a specified future date. In futures trading, both the buyer and seller are obligated to fulfill the contract at expiry unless they exit the position earlier.
Futures are widely used by traders to speculate on price direction. If a trader expects the price of a stock or index to rise, they take a long futures position. If they expect a fall, they take a short futures position. One of the defining features of futures trading is leverage, where traders need to pay only a margin (a fraction of the total contract value) to control a large position.
While leverage increases profit potential, it equally amplifies losses. A small unfavorable movement in price can result in significant losses, making risk management critical.
Options Trading Explained
An options contract gives the buyer the right but not the obligation to buy or sell the underlying asset at a specific price (called the strike price) before or on a specific date (expiry). The seller (or writer) of the option, however, has an obligation to fulfill the contract if the buyer exercises the option.
There are two main types of options:
Call Options: Give the right to buy the asset.
Put Options: Give the right to sell the asset.
Options buyers pay a premium, which is the maximum loss they can incur. This limited-risk feature makes options attractive to beginners. On the other hand, option sellers earn the premium but face potentially unlimited risk, especially in naked option selling.
Options trading allows traders to profit not only from price direction but also from factors like time decay (theta), volatility (vega), and price sensitivity (delta).
Key Differences Between Futures and Options
Futures contracts involve obligation for both parties, while options involve a right for the buyer and obligation for the seller. Futures have linear profit and loss, meaning gains and losses move directly with price changes. Options have non-linear payoffs, allowing for complex strategies such as hedging, income generation, and volatility trading.
Why Traders Use F&O Trading
One of the primary reasons for F&O trading is hedging. Investors use futures and options to protect their portfolios from adverse market movements. For example, an investor holding a large equity portfolio may buy index put options to hedge against a market crash.
Another major use is speculation. Traders attempt to profit from short-term price movements using leverage. Since derivatives require lower capital compared to the cash market, traders can take larger positions.
F&O trading also supports arbitrage opportunities, where price differences between the cash and derivatives markets can be exploited for low-risk returns.
Leverage and Margin in F&O Trading
Leverage is both an advantage and a risk in F&O trading. Traders are required to maintain initial margin and maintenance margin with their brokers. If the market moves against their position, they may receive a margin call, requiring them to add funds.
Poor understanding of margin requirements often leads to forced position closures and heavy losses, especially during volatile market conditions.
Risks Involved in F&O Trading
F&O trading carries significant risk, particularly for inexperienced traders. The major risks include:
High volatility risk, leading to sudden losses
Leverage risk, magnifying losses beyond expectations
Time decay, especially harmful for option buyers
Unlimited loss potential for option sellers
Emotional and psychological pressure, leading to poor decision-making
Many retail traders lose money in F&O trading due to overtrading, lack of strategy, and inadequate risk management.
Risk Management in F&O Trading
Successful F&O trading relies heavily on risk management. Traders must define position size, use stop-loss orders, and avoid risking more than a small percentage of capital on a single trade. Hedged strategies, such as spreads and straddles, help limit losses.
Maintaining discipline, following a trading plan, and avoiding revenge trading are equally important.
Role of Strategy in F&O Trading
F&O trading is not about prediction alone but about probability and strategy. Common futures strategies include trend following and breakout trading. Options strategies range from simple ones like buying calls or puts to advanced strategies such as iron condors, butterflies, calendar spreads, and straddles.
The choice of strategy depends on market conditions—whether the market is trending, range-bound, or highly volatile.
Who Should Trade in F&O?
F&O trading is best suited for traders with:
Strong understanding of market mechanics
Ability to handle risk and volatility
Adequate capital and emotional discipline
Knowledge of technical analysis and derivatives pricing
Beginners should start with education, paper trading, and small position sizes before committing significant capital.
Conclusion
F&O trading is a powerful financial tool that offers immense opportunities for profit, hedging, and portfolio optimization. However, it is not a shortcut to quick wealth. The same leverage that amplifies gains can also magnify losses. Success in F&O trading requires deep knowledge, disciplined execution, robust risk management, and continuous learning.
For traders who respect its complexity and approach it with patience and preparation, F&O trading can become a valuable component of long-term market participation. For those who treat it as gambling, it often results in significant financial loss. Understanding the mechanics, risks, and strategies is the first and most crucial step toward sustainable success in the F&O segment.

GIFT NiftyA Strategic Bridge Between the Indian and Global Financial Markets
GIFT Nifty has emerged as one of the most important instruments linking the Indian stock market with global financial markets. It represents India’s growing integration with international capital flows and reflects how global investors perceive Indian equities in real time. With the establishment of GIFT City (Gujarat International Finance Tec-City) as an international financial services hub, GIFT Nifty has replaced the earlier SGX Nifty and has become the primary offshore derivative for tracking and trading the Nifty 50 index outside mainland India. Its relevance has increased significantly for traders, investors, institutions, and policymakers alike.
Understanding What GIFT Nifty Is
GIFT Nifty is a futures contract based on the Nifty 50 index, traded on the NSE International Exchange (NSE IX) located at GIFT City, Gujarat. Unlike the traditional Nifty futures traded on NSE India during Indian market hours, GIFT Nifty trades for extended hours, closely overlapping with global market sessions such as Asia, Europe, and the US. This extended trading window allows global investors to take positions on Indian equities almost round the clock.
In simple terms, GIFT Nifty acts as a price discovery mechanism for the Indian market when domestic exchanges are closed. It reflects how global news, macroeconomic data, geopolitical developments, and overnight cues are likely to influence the Indian stock market when it opens.
Evolution from SGX Nifty to GIFT Nifty
Earlier, SGX Nifty, traded on the Singapore Exchange, was the most popular offshore derivative for tracking Indian markets. However, to bring offshore trading volumes back to India and strengthen GIFT City as a global financial hub, NSE International Exchange launched GIFT Nifty. Gradually, liquidity shifted from SGX Nifty to GIFT Nifty, making it the primary reference point for global investors.
This transition marked a significant milestone for India’s financial ecosystem, as it reduced dependency on foreign exchanges and enhanced India’s control over its own benchmark derivatives.
Role of GIFT Nifty in the Indian Market
For Indian market participants, GIFT Nifty serves as a powerful indicator of how the market is likely to open. Traders closely monitor GIFT Nifty movements early in the morning to gauge opening gaps—whether the market may open higher, lower, or flat.
If GIFT Nifty is trading significantly higher than the previous Nifty close, it suggests a positive opening sentiment driven by global cues. Conversely, if it is trading lower, it signals potential weakness. This makes GIFT Nifty especially valuable for:
Index traders and scalpers planning pre-market strategies
Options traders adjusting volatility and gap-risk assumptions
Institutional desks managing overnight risk
However, it is important to note that GIFT Nifty is an indicator, not a guarantee. Domestic news, RBI announcements, corporate earnings, and pre-market order flows can still alter the actual opening.
Importance in the Global Market Context
From a global perspective, GIFT Nifty allows international investors to gain exposure to India’s growth story without trading directly on Indian exchanges. India is one of the fastest-growing major economies, and global funds actively track Indian indices for allocation decisions.
GIFT Nifty enables:
Hedging of India exposure by global funds
Speculative positioning based on global macro events
Portfolio rebalancing outside Indian trading hours
For example, if US markets react sharply to inflation data, Federal Reserve commentary, or geopolitical tensions, global investors can immediately adjust their India exposure through GIFT Nifty instead of waiting for Indian markets to open.
Impact of Global Macroeconomic Events
GIFT Nifty is highly sensitive to global macroeconomic developments. Events such as US Federal Reserve interest rate decisions, US CPI data, crude oil price movements, dollar index fluctuations, and geopolitical conflicts often first reflect in GIFT Nifty before impacting Indian markets.
This sensitivity makes GIFT Nifty a real-time barometer of global risk sentiment toward India. During periods of risk-off sentiment, GIFT Nifty may trade at a discount, signaling cautious openings. During risk-on phases, strong buying interest can push it higher, indicating optimism.
Liquidity, Participants, and Market Structure
Liquidity in GIFT Nifty has grown steadily, supported by participation from foreign institutional investors, proprietary trading firms, hedge funds, and global banks. The contract structure, margin efficiency, and tax-friendly environment of GIFT City have further encouraged participation.
Trading in US dollar terms also makes it convenient for global players who prefer avoiding currency conversion complexities associated with onshore Indian markets.
Advantages of GIFT Nifty
Some key advantages include:
Extended trading hours aligned with global markets
Efficient price discovery for the Nifty 50
Reduced dependency on foreign exchanges
Strengthening of India’s international financial standing
Better risk management tools for global and domestic investors
Limitations and Risks
Despite its importance, GIFT Nifty is not without limitations. Liquidity, though improving, may still be lower compared to onshore NSE during peak Indian hours. Sudden domestic news can override global cues, leading to divergence between GIFT Nifty and actual market openings.
Additionally, retail Indian investors do not directly trade GIFT Nifty; its influence is indirect through sentiment and price signals.
Future Outlook of GIFT Nifty
As GIFT City continues to develop and attract global financial institutions, GIFT Nifty is expected to gain deeper liquidity and wider acceptance. With India’s increasing weight in global indices and rising foreign participation, GIFT Nifty will likely play an even larger role in shaping pre-market sentiment and global perception of Indian equities.
In the long term, GIFT Nifty symbolizes India’s ambition to be a global financial powerhouse—offering world-class infrastructure, regulatory clarity, and market access.
Conclusion
GIFT Nifty is far more than just an offshore derivative; it is a critical link between the Indian and global financial markets. It reflects global sentiment toward India, aids in efficient price discovery, and helps both domestic and international participants manage risk and opportunity. As India’s economic influence grows, GIFT Nifty will remain a central pillar in connecting Indian markets with the world, shaping how global capital engages with one of the most dynamic economies of the 21st century.

A Timeless Strategy for Protecting Wealth and Managing RiskHedging with Gold:
Gold has occupied a unique position in human civilization for thousands of years. Beyond its aesthetic appeal and cultural significance, gold has long been regarded as a reliable store of value and a powerful financial hedge. In modern investing, “hedging with gold” refers to using gold as a protective asset to reduce portfolio risk, preserve wealth during uncertainty, and counterbalance losses from other asset classes. In an era marked by inflationary pressures, volatile equity markets, currency fluctuations, and geopolitical tensions, gold continues to play a critical role in risk management strategies.
Understanding Hedging and Gold’s Role
Hedging is an investment technique designed to offset potential losses in one asset by holding another asset that is expected to perform well under adverse conditions. Gold fits naturally into this framework because its price behavior often differs from that of stocks, bonds, and currencies. While equities thrive during economic growth, gold tends to perform better during periods of uncertainty, financial stress, or declining confidence in paper assets.
Gold is not dependent on the performance of a company, government, or financial institution. It does not carry credit risk or default risk, making it fundamentally different from stocks and bonds. This independence is what gives gold its hedging power.
Gold as a Hedge Against Inflation
One of the most important reasons investors hedge with gold is inflation protection. Inflation erodes the purchasing power of money, reducing the real value of savings and fixed-income investments. Historically, gold has maintained its value over long periods, even when fiat currencies lose purchasing power.
When inflation rises, central banks often respond with loose monetary policies or delayed interest rate hikes, which can weaken currencies. As currencies depreciate, gold prices—often quoted in those currencies—tend to rise. This makes gold an effective tool for preserving real wealth during inflationary cycles. Investors view gold as “real money” because it cannot be printed or devalued by policy decisions.
Gold as a Safe-Haven Asset
Gold is widely recognized as a safe-haven asset. During periods of financial crises, market crashes, or geopolitical instability, investors often shift capital from risky assets like equities into gold. This flight to safety increases demand for gold and supports its price when other assets are under pressure.
Examples include global financial crises, banking stress, wars, or sudden economic shocks. When confidence in financial systems declines, gold’s tangible and universally accepted nature provides psychological and financial reassurance. This inverse or low correlation with risk assets makes gold an effective hedge during extreme market events.
Currency Risk and Gold Hedging
Gold also acts as a hedge against currency depreciation. Since gold is priced globally and traded in international markets, it is not tied to the fate of any single currency. When domestic currencies weaken due to trade deficits, monetary expansion, or economic instability, gold prices in that currency often rise.
For investors in emerging markets, where currencies may be more volatile, gold offers protection against exchange-rate risk. By holding gold, investors can partially insulate their portfolios from losses caused by currency devaluation.
Portfolio Diversification Benefits
Diversification is a cornerstone of sound investment strategy, and gold plays a crucial role in this process. Gold typically has a low or negative correlation with equities and, at times, with bonds. Including gold in a portfolio can reduce overall volatility and improve risk-adjusted returns.
Even a modest allocation to gold—often between 5% and 15%—can enhance portfolio resilience. During bull markets, gold may underperform equities, but during bear markets, it can help cushion losses. This balancing effect is central to gold’s role as a hedge rather than a high-growth asset.
Gold as a Hedge Against Systemic Risk
Systemic risk refers to the potential collapse of an entire financial system due to interconnected failures. Events such as banking crises, sovereign debt defaults, or extreme leverage in financial markets can trigger systemic shocks. Gold, being outside the traditional financial system, provides protection in such scenarios.
Unlike bank deposits or financial securities, physical gold does not rely on intermediaries. This makes it particularly attractive during times of financial stress when trust in institutions is weakened. Even gold-backed financial instruments benefit from this perception of stability.
Ways to Hedge with Gold
Investors can hedge with gold through various instruments, each with its own characteristics:
Physical Gold: Coins, bars, and jewelry provide direct ownership and eliminate counterparty risk, though they involve storage and insurance costs.
Gold ETFs and Mutual Funds: These offer liquidity and ease of trading while tracking gold prices.
Gold Mining Stocks: These provide leveraged exposure to gold prices but also carry company-specific and market risks.
Gold Futures and Options: Used mainly by sophisticated investors for short-term hedging and tactical strategies.
The choice depends on investment goals, risk tolerance, time horizon, and accessibility.
Limitations of Gold as a Hedge
While gold is a powerful hedging tool, it is not without limitations. Gold does not generate income like dividends or interest, making it less attractive during stable, high-growth periods. Its price can also be volatile in the short term, influenced by interest rates, currency movements, and speculative flows.
Additionally, gold should not be viewed as a complete replacement for productive assets. Over-allocation can reduce long-term growth potential. Effective hedging with gold requires balance, discipline, and a clear understanding of its role within a diversified portfolio.
Strategic Use of Gold in Modern Portfolios
In today’s complex economic environment, gold remains highly relevant. Rising global debt levels, recurring inflation concerns, monetary policy uncertainty, and geopolitical risks reinforce the need for defensive assets. Gold serves as insurance rather than a speculative bet—its value lies in protection, not rapid appreciation.
Investors who use gold strategically, rather than emotionally, benefit the most. Periodic rebalancing, long-term perspective, and alignment with broader financial goals are essential for effective gold hedging.
Conclusion
Hedging with gold is a time-tested strategy rooted in gold’s unique properties as a store of value, safe haven, and diversification tool. While it may not always deliver high returns, its true strength lies in preserving wealth and stabilizing portfolios during periods of uncertainty. In a world of shifting economic cycles and unpredictable risks, gold continues to shine as a reliable hedge—quietly protecting capital when it is needed most.

SMSPHARMA 1 Day View 📊 Latest Price Context (Indicative)
The stock has recently been trading around ₹340-₹345 on the NSE/BSE.
📈 1-Day Time Frame Levels
🔹 Immediate Resistance Zones
These are levels where supply may increase and price may struggle to rise further:
1. R1: ~₹350–₹351 – First resistance area (short-term pivot zone from intraday studies).
2. R2: ~₹355–₹360 – Next resistance zone based on pivot/EMA clusters.
3. R3: ~₹362–₹365+ – Upper resistance target zone.
🔻 Immediate Support Zone
These are buyers’ areas that may help contain a sell-off on the daily chart:
1. S1: ~₹338–₹339 – Near-term support (intraday pivot support).
2. S2: ~₹331–₹332 – Next support zone (short-term EMA/SMA confluence).
3. S3: ~₹325–₹327 – Stronger support below current price.
📌 Technical Indicators (Daily Box)
Trend & Momentum:
Daily moving averages (20/50/100/200) are generally bullish/bias positive.
RSI on some sources shows moderately bullish / near-neutral conditions, not deeply overbought.
Other oscillators (like MACD, CCI) on alternative platforms vary but can be neutral to bullish on daily context.
Overall, the short-term bias around the daily timeframe is bullish to neutral as long as support levels hold.
⚠️ Important
These levels are indicative and based on technical sources, not real-time live quotes or market orders. Always verify with your trading platform’s live charts (e.g., NSE/BSE live data) before placing trades. This is not financial advice—consider risk management and your own analysis.

Global Market Impact on the Indian MarketInterconnections, Influences, and Future Outlook
The Indian financial market does not operate in isolation. In today’s highly interconnected global economy, movements in international markets significantly influence India’s equity, debt, currency, and commodity markets. Global economic trends, monetary policies of major economies, geopolitical developments, capital flows, and technological shifts all play a crucial role in shaping the direction, volatility, and sentiment of Indian markets. Understanding how global markets impact the Indian market is essential for investors, policymakers, businesses, and traders to make informed decisions and manage risk effectively.
Global Economic Growth and Its Influence on India
Global economic growth directly affects India’s market performance. When major economies such as the United States, China, the European Union, and Japan experience strong growth, global trade expands, benefiting Indian exports in sectors like information technology, pharmaceuticals, engineering goods, textiles, and chemicals. Increased global demand leads to higher revenues and profitability for Indian companies, boosting stock market valuations.
Conversely, a slowdown or recession in global economies negatively impacts Indian markets. Reduced export demand, supply chain disruptions, and lower foreign investments can pressure corporate earnings and investor confidence. For example, global recessions often result in sharp corrections in Indian equity markets as foreign investors turn risk-averse and reduce exposure to emerging markets like India.
Impact of Global Monetary Policies
One of the most powerful global influences on the Indian market is the monetary policy of major central banks, especially the US Federal Reserve. Changes in interest rates in developed economies directly affect global liquidity. When the Federal Reserve raises interest rates, capital tends to flow back to the US in search of higher and safer returns. This often leads to foreign institutional investors (FIIs) withdrawing funds from Indian equities and bonds, causing market volatility, stock price corrections, and pressure on the Indian rupee.
On the other hand, accommodative global monetary policies, such as low interest rates and quantitative easing, increase liquidity in the global financial system. Excess liquidity often flows into emerging markets, including India, supporting equity rallies, bond inflows, and currency stability. Thus, global interest rate cycles have a profound impact on India’s financial markets.
Foreign Institutional Investment (FII) Flows
Foreign institutional investors play a crucial role in the Indian market, and their investment decisions are largely influenced by global market conditions. Risk-on environments—characterized by stable global growth, low inflation, and accommodative policies—encourage FIIs to invest in India due to its growth potential. This leads to rising stock prices, higher trading volumes, and improved market sentiment.
In contrast, during periods of global uncertainty such as financial crises, geopolitical conflicts, or sharp inflation spikes, FIIs often reduce exposure to emerging markets. Large FII outflows can lead to sharp declines in benchmark indices like the Sensex and Nifty, increased volatility, and sector-specific sell-offs, particularly in banking, IT, and large-cap stocks.
Currency Movements and Global Factors
The Indian rupee is highly sensitive to global developments. Strengthening of the US dollar, driven by higher US interest rates or global risk aversion, usually leads to depreciation of the rupee. A weaker rupee increases import costs, especially for crude oil, fertilizers, and electronic goods, which can worsen inflation and affect corporate margins.
However, a depreciating rupee can benefit export-oriented sectors such as IT services, pharmaceuticals, and textiles, as their revenues in foreign currencies translate into higher rupee earnings. Therefore, global currency trends have a mixed but significant impact on different segments of the Indian market.
Global Commodity Prices and Indian Markets
India is a major importer of commodities, particularly crude oil. Global commodity price movements strongly influence India’s inflation, fiscal balance, and corporate profitability. Rising crude oil prices increase input costs for industries, raise transportation expenses, and put pressure on government finances through higher subsidies. This often leads to negative sentiment in equity markets and concerns over inflation and interest rates.
Similarly, global prices of metals like steel, aluminum, copper, and precious metals affect Indian metal companies, infrastructure projects, and manufacturing sectors. A surge in global commodity prices can boost earnings for commodity producers but may hurt downstream industries and consumers.
Geopolitical Events and Global Risks
Geopolitical developments such as wars, trade conflicts, sanctions, and political instability can trigger global market volatility, which spills over into Indian markets. Events like conflicts in oil-producing regions, tensions between major economies, or disruptions in global trade routes increase uncertainty and risk aversion among investors.
During such periods, Indian markets often witness increased volatility, defensive sector rotation, and flight to safety toward gold and government bonds. Geopolitical risks also affect India’s trade relations, energy security, and foreign investment outlook.
Global Equity Market Trends and Correlation
Indian equity markets often show correlation with major global indices such as the S&P 500, Nasdaq, Dow Jones, and Asian markets. Sharp corrections or rallies in global markets can influence opening sentiment and intraday movements in Indian indices. While India has strong domestic growth drivers, global cues still play a critical role in short-term market direction.
However, over the long term, India’s market performance is increasingly driven by domestic factors such as consumption growth, infrastructure development, demographic advantages, and policy reforms. This gradual decoupling highlights India’s growing economic resilience, even as global influences remain relevant.
Technology, Global Capital, and Structural Shifts
Global technological advancements and capital flows are reshaping Indian markets. Increased participation of global investors through ETFs, index funds, and digital platforms has integrated India more deeply into global financial systems. Global trends such as digitization, renewable energy, artificial intelligence, and electric mobility influence sectoral investments in India.
India’s inclusion in global indices and its rising weight in emerging market portfolios also amplify the impact of global rebalancing decisions on Indian markets.
Conclusion: Balancing Global Influence and Domestic Strength
The global market’s impact on the Indian market is deep and multifaceted. Global economic growth, monetary policies, capital flows, currency movements, commodity prices, and geopolitical events collectively shape India’s market dynamics. While these global factors often drive short-term volatility and sentiment, India’s long-term market trajectory is increasingly supported by strong domestic fundamentals.
For investors and market participants, understanding global influences alongside India-specific factors is essential for effective risk management and strategic asset allocation. As India continues to integrate with the global economy while strengthening its domestic growth engines, the interplay between global markets and the Indian market will remain a defining feature of its financial landscape.

Part 9 Trading Master Class with Experts Risk and Reward in Options
Options trading can be profitable, but risk management is crucial:
Maximum Loss for Buyers: Limited to the premium paid.
Maximum Gain for Buyers: Unlimited for calls, limited for puts.
Maximum Loss for Sellers: Unlimited for uncovered (naked) calls, substantial for puts.
Maximum Gain for Sellers: Limited to the premium received.
Key Considerations:
Time decay (theta) erodes the value of options as expiration approaches.
Volatility changes (vega) affect pricing and profits.
Market direction (delta) determines sensitivity to underlying price changes.

Part 8 Trading Master Class With Experts How Options Work
The mechanics of options trading can be simplified using the relationship between the buyer and the seller (writer):
Option Buyer: Pays a premium for the right to buy (call) or sell (put) the underlying. The buyer’s risk is limited to the premium paid.
Option Seller/Writer: Receives the premium but takes on the obligation to sell (call) or buy (put) if the buyer exercises the option. The seller’s risk can be unlimited (especially for naked calls).
Example:
You buy a call option with a premium of ₹50 on a stock trading at ₹1,000 with a strike price of ₹1,050. If the stock rises to ₹1,100, your profit = ₹1,100 − ₹1,050 − ₹50 = ₹0. If the stock falls below ₹1,050, your loss = ₹50 (the premium).

Carbon Trading & ESG Investing: Smart, Profitable GrowthIn today’s rapidly evolving global economy, sustainability is no longer just a moral choice—it is a strategic and financial imperative. Carbon Trading and ESG (Environmental, Social, and Governance) Investing stand at the center of this transformation, reshaping how businesses operate, how investors allocate capital, and how economies prepare for a low-carbon future. This powerful combination allows investors and organizations to align profitability with responsibility, creating long-term value while addressing climate change and social impact.
The Rise of Carbon Trading: Pricing Carbon, Protecting the Planet
Carbon trading is a market-based mechanism designed to reduce greenhouse gas emissions by assigning a price to carbon. Governments and regulatory bodies set emission limits, and companies that reduce emissions below their allowed levels can sell surplus carbon credits to those that exceed their limits. This creates a financial incentive for innovation, efficiency, and cleaner technologies.
Carbon markets are expanding rapidly across the world. Compliance markets, such as cap-and-trade systems, are supported by governments, while voluntary carbon markets allow corporations and investors to offset emissions proactively. As climate regulations tighten, carbon credits are increasingly viewed not just as compliance tools but as valuable financial assets. Investors who understand carbon pricing dynamics can tap into a fast-growing market driven by global climate commitments, net-zero targets, and corporate sustainability goals.
ESG Investing: Beyond Profits, Toward Purpose
ESG investing evaluates companies based on three critical pillars:
Environmental impact (carbon footprint, energy efficiency, resource use)
Social responsibility (labor practices, community engagement, diversity)
Governance standards (board structure, transparency, ethical conduct)
Rather than focusing solely on short-term financial returns, ESG investing emphasizes long-term resilience and sustainable growth. Companies with strong ESG practices tend to manage risks better, adapt faster to regulatory changes, and maintain stronger brand trust. For investors, this translates into potentially lower volatility, improved risk-adjusted returns, and alignment with global sustainability trends.
Institutional investors, sovereign funds, and retail investors are increasingly integrating ESG criteria into their decision-making. ESG is no longer a niche concept—it is becoming a core framework for evaluating corporate performance and future potential.
The Powerful Intersection of Carbon Trading and ESG Investing
Carbon trading and ESG investing are deeply interconnected. Carbon emissions are a key environmental metric within ESG analysis, and participation in carbon markets reflects a company’s commitment to climate responsibility. Firms that actively reduce emissions or invest in carbon offsets often score higher on ESG ratings, making them more attractive to sustainability-focused investors.
For investors, carbon markets provide measurable, transparent data on emissions performance. This data enhances ESG analysis, allowing for more informed investment decisions. At the same time, ESG-focused capital flows increase demand for carbon-efficient companies and low-carbon technologies, reinforcing the value of carbon trading mechanisms.
Financial Opportunities in a Low-Carbon Economy
The transition to a low-carbon economy is unlocking vast financial opportunities. Carbon credits, renewable energy projects, clean technology, and sustainability-linked financial instruments are emerging as high-growth areas. Early adopters of carbon trading strategies and ESG portfolios can benefit from structural shifts in global capital allocation.
As governments introduce carbon taxes, stricter disclosure norms, and climate-related financial regulations, companies with weak ESG profiles may face higher costs and reduced access to capital. Conversely, ESG leaders and carbon-efficient businesses are better positioned to attract investment, secure funding, and achieve sustainable profitability.
Risk Management and Long-Term Stability
One of the strongest advantages of combining carbon trading with ESG investing is enhanced risk management. Climate risks, regulatory risks, reputational risks, and social risks can significantly impact financial performance. ESG frameworks help identify and mitigate these risks early.
Carbon pricing adds transparency to climate risk by quantifying emissions exposure. Investors who account for carbon costs are better prepared for policy changes, energy transitions, and market volatility. This proactive approach strengthens portfolio resilience and supports long-term wealth creation.
Corporate Transformation and Competitive Advantage
For businesses, engaging in carbon trading and improving ESG performance is not just about compliance—it is about competitiveness. Companies that invest in clean technologies, improve governance, and adopt responsible social practices often experience operational efficiencies, stronger stakeholder relationships, and enhanced market positioning.
ESG leadership attracts global investors, improves access to capital, and boosts brand credibility. Carbon trading revenues can be reinvested into innovation and sustainability initiatives, creating a virtuous cycle of growth and responsibility.
A Future Driven by Responsible Capital
The future of investing is being shaped by sustainability. Carbon trading and ESG investing are no longer optional trends; they are foundational elements of modern financial strategy. As climate challenges intensify and stakeholder expectations rise, capital will increasingly flow toward businesses and assets that demonstrate environmental stewardship, social responsibility, and strong governance.
For investors, this represents a unique opportunity to participate in global transformation while pursuing competitive returns. For organizations, it is a call to innovate, adapt, and lead.
Conclusion: Invest with Impact, Grow with Purpose
Carbon Trading and ESG Investing together create a powerful pathway where financial growth meets global responsibility. By integrating sustainability into investment strategies, investors can protect portfolios, unlock new opportunities, and contribute meaningfully to a greener, fairer world. This is not just about investing in markets—it is about investing in the future.

Macro-Driven Risk PlanningAnticipate the Economy, Protect Capital, and Seize Opportunities
In an era of rapid globalization, volatile markets, and frequent economic shocks, traditional risk management approaches are no longer sufficient. Investors, businesses, and financial institutions need a broader, more forward-looking framework—one that recognizes how macroeconomic forces shape risk and return across asset classes and industries. Macro-Driven Risk Planning is that framework. It is a strategic approach that places global and domestic economic trends at the center of decision-making, helping stakeholders anticipate risks, adapt proactively, and convert uncertainty into opportunity.
Understanding Macro-Driven Risk Planning
Macro-driven risk planning focuses on analyzing large-scale economic variables—such as inflation, interest rates, GDP growth, fiscal and monetary policy, currency movements, geopolitical developments, and global liquidity conditions—to assess potential risks before they materialize. Instead of reacting after markets move, this approach enables planning ahead of the cycle. It recognizes that asset prices, business performance, and capital flows are deeply influenced by macro forces that operate beyond individual companies or sectors.
Why Macro Factors Matter More Than Ever
Today’s financial ecosystem is highly interconnected. A change in U.S. Federal Reserve policy can impact Indian bond yields, emerging market currencies, commodity prices, and equity valuations within days. Rising crude oil prices can increase inflation, pressure central banks to tighten policy, and ultimately slow economic growth. Macro-driven risk planning captures these linkages, ensuring that risk assessment is not done in isolation but within the context of the broader economic environment.
Core Pillars of Macro-Driven Risk Planning
1. Inflation and Interest Rate Analysis
Inflation erodes purchasing power and directly influences interest rate decisions by central banks. Macro-driven risk planning evaluates inflation trends—both headline and core—to forecast rate movements. Higher rates can reduce equity valuations, increase borrowing costs, and impact real estate and debt-heavy businesses. Planning around these shifts helps in adjusting asset allocation and leverage exposure in advance.
2. Monetary and Fiscal Policy Monitoring
Central bank actions and government spending programs are powerful drivers of market behavior. Expansionary policies may fuel asset rallies, while tightening cycles often increase volatility. A macro-driven approach tracks policy signals, speeches, budget announcements, and liquidity indicators to anticipate changes in market sentiment and risk levels.
3. Growth Cycles and Economic Indicators
GDP growth, employment data, industrial production, and consumer demand provide insight into where the economy stands in the business cycle. Early-cycle, mid-cycle, and late-cycle environments each carry distinct risk profiles. Macro-driven planning aligns investment and business strategies with the prevailing growth phase, reducing exposure during downturns and increasing it during recoveries.
4. Currency and Capital Flow Dynamics
Global capital flows respond quickly to interest rate differentials, political stability, and growth prospects. Currency volatility can significantly impact returns, especially for exporters, importers, and foreign investors. Macro-driven risk planning integrates currency outlooks into decision-making, using hedging or diversification to manage foreign exchange risk.
5. Geopolitical and Structural Risks
Trade wars, sanctions, elections, regulatory changes, and geopolitical conflicts can disrupt markets overnight. Macro-driven planning incorporates scenario analysis for such events, ensuring preparedness rather than panic. It also considers long-term structural shifts such as demographic changes, energy transitions, and technological disruption.
Benefits of Macro-Driven Risk Planning
Proactive Risk Management
Rather than responding after losses occur, macro-driven planning identifies early warning signals. This proactive stance allows timely portfolio rebalancing, cost control, and strategic pivots.
Improved Capital Allocation
By understanding where macro tailwinds or headwinds exist, capital can be allocated more efficiently—toward sectors, geographies, or asset classes with favorable risk-reward profiles.
Reduced Volatility and Drawdowns
Aligning strategies with macro conditions helps avoid excessive exposure during fragile economic phases, reducing portfolio volatility and protecting downside risk.
Enhanced Strategic Confidence
Decisions grounded in macro analysis are less emotional and more disciplined. This builds confidence among investors, stakeholders, and leadership teams, especially during uncertain periods.
Application Across Stakeholders
Investors use macro-driven risk planning to adjust asset allocation between equities, bonds, commodities, and cash based on economic cycles.
Businesses apply it to manage input costs, interest rate exposure, expansion timing, and international operations.
Financial institutions rely on macro frameworks to stress-test portfolios, manage credit risk, and comply with regulatory requirements.
From Risk Avoidance to Opportunity Creation
Macro-driven risk planning is not only about protection—it is also about opportunity. Economic slowdowns may create attractive valuations, policy stimulus can ignite new growth sectors, and currency shifts can boost export competitiveness. By understanding macro trends early, organizations can position themselves to benefit while others react too late.
Conclusion
In a world defined by uncertainty, ignoring macroeconomic forces is itself the greatest risk. Macro-Driven Risk Planning provides a structured, intelligent, and forward-looking approach to navigating complexity. By integrating economic insights with strategic planning, it empowers investors and businesses to protect capital, manage volatility, and capitalize on emerging opportunities. The future belongs to those who plan not just for what is visible today, but for the macro forces shaping tomorrow.

Part 3 Learn Institutional Trading Common Mistakes to Avoid
❌ Buying OTM options blindly
❌ Ignoring time decay
❌ Overtrading
❌ Selling options without hedges
❌ Trading against market trend
❌ Poor risk management
Option trading demands discipline and strategy.

How Smart Money Dominates Financial Markets Institutional Trading Strategies:
Institutional trading strategies refer to the methods and frameworks used by large financial entities such as banks, hedge funds, mutual funds, pension funds, insurance companies, and proprietary trading firms. These institutions control massive capital, sophisticated technology, and deep market access, allowing them to influence price movements and market structure itself. Unlike retail traders, institutional participants focus on scalability, risk-adjusted returns, liquidity management, and long-term consistency rather than short-term excitement. Understanding institutional trading strategies provides valuable insight into how markets truly operate and why prices move the way they do.
At the core of institutional trading is capital preservation and steady growth. Institutions are not trying to double money overnight; instead, they aim to generate predictable returns while minimizing volatility and drawdowns. Every strategy is built around strict risk controls, diversification, and disciplined execution. This mindset alone separates institutional traders from most retail participants.
Market Structure and Order Flow Focus
One of the most critical aspects of institutional trading is the understanding of market structure. Institutions study how price moves between areas of liquidity, such as previous highs, lows, support, resistance, and high-volume zones. Since large orders cannot be executed instantly without affecting price, institutions break trades into smaller chunks and execute them strategically around liquidity pools.
Order flow analysis plays a major role here. Institutions track where buy and sell orders are accumulating and position themselves accordingly. Instead of chasing price, they wait for liquidity to come to them. This is why markets often move sharply after consolidations—liquidity is collected before the real move begins.
Accumulation and Distribution Strategies
Institutions operate through accumulation and distribution phases. During accumulation, large players quietly build positions at favorable prices without alerting the market. This often appears as sideways price action with low volatility. Retail traders frequently lose patience during these phases, unaware that institutions are preparing for a significant move.
Once accumulation is complete, institutions push the price higher (or lower in bearish scenarios) to distribute their positions. Distribution typically happens during high volatility, news events, or strong trending moves, where retail participation increases. By the time retail traders enter aggressively, institutions are often reducing or exiting positions.
Trend-Following and Position Trading
Many institutions rely heavily on trend-following strategies, especially in equities, commodities, and currencies. These strategies are based on the idea that strong trends tend to persist due to macroeconomic forces, capital flows, and investor behavior. Institutions enter trends early using technical and fundamental confirmations and hold positions for weeks, months, or even years.
Position trading allows institutions to avoid noise and short-term fluctuations. They use tools like moving averages, market structure breaks, macroeconomic data, and sector rotation analysis to stay aligned with dominant trends. Risk is managed through portfolio diversification rather than tight stop-losses alone.
Mean Reversion and Statistical Arbitrage
Another powerful institutional approach is mean reversion, which assumes that prices tend to revert to their historical averages over time. Institutions identify overbought or oversold conditions using statistical models, volatility measures, and historical price behavior. These strategies are often automated and executed across hundreds or thousands of instruments simultaneously.
Statistical arbitrage takes this concept further by exploiting pricing inefficiencies between correlated assets. For example, if two historically correlated stocks diverge abnormally, institutions may short the overperformer and buy the underperformer, expecting convergence. These strategies rely heavily on data, probability, and mathematical precision rather than market prediction.
High-Frequency and Algorithmic Trading
Large institutions deploy algorithmic trading systems to execute trades efficiently and minimize market impact. Algorithms determine optimal entry points, execution speed, order size, and timing. High-frequency trading (HFT) firms operate on extremely short timeframes, profiting from tiny price discrepancies repeated thousands of times per day.
While retail traders cannot compete directly in this space, understanding algorithmic behavior helps explain sudden price spikes, liquidity gaps, and rapid reversals. These movements are often liquidity-driven rather than sentiment-driven.
Risk Management as the Foundation
Risk management is the backbone of all institutional trading strategies. Institutions define risk before entering any trade. Position sizing is calculated based on portfolio exposure, volatility, and correlation with other holdings. Losses are accepted as part of the business, but they are controlled and planned.
Institutions rarely risk more than a small percentage of their capital on a single idea. Hedging is also widely used, employing derivatives such as options and futures to protect portfolios against adverse movements. This disciplined approach ensures survival during unfavorable market conditions.
Fundamental and Macro-Based Strategies
Many institutional traders integrate fundamental analysis into their decision-making. This includes studying interest rates, inflation, central bank policies, earnings reports, geopolitical developments, and economic cycles. Macro-driven strategies aim to capture large, long-term moves driven by shifts in global capital flows.
For example, a change in monetary policy can influence currency trends, bond yields, and equity valuations simultaneously. Institutions position themselves across multiple asset classes to benefit from these macroeconomic shifts.
Psychology and Patience
Institutional traders operate with extreme patience. They wait for ideal conditions, execute with precision, and allow trades to develop naturally. Emotional decision-making is minimized through systems, rules, and team-based oversight. This psychological stability gives institutions a significant edge over emotional retail traders.
They also understand that being inactive is a strategic choice. Not trading is often more profitable than forcing trades in uncertain conditions.
Lessons Retail Traders Can Learn
Retail traders cannot replicate institutional resources, but they can adopt institutional principles. Focusing on market structure, liquidity, risk management, patience, and disciplined execution can dramatically improve trading performance. Avoiding impulsive trades and aligning with higher time-frame trends brings retail behavior closer to professional standards.
Conclusion
Institutional trading strategies are built on structure, discipline, data, and long-term thinking. Institutions succeed not because they predict markets perfectly, but because they manage risk effectively, understand liquidity dynamics, and operate with patience and precision. By studying how institutional traders think and act, individual traders can gain a deeper understanding of market behavior and significantly improve their own trading approach.

Technical Analysis vs. Fundamental AnalysisTwo Powerful Approaches to Understanding Financial Markets
In the world of financial markets, traders and investors constantly seek reliable methods to predict price movements and make informed decisions. Among the many strategies available, Technical Analysis and Fundamental Analysis stand out as the two most widely used and time-tested approaches. While both aim to identify profitable opportunities, they differ significantly in philosophy, tools, time horizon, and application. Understanding the strengths and limitations of each approach is essential for anyone serious about trading or investing. This article explores technical analysis versus fundamental analysis in detail, helping you understand how they work, how they differ, and how they can even complement each other.
Understanding Technical Analysis
Technical analysis is the study of price movements, volume, and market behavior through charts and indicators. The core belief behind technical analysis is that all known information is already reflected in the price. Therefore, by analyzing historical price data, traders can forecast future price movements.
Technical analysts focus on patterns, trends, and momentum. They believe that market prices move in trends and that these trends tend to repeat due to human psychology such as fear, greed, and herd behavior. Common tools used in technical analysis include candlestick charts, trendlines, support and resistance levels, moving averages, RSI (Relative Strength Index), MACD, Bollinger Bands, and volume analysis.
Technical analysis is especially popular among short-term traders, such as day traders and swing traders, because it helps identify precise entry and exit points. A technical trader might not care whether a company is profitable or not; instead, they focus on how the stock price is behaving in the market.
One of the biggest advantages of technical analysis is its timing precision. It helps traders decide when to buy or sell. However, its main limitation is that it does not consider the underlying value or financial health of an asset, which can sometimes lead to false signals, especially during unexpected news or events.
Understanding Fundamental Analysis
Fundamental analysis, on the other hand, focuses on evaluating the intrinsic value of an asset. It studies economic, financial, and qualitative factors to determine whether a stock, currency, or commodity is undervalued or overvalued. The core belief here is that price eventually follows value.
For stocks, fundamental analysis includes examining financial statements such as balance sheets, income statements, and cash flow statements. Key metrics include earnings, revenue growth, profit margins, debt levels, return on equity (ROE), and price-to-earnings (P/E) ratios. In addition, macroeconomic factors like interest rates, inflation, GDP growth, government policies, and industry trends also play a vital role.
Fundamental analysis is commonly used by long-term investors, such as value investors and institutional investors. They aim to buy strong companies at reasonable prices and hold them for years, benefiting from both capital appreciation and dividends.
The major strength of fundamental analysis is that it provides a big-picture view of an asset’s true worth and long-term potential. However, it often lacks precise timing. A stock can remain undervalued or overvalued for a long time before the market corrects itself, which can test an investor’s patience.
Key Differences Between Technical and Fundamental Analysis
The most important difference between technical and fundamental analysis lies in what they analyze. Technical analysis studies price and volume, while fundamental analysis studies value and financial health.
Another major difference is time horizon. Technical analysis is usually short-term to medium-term, focusing on quick price movements. Fundamental analysis is long-term, focusing on sustainable growth and future potential.
The tools and data sources also differ. Technical analysts rely on charts, indicators, and patterns, whereas fundamental analysts rely on financial reports, economic data, and business news.
In terms of decision-making, technical analysis answers the question “When should I trade?”, while fundamental analysis answers “What should I invest in?”
Which Analysis Is Better?
There is no universal answer to whether technical analysis or fundamental analysis is better. The choice depends on an individual’s goals, personality, time commitment, and risk tolerance.
If you are a trader who prefers fast decisions, active involvement, and short-term opportunities, technical analysis may suit you better. If you are an investor who believes in long-term wealth creation and prefers studying businesses rather than charts, fundamental analysis may be more appropriate.
Importantly, markets are influenced by both numbers and psychology. Ignoring either aspect can limit your understanding of price behavior.
Combining Technical and Fundamental Analysis
Many successful market participants use a hybrid approach, combining both technical and fundamental analysis. For example, an investor might use fundamental analysis to identify a strong company with good growth prospects and then use technical analysis to find the best time to enter or exit the position.
This combination allows traders and investors to benefit from the strengths of both approaches. Fundamental analysis reduces the risk of investing in weak or overvalued assets, while technical analysis improves timing and risk management.
Conclusion
Technical analysis and fundamental analysis are not rivals but complementary tools in financial market analysis. Technical analysis excels at understanding market behavior, trends, and timing, while fundamental analysis provides insight into intrinsic value and long-term potential. Each has its advantages and limitations, and neither guarantees success on its own.
For consistent results, market participants should first understand both approaches deeply and then choose—or combine—them based on their trading style and objectives. In the end, successful market analysis is not about choosing one method over the other, but about using the right tool at the right time with discipline, patience, and proper risk management.

Day Trading Secrets: The Proven Principles Behind Consistent IntThe Proven Principles Behind Consistent Intraday Success
Day trading looks exciting from the outside—fast moves, quick profits, and the thrill of closing positions within hours. But behind every consistently profitable day trader lies a set of deeply disciplined habits, well-guarded principles, and practical “secrets” that are rarely discussed openly. These secrets are not magical indicators or insider tips; they are grounded in psychology, preparation, risk control, and execution excellence. This article reveals the real day trading secrets that separate professionals from gamblers.
1. Preparation Is the First Secret of Profitable Day Traders
Successful day trading begins long before the market opens. Professionals never start the day unprepared. They analyze global markets, overnight news, index trends, and sector strength to understand the broader market mood. This preparation allows them to trade with the trend rather than against it.
Day traders also prepare a watchlist, not hundreds of stocks, but a focused list of high-liquidity, high-volatility instruments. These stocks often have news, earnings, unusual volume, or technical breakouts forming. Preparation reduces emotional decisions and increases reaction speed during live markets.
2. Trade With the Trend, Not Your Opinion
One of the biggest secrets of day trading is humility. The market does not care about opinions, predictions, or personal bias. Professional traders align themselves with the dominant trend on higher time frames (15-min, 30-min, 1-hour) and then execute entries on lower time frames (1-min, 5-min).
Trying to pick tops and bottoms is one of the fastest ways to lose money. Instead, successful day traders focus on continuation moves—pullbacks in an uptrend and rallies in a downtrend. Trend-following increases probability and reduces stress.
3. Risk Management Is the Real Edge
Most traders search for high-accuracy strategies, but professionals focus on risk-to-reward ratio. A trader can be wrong 50% of the time and still be profitable if losses are small and gains are larger.
Key risk management secrets include:
Risking only 1–2% of capital per trade
Predefining stop-loss before entering a trade
Never averaging a losing position
Exiting immediately when the trade idea fails
Day trading is not about how much you make on winning days, but how little you lose on bad days.
4. One or Two Setups Are Enough
Another powerful secret is simplicity. Profitable day traders do not trade everything. They master one or two high-probability setups and repeat them consistently.
Common professional setups include:
Opening Range Breakout (ORB)
Pullback to VWAP or moving averages
Breakdown from support with volume
Range breakout after consolidation
Mastery comes from repetition, not variety. Trading fewer setups increases confidence and execution quality.
5. Volume Tells the Truth Before Price
Price shows movement, but volume reveals intention. Institutions leave footprints through volume spikes, accumulation, and distribution. Successful day traders always confirm price action with volume.
Low-volume breakouts often fail, while high-volume breakouts tend to continue. Observing volume near support and resistance helps traders identify false moves and genuine momentum.
Volume is one of the most underrated yet powerful tools in day trading.
6. Psychology Wins or Loses the Game
The biggest day trading secret is that trading is 80% psychology and 20% strategy. Fear, greed, overconfidence, and revenge trading destroy more accounts than bad analysis.
Professional traders control emotions by:
Accepting losses as business expenses
Following a strict trading plan
Avoiding overtrading
Stopping trading after reaching daily loss limits
They understand that not trading is also a position. Emotional discipline is what allows consistency to compound over time.
7. Timing Matters More Than Frequency
Many beginners believe more trades mean more profit. In reality, overtrading kills performance. Professionals trade only during high-probability time windows, such as:
Market open (first 60–90 minutes)
Major breakout periods
High-volume sessions
Outside these windows, markets often become choppy and unpredictable. Waiting patiently for the right moment is a powerful but difficult skill—and a true day trading secret.
8. Journaling Accelerates Growth
Every successful trader maintains a trading journal. This journal records entries, exits, emotions, mistakes, and lessons. Over time, patterns emerge—both good and bad.
Journaling helps traders:
Identify emotional mistakes
Improve winning setups
Eliminate losing habits
Build confidence through data
Growth in day trading comes from self-analysis, not market prediction.
9. Losses Are Teachers, Not Enemies
Professional traders do not fear losses; they respect them. Losses provide information about market conditions, timing, and execution errors. The real secret is learning fast and adapting.
A losing trade followed by discipline is success. A winning trade followed by overconfidence is danger. Consistency comes from maintaining the same behavior regardless of outcome.
10. Consistency Beats Big Wins
The final and most important day trading secret is understanding that small, consistent profits outperform occasional big wins. Professionals aim for steady growth, not excitement.
They focus on:
Process over profit
Discipline over impulse
Longevity over quick money
Day trading is a business, not a lottery. Those who treat it professionally survive and thrive.
Conclusion
Day trading secrets are not hidden indicators or insider strategies. They are timeless principles built on preparation, discipline, risk management, and emotional control. The market rewards those who respect probability, protect capital, and remain consistent.
If you master these secrets, day trading becomes less stressful, more structured, and far more profitable over the long run. Success is not about trading every day—it is about trading the right way, every day.
