Advanced Institutions Option Trading - Part 10Option Pricing Models
Institutions rely on theoretical models to value options precisely.
Models Used:
Black-Scholes Model: Most common for European Options
Binomial Model: For American options
Monte Carlo Simulations: For complex path-dependent options
Bachelier Model: For negative rate scenarios
These models help forecast fair value, hedge ratios, and profit probabilities.
🔹 17. Algorithmic and Quant Option Trading
Institutional desks often use automation for efficiency.
Tools & Techniques:
Python, R, C++ for strategy coding
Machine Learning for volatility prediction
Option Flow Analysis (Unusual Orders)
Real-time Gamma Exposure Mapping
Quant desks track Volga, Vanna, Charm, and other second-order Greeks for precise hedging.
Crossover

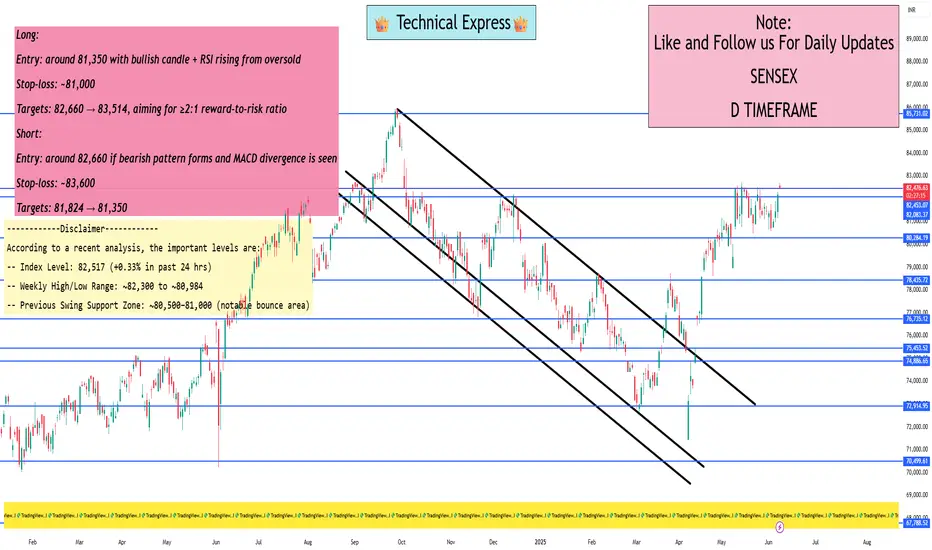
Sensex levels for swing tradingAccording to a recent analysis, the important levels are:
Index Level: 82,517 (+0.33% in past 24 hrs)
Weekly High/Low Range: ~82,300 to ~80,984
Previous Swing Support Zone: ~80,500–81,000 (notable bounce area)
Long:
Entry: around 81,350 with bullish candle + RSI rising from oversold
Stop‑loss: ~81,000
Targets: 82,660 → 83,514, aiming for ≥2:1 reward-to-risk ratio
Short:
Entry: around 82,660 if bearish pattern forms and MACD divergence is seen
Stop‑loss: ~83,600
Targets: 81,824 → 81,350
Banknifty levels for swing tradingAccording to a recent analysis, the important levels are:
Trend‑deciding pivot: 56,713
Primary resistance zones: 56,948, 57,184, 57,420, 57,666
Support zones: 56,578, 56,241, 55,706, 55,534
A dip toward 56,578–56,713 is a potential long entry, targeting 56,948 and beyond.
A break below 56,241 opens doors to deeper support around 55,700–55,500.

Analysis of Moving average stock (22/Nov/2024)Analysis of Moving average stock (22/Nov/2024)
follow for more updates and information

Analysis of intraday,intraweek Moving average stocks 19/Nov/2024Analysis of intraday, intraweek Moving average stocks 19/Nov/2024
follow us for more updates information.
WELCOME TO ARROWINDEX
We're dedicated to providing you the best of Finance stock market , with a focus on dependability and Investment. We're working to turn our passion for Finance stock market into a booming online.We analyze Live Market and try to Provide learning information Content. All the Live Market views and charts .We hope you enjoy our Finance stock market as much as we enjoy offering them to you.Support and offering
Effective online education modules for all segments of traders
Customized portfolio tracker Online research & trading guidance
Entry and Exit support for:-
Intraday trading,Swing trading,Scalping,Position trading
Future & Delivery trading
Technical analysis
Fundamentals analysis
Fii & Dii data and reports

Analysis of Moving average stock (15/Nov/2024)Analysis of Moving average stock (15/Nov/2024)
follow for more updates and information

SUN PHARMA, Technical Outlook and LevelsDuring the crossover of bands the price has been trading in the upper zone.
The breakout of 1,525 will open the higher levels.
Keep this stock on the radar.
Disclaimer: This is my pre market analysis and my trading journal. Not a suggestion to buy or sell.

IRCTC, Formation of Darvas Box in the Compression Zone.According to the degree and nature of separation in bands the price is in the compression zone. Also a Darvas Box is formed in this zone. Wait for the breakout or breakdown of the box. Currently there is no trend in the price.
Disclaimer: This is my pre market analysis and my trading journal. Not a suggestion to buy or sell.

Nifty on Radar, View for 25-JuneToday with a gap down opening the price has taken the support from the important level of 23,334. But as we see the price is following a divergence pattern with RSI. So, the probability of a negative move is high.
Disclaimer: This is my pre market analysis and my trading journal. Not a suggestion to buy or sell.

Nifty on Radar, View for 25-JuneToday we got the same move as we discussed on yesterday. Now the price has broken the support of 126 but we have a hammer candle. For tomorrow the volatility could be high.
Disclaimer: This is my pre market analysis and my trading journal. Not a suggestion to buy or sell.

PNB, Intraday View for 24-JuneWith a closing price of 125.80 the price has given the breakdown of S1-126.
The price could test the lower levels of S2-122.
For tomorrow keep an on the opening price.
Disclaimer: This is my pre market analysis and my trading journal. Not a suggestion to buy or sell.

MANKIND PHARMA, Fresh breakdown with a strong momentum.After the break of structure the price has successfully retested the upper levels now we have a fresh breakdown with a strong momentum. The price could test the lower levels of 2,056 and on my probability scale it is more than 55%.
Disclaimer: This is my pre market analysis and my trading journal. Not a suggestion to buy or sell.

ADANIGREEN, Technical OutlookWith a bearish cross of bands the price has been trading in the negative zone. From these levels the price could give a short trade of 9% to 10%. The level of R1-1,870 can be used as a maximum stroploss level.
Disclaimer: This is my pre market analysis and my trading journal. Not a suggestion to buy or sell.

PNB, Intraday View for 20-JuneToday we have an indecisive candle in the positive zone. The probability of gap up or gap down is very high. But there is no change in the structure.
For tomorrow the intraday range is 130 to 136 and 126 to 122.
Disclaimer: This is my pre market analysis and my trading journal. Not a suggestion to buy or sell.

SHREE CEMENT, Gravestone Doji is formed at the top.After a swing of 18% now a Gravestone Doji candlestick pattern is formed on the top.
The breakdown of 26,825 will open the lower levels.
Disclaimer: This is my pre market analysis and my trading journal. Not a suggestion to buy or sell.

TITAN, Breakout of StructureThe price has given the breakout of the structure.
Also RSI is above 60, so the probability of an uptrend is very high.
The next Important Level is 3,838
Disclaimer: This is my pre market analysis and my trading journal. Not a suggestion to buy or sell.

“Allovir” A LONG Story.Buy below .6698
Target 1 = .7167
Target 2 = .7604(only with trailing stop loss)
Stop loss = .6235
And like I always say do not believe in what I say or post, sometimes I don’t believe myself. It’s not a suggestion/recommendation/advice to buy/sell
Just paper trade.
GG.

IndusInd Bank Long for target of 1500 to 1600IndusInd Bank moving averages are in a mood for positive crossover on monthly charts.
Monthly chart may have an golden crossover in coming few months
Target of 1500 - 1600.
Wait for at least 13-50 crossover to complete before entering the stock.

Castrol India very BULLISHPositional Buy
It is trading on a very STRONG SUPPORT ZONE
Also we have seen 21 EMA crossover on monthly chart

Laxmi Organic, Chart Structure and Important LevelsThe price is following a symmetric triangle pattern. Now the price is trading near the lower leg and, the convergence and degree of ema bands also indicates a downtrend could continue. Also its important to mention that the breakdown or breakout of a triangular pattern indicates the start of an trend, but for confirmation of a downtrend the price has to breakdown the level of 270 and for confirmation of a uptrend the price has to breakout the level of 300. Currently we are in the neutral zone.
Hit the like button!! Show some energy!!
Disclaimer: This is my pre market analysis and my trading journal. Not a suggestion to buy or sell. This material is for educational purposes.
Thanks
Er. Simranjit Singh Virdi

Weakness in Nifty Oil and Gas SectorChart type - Heikin Ashi
Time frame - Daily
Indicator - Guppy Multiple Moving Average
Today we have a Red HA candle with a strong body which shows a countable decline in the momentum. Also a day before we have a doji candle at the top of the uptrend which is a sign of trend reversal. But I wait for the bearish crossover or a strong breakdown of the moving averages.

silver buy longtermsilver chart correction complete elliot wave analysis
confrimation show chart candlestick daily chart
rsi or macd postive crossover
silver buy 21.68
stoploss 20.6

IGLWait And Watch ??
Look for Low risk, High reward, and High Probability setups-
Things to Remember while Trading with the Trend
1. Know what the trend is.
2. The best trades are made in the direction of the trend.
3. Assume that the main trendline or moving average will hold.
4. The longer the moving average is, the better it defines the trend.
5. Wait for the pullback.
6. Don’t chase the market.
7. Don’t fight the market.
8. Even in the strongest trends there should be some retracement.
9. The closer the market is to the trendline, the better the risk/reward ratio is.
10. Use ADX to determine the strength of the trend.
11. Higher the level of ADX , the stronger the trend, below 20 consider the market to be choppy
12. Hold trades longer in a strong trend.
13. Wait for confirmation of a trendline breaking before reversing position.
14. Know where the Support levels are.
15. Place stops outside the Support levels.
Thank You..
