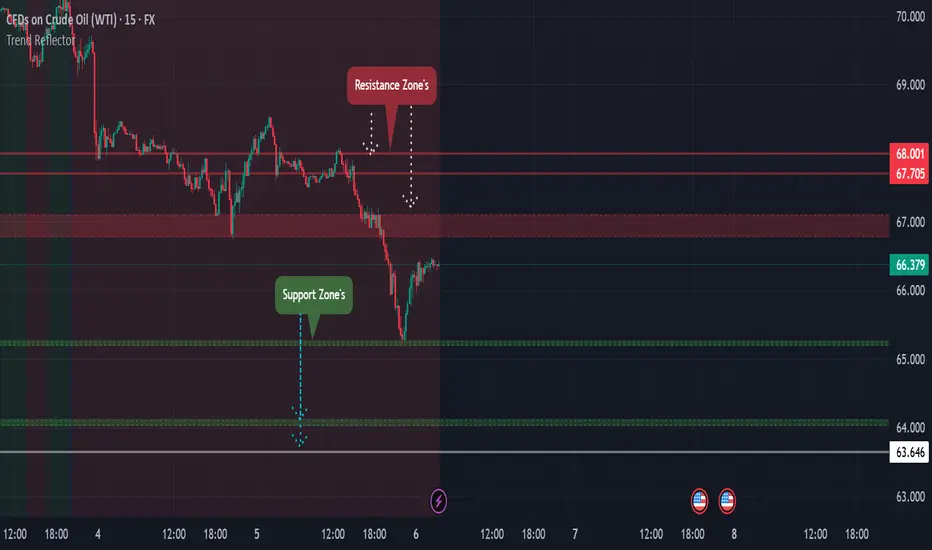
USOIL chart pattern for upcoming session of Thursday 15M TFIn the last session USOIL closed at 66.379 (2.4%) down and made of low of 65.208 , i've looked the chart on every TF and i've figured out some important levels of the crude ,on looking at the closing and price action formed our Near and major resistance zone is 66.795 - 67.090 this is a big zone but major zone and after that we've got the next resistance at 67.705 and the next one is 68.000 -68.105 , while looking at the chart in higher TF now market is going to compress or outburst for alternative scenario we've got some support zone's 65.259 - 65.200 is the level of support zone and it's also almost the low level of last session after that next support we've got on looking at every TF is 64.040 - 64.140 and after that 63.646 is the level which hold's some support , these are the level's which i got while studying the chart until new one is formed so we've to very clear here watch out every zone and level and look how price react's to it i've already told you how to trade in rejection and continuation pattern in our previous idea's ( and yeah sorry for typing mistake of level's and zone's in last USOIL idea published ) and i request every follower to avoid trading in news time ,now let's see how market react's on these levels.
Crudeoil!
USOIL or CRUDEOIL Downtrend Movement upto 49SYMBOL USOIL or CRUDEOIL
Timeframe Day chart
Analysis: Breakout from the triangle pattern and we can expect a downtrend movement upto 49
We hope our analysis is adding value to your trading journey.
Please note: Published ideas are for educational purposes only. Trade at your own risk.
Also, please respect the risk - stop loss (SL) should not be more than 2% of the capital.
DISCLAIMER: We are not SEBI registered. All the videos uploaded in this channel are solely for educational purposes."

USOIL Trade Idea (Zones) for Friday session 28-02-25After studying USOIL at higher TF and watching it's closing price i think 70.106 - 70.634 is No-trade zone for USOIL due to it's complexity at higher timeframe , i've also drawn a zone which can push price to downward direction which is represesnted by orange color in the chart if price sustained above this level then it can go to it's next resistance zone of 76.500 - 76.600 but here SL should be below the zone which is 70.106 and the zone itself is mutual in multiple timeframe so be cautious to trade in this zone and use manage Quantity , and for alternative scenario if price goes below 70.106 and sustained then we can see then 69.150 level because it was the last swing created and below it other levels are also mentioned in the chart , look for reversal and continuation pattern to enter in trade .

Crudeoil expected uptrend movement upto 74/75.5Symbol CRUDEOIL
Timeframe 1 hour
Analysis Uptrend Movement upto 74/75.5 expected.
Breakout from Triangle pattern, so we can expect a uptrend movement upto 74/75.5
We hope our analysis is adding value to your trading journey.
Please note: Published ideas are for educational purposes only. Trade at your own risk.
Also, please respect the risk - stop loss (SL) should not be more than 2% of the capital.
DISCLAIMER: We are not SEBI registered. All the ideas posted in this channel are solely for educational purposes."

CRUDEOIL BULLISH VIEWCrude Oil Bullish View above 6400.
CMP 6390
Ready For Upside 6500-6600.
Weak Below 6290 ( 5 min CLB)
For Educational Purpose only.

view on Crude oil MCX futurescrude oil retesting its trendline resistance in weekly timeframe, now crude needs to sustain above 6300-6250 to resume upside target of 7000-7300+. Otherwise, downside targets of 5900 -5600 will be open.

SILVER VIEW⚠️Education Purpose only!!!!
Key Support area:-87,100
Key Resistance area:-96,200
Silver has long been considered a 🏦 store of value and a 🛡️ hedge against inflation.
Riskier but suitable for speculation and hedging.
🔧 Industrial Demand – Used in ⚡ tech, ☀️ solar, 🚗 EVs
💰 Monetary Hedge – Safe-haven in 🔥 inflation & 📉 downturns
⛏️ Supply Constraints – Limited mining, rising demand 📊
📊 Growing Investment – ETFs & retail piling in 🚀
⏳ Long-Term View
If industrial demand and inflation persist, silver could see 📈 strong appreciation over the next decade.
🔍 Investors should monitor global economic trends, 📉 interest rates, and ⛏️ mining supply data to make informed decisions. 🚀
Price Action applied :-
⭕️50 Day Moving averages
⭕️Channel Pattern Formation
⭕️Range Breakout
⭕️Triangle Pattern Formation
⭕️Demand Zone
⭕️Major Resistance area
✅Check out my Trading View profile to see how we analyze charts and execute trades.
🙋♀️🙋♂️If you have any questions about this stock, feel free to reach out to me.
📍📌Thank you for exploring our idea! We hope you found it valuable.
🙏FLLOW for more !
👍LIKE if useful !
✍️COMMENT Below your view

view on crude oil futures India #CRUDEOILcrude oil broke its support at 6680 from 6735, its next support is 6549 and if it breaks below this level,
it can test 6340-6380,
if sustain above 6630 can test 6720 !!

USOIL or CRUDEOIL DOwntrend Movement upto 76.5/75.15/74Symbol : USOIL or CRUDEOIL
TIMEFRAME 1HOUR
Analysis DOWNTREND Movement
can expect the target upto 76.5/75.15/74
NOTE: Published Ideas are for ‘’EDUCATIONAL PURPOSE ONLY’’ trade at your own risk.
NOTE: RESPECT The risk. SL should not be more than 2% of the capital.
Happy Trading

Updated crudeoil chart for aiming 7000+on 24th November I shared crude oil view with potantial target for 7000+ for upcoming days.
On chart my 1st Target is exactly achieved for 6383 on 3rd January 2025 with making high of it.
Now I made updated some potantial support for Crude Oil.
If it comes towards the zone then Crudeoil aiming up fast for 7000+
otherwise crudeoil try to make sideways zone around 6300-6500 for more days.

Crude Oil ViewCrude is continuously taking support from the marked zone on the daily time frame. It looks like we can have the targets for upto 7000+ in crude very soon.
(Shared for educational purpose only)

Crude Oil Ready to Explode: Wave (iii) Targets Sky-High Gains Chart Interpretation
1. Triangle Pattern:
A visible contracting triangle pattern (marked as Wave (ii)) indicates consolidation before a breakout.
Triangles typically occur in Wave 4 or corrective waves (B waves).
Fibonacci Levels:
Fibonacci extensions (1.618, 2.618, 3.618, etc.) are used to project potential targets for Wave (iii), Wave (v), or corrective moves.
1.618 (7,156): A potential target for Wave (iii).
2.618 (8,125): Extended target for Wave (iii).
3.618 (9,094): A stretch target if the trend is powerful.
Current Status:
The chart indicates that Wave (ii) (a corrective phase) is concluding, with a breakout expected into Wave (iii).
Wave (iii) targets are aligned with key Fibonacci levels, showing potential price surges.
2. Future Projection
After completing Wave (iii) and a brief correction in Wave (iv), the price may proceed to Wave (v), likely targeting higher levels.
Post the 5-wave impulse, a corrective A-B-C structure may follow, resetting the trend.
3. Trading Insight
A breakout above the triangle pattern could confirm the start of Wave (iii).
Regards,
SG

XTIUSD next move from golden 61% level after Market structure Shift crude may move to grab LIQ from 68.4 level
my SL is 68
target is 71.25
I think crude is now bullish and ready for a bull run...

Crude oil Gartley harmonic pattern found on triangle edge point with trendline support
very imp point 5955
want closing and susstain above the 5955 now it ve very clear runway above 5955
now we can see next journey for the upside till 6173-6355-6802 if 5955 support hold

CRUDE OIL - Short and Long Oppurtunity in INTRADAY 20 Dec 2024Price break the support line (Black color) formed since 11 Dec and it looks like it is time to Short. Also, Monthly CPR Pivot range comes under the support line so there will be oppurtunity for Long if price touch 8840 and reverses and go inside the channel.

Light crude oil, offering potential +33% return on investmentA triangle pattern formed in Light crude oil Futures. A breakout above this pattern could lead to the market reaching the target of USD 95. Offering a potential +33% return on investment. Best of luck!

USDWTI Crude oil, offering potential +33% return on investmentA triangle pattern formed in U.S. Dollar/WTI crude oil. A breakout above this pattern could lead to the market reaching the target of USD 94.99. Offering a potential +33% return on investment. Best of luck!

Wisdomtree crude oil, potential +30% return on investmentA triangle pattern formed in Wisdomtree WTI crude oil. A breakout above this pattern could lead to the market reaching the first target of EUR 12. Offering a potential +30% return on investment. Best of luck!

USOIL - Swing Breakout-> USOIL - is now breaking the swing support
-> Seems Bullish for next few weeks
-> Expecting a rally towards $72.00
-> If $72.00 breaks, next resistance will be $77.00
-> Good Luck, Traders!

Trend Line analysis for DJIDJI may reach to new lows at 44537!
It seems dji is unable to touch or break 45000 level may reach to its support before any move further on upside
Support : 44800,44700

CRUDEOIL 4HR ORDER BLOCK | LONG TRADEHi Trader,
This is crudeoil 4hr POI (point of interset) according to SMC (Smart Money Concept)
Buyers will come at this level. so i expect Buying from this level. 5636-26 After CHoCH (change of character) i will take trade with small SL..
Thank You..
If you Like my anaylsis so give like and Follow me..
Note- Only for education purpose..

Brent Crude Breakout possibleHello Everyone,
Brent crude price 72.60 breakout possibel above resitance strong momentum till 75,77,80 RSI having strength,volume is concern waiting for either side break is good but overall bullish set up with Awesome ocsillator.

CRUDEOIL next move of December expiry CRUDEOIL is in a range of 5900 to 5750 and creating cup & handle pattern, up side move is possible before December expiry as per chart analysis if not get any negetive news, keep and eye on levels.
I am not SEBI REGISTERED analist, This is my personal view only for education purpose.
