CFTC COT Plots - Financials / Legacy / DisaggregatedCFTC publishes on a weekly basis COT reports in 3 formats - Legacy, Disaggregated, Financials.
www.cftc.gov
Big financial / commodity / currency traders keep a watch on this data on a weekly basis. All futures traders should also track this data.
To make it easy to consume, I created 3 indicators to consume this information in a simple way
Financials
Disaggregated
Legacy
Here are some screenshots with examples
Commodities
Currencies
Enjoy the indicators :-)
Crudeoil!

crude oil Demand and Supply For 14th November 2022For Crude Oil demand and supply zones are marked. If market rejects at demand zone , then a high probability buy trade can be initiated, rather in case of supply zone a sell trade. You must have a good candlestick knowledge in order
to utilize the zones at the best. You can even learn it from us. don't forget to look for PriceActionMonk.

Crudeoil intraday levels for 10.11.2022Resistance level: 7094
Support level : 7038
****Fib Retracement levels will act as the support or resistance****
If candles are sustaining or break above resistance level , we can expect upside move and the targets will be fib retracement levels as per chart
If candles are sustaining between resistance and support levels, consider as neutral
If candles are consolidating in buy zone or sell zone, wait for the breakout
If candles are sustaining or break below support level , we can expect downside move and the targets will be fib retracement levels as per chart.
If gap up or gap down opening, fib retracement levels will act as the support or resistance
Note: Pls check my previous day idea for better understanding & how it works
Please let me know in comment section if you have any queries and like the idea If you agree with the analysis.
Disclaimer:
Views are purely educational in nature. You are solely responsible for any decisions you take on basis of my research

Next move - Crude Oil - MCX
Wait for order filling at the 7100 range to move up. It will enter zone by 11th Nov 2022.

Crudeoil intraday levels for 09.11.2022Resistance level: 7443
Support level : 7335
****Fib Retracement levels will act as the support or resistance****
If candles are sustaining or break above resistance level , we can expect upside move and the targets will be fib retracement levels as per chart
If candles are sustaining between resistance and support levels, consider as neutral
If candles are consolidating in buy zone or sell zone, wait for the breakout
If candles are sustaining or break below support level , we can expect downside move and the targets will be fib retracement levels as per chart.
If gap up or gap down opening, fib retracement levels will act as the support or resistance
Note: Pls check my previous day idea for better understanding & how it works
Please let me know in comment section if you have any queries and like the idea If you agree with the analysis.
Disclaimer:
Views are purely educational in nature. You are solely responsible for any decisions you take on basis of my research

US OIL ELLIOT WAVE COUNTS AND BREAKOUTCrude oil is looking Bullish ahead Reasons are mentioned below
Inverted head n shoulder Neckline Breakout
Price taking support from RK's Mass psychological cloud and RK's stopline in daily time frame
Possible wave counts on weekly chart
Possible wave counts on Daily chart
Possible wave counts on 4 hourly
Possible wave counts on 1 hourly
Price challenging upper band on daily time frame
macd positive cross in daily time frame
macd converging towards north uptick in weekly time frame
RSI uptick above 60 in daily time frame
DMI ADX positive uptick in daily time frame
Price closed above 50dema, 100dema & 200dema
Weekly close above 20WEMA, its also above 50 WEMA, 100 WEMA & 200 WEMA.
Most investors treat trading as a hobby because they have a full-time job doing something else.
However, If you treat trading like a business, it will pay you like a business. If you treat like a hobby, hobbies don't pay, they cost you...!
Disclaimer.
I am not sebi registered analyst.
My studies are for educational purpose only.
Please Consult your financial advisor before trading or investing.
I am not responsible for any kinds of your profits and your losses.

Crude Oil Daily H&S
Market can be bullish if it breaks the neckline of crude oil h&s pattern. Keep your eyes.

CRUDEOILAs crude oil is continuously moving in an undecisive manner, not giving many moves to go long now, we can see a good move from it.
the triangle breakout will give us a good long and short position in the upcoming weeks.
Levels that are holding the immediate support are 85.50 for the short-term period and 82.00 for the long-term period.
levels that are resisting the crude are 90.00 immediate resistance and 93.50 major resistance on the upper side.
Thus, the panic between OPEC+ , RUSSIA , and the USA is making the Crude more indecisive and making the crude market move slower .
In the upcoming days, we can see a one-sided move after the breakout of the triangle pattern .
BELOW 82.00 we can see the targets of 78.00.
Above 90 our first target is to be up to 93.50 and then 95.
NOTE- All the levels are based upon my analysis you should do your analysis and then confirm your trades before taking the trade.

90.50 is strong resistance for crudeCrude price reverse back from around 90.50 for 7 times in last 12 days. Today again it visited the hurdle and turned back. Interesting to watch .

Crude bearish Price is trying to take support at prior low but RSI is making lower low. Looking at scenario, we can guess that... Price can not sustain at these levels.

Crude Long (01 Nov)Crude Long (01 Nov)
RSI-55
Buy at CMP- 7257 or at 7240
SL- 7200
Target- 7340, 7379
Join us, Learn more, Earn more
Disclaimer- We are not SEBI registered advisor.
Charts and views are only for educational purpose.


Crude Oil (MCX): Tuesday - 01/11/22Levels:
Support: 7250, 7180, 7130, 7000
Resistance: 7250-7275, 7300, 7400.
OI Data (16th Nov Expiry):
Highest OI Call in Crude per OI data: 7500
Highest OI Put in Crude per IO data: 6500
Nearest Major Resistance in Crude per OI data: 7300 (the CMP)
Nearest Major Support in Crude per IO data: 7000
Trade setup:
1. For any buy trade, follow the N pattern (let the price run above the level, let it retraces back to the level and let it hold the level as support)
2. For any sell trade, follow the mirror-N pattern (let the price fall below the level, let it pull back to the level and unable to pass through the level as resistance).
3. Crude is negotiating 7300 today. Above 7300, it will reach first 7330, then 7400 level.
4. The solid support is at 7000 level.
Trade:
1. Once 7300 is broken and a N pattern is created (i.e. 7300 is retested and hold), try with a 7400 CE (16th Nov expiry)
2. Around 7400 if resistance faced and retested (i.e. price unable to sustain above 7400), book the CE and try with a 7300 PE (16th Nov expiry)
Note: both of these are naked Commodity Options, so inherently risky (riskier than Bank Nifty)

Bullish divergence on crude On hourly chart, there's bullish divergence. Chance of upmove is increasing.

Crude Short (31 Oct)Crude Short (31 Oct)
RSI-40
Sell at CMP- 7182
SL- 7273
Target- 7110, 7055
Join us, Learn more, Earn more
Disclaimer- We are not SEBI registered advisor.
Charts and views are only for educational purpose.

Crude Oil (MCX): Monday - 31/10/22Levels:
Support: 7180-7160, 7120, 7000 (Solid Support, even in OI data)
Resistance: 7250-7275, 7300, 7400.
OI Data (16th Nov Expiry):
Highest OI Call in Crude per OI data: 7500
Highest OI Put in Crude per IO data: 6500
Nearest Major Resistance in Crude per OI data: 7300
Nearest Major Support in Crude per IO data: 7000
Trade setup:
1. Still by-and-large range-bound. However the range is shifted higher side.
2. New range: 7300-7000 (Price-Action data is matching with OI data)
3. Anyone wish to play hedge can go with a range-bound non-directional strategy of the following range.
A. buy 7500 CE (Nov-16 expiry) :
B. buy 6800 PE (Nov-16 expiry) :
C. sell 7400 CE (Nov-16 expiry)
D. sell 6900 PE (Nov-16 expiry)
Net credit - (i.e. you need not to pay, rather earn different of premiums): 70 per lot. (Margin you have to check with broker)
BEP (safe range): 7450-6850

Crude Oil (MCX): Friday - 28/10/22Crude levels for evening session:
-------------------------------------------------------
(Just sharing screen with levels - did not checked OI data).
If it goes above the red uptrendline ~7400 level, it will be bullish for sure.
Below 7125-7150 has good support.
Mota mota: 7100-7400 level for today.

#Crude Short (28 Oct)#Crude Short (28 Oct)
RSI-34
Sell at CMP- 7238
SL- 7342
Target- 7132, 7075
Join us, Learn more, Earn more
Disclaimer- We are not SEBI registered advisor.
Charts and views are only for educational purpose.
#mcx #commodities #commodity

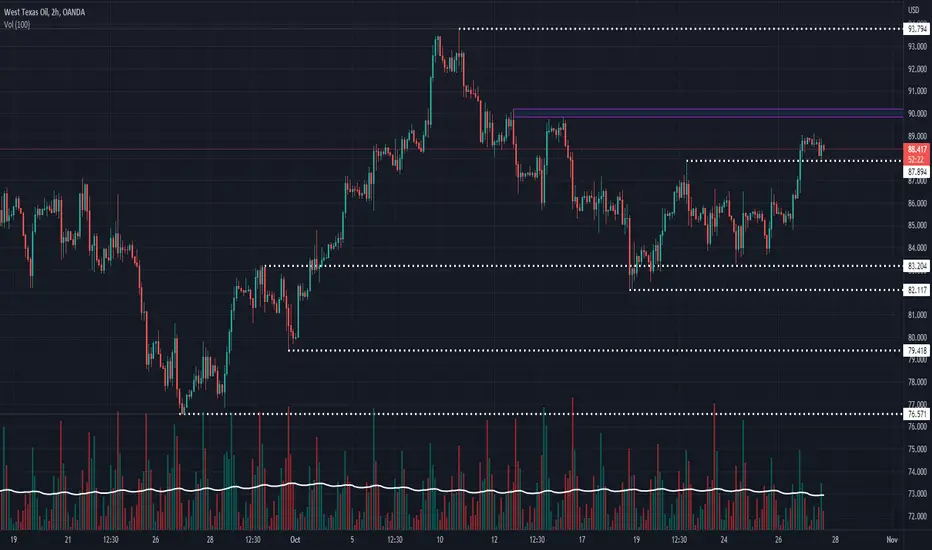
Update on the WTICOUSD(Crude Oil) WTICOSUD(Crude Oil) is showing some interesting movement on major levels. Major upper and lower levels could be breached in the future.
Crude Oil is showing a strong upward movement in the 1Hour chart breaching the level of $87.894. It seems that the counter is consolidating, if the price retests the levels of $87.80 and makes any type of bullish pattern or sign, then the counter can be stated to buy on dips. However, if the price cuts under the $87.80 price mark you can say it’s a falls breakout. It seems to me that the levels from $87.894 to $82.117 are the consolidation zone because of the major support mark of $83.204 to be pressed as per ‘Hourly’ charts like 1H,2H,3H, and 4H respectively.
If the price retests the $87.80 mark shows singings of a bullish move. I see overhead resistances at the price mark of $90.00 and $94.00.
• $90.00 can be considered as overhead resistances since the recent fall after the first structure change breakout. Price was rejected twice from the zone of $90.189 to $89.826 and a major fall was seen, hence the mark of $90 as per the hourly chart
• $94 mark was considered, because of the major fall seen from this mark after the first structure change breakout.
After the signs of a retest of the $87.80 mark, the counter can be considered as “Buy On Dips”(BOD). Then after the First Structure Change in the 1Day chart if the price sustains above the price mark of $94 you can consider the counter going in an uptrend.
There is also the major possibility of the breakdown of crude, considering fundamental things. The major support level that you can see as of now is $83, if the price breaches the zone of $83.204 to $82.117 this counter can be considered as a sell-on really and the price can be seen touching the support levels of $79.418 & $76.571 as well.
In my opinion, if the price breaches the mark of $76.5 and continues to move, and also if the major level in the 1day chart breaks down, then Crude would continue the Downtrend and we can say that this was just a consolidation phase.
Furthermore, support levels in daily and weekly charts are $66.391, $62.069, $33.501 & $11.104 as far as I can see, after creating a Multi Time Frame view(MTF) from an “only chart analysis perspective”. practically speaking these levels aren’t possible in today’s economical times.
“WTICOUSD” is the code for ‘crude oil’ on the ‘trading view’ platform source known as “OANDA” to see the chart I’m talking about.
Crude Oil (MCX): Thursday - 27/10/22Levels:
Support: 7180, 7120, 7120, 7020
Resistance: 7290-7300, 7360-7400.
OI Data (16th Nov Expiry):
Highest OI Call in Crude per OI data: 7500
Highest OI Put in Crude per IO data: 6500
Nearest Major Resistance in Crude per OI data: 7300 (1370 OI with 16% addition y'day)
Nearest Major Support in Crude per IO data: 7000 (2615 OI with 25% addition y'day)
Trade setup:
1. Yesterday there is a very good breakout above 7180 level with high volume.Which is a bullish indication.
2. The next crutial level to watch for is: 7300 (7230-7290 is the zone). If it sustains above it, 7400 is in the card.
3. Anyone wish to play hedge can go with a range-bound non-directional strategy of the following range:
A. buy 7500 CE (Nov-16 expiry)
B. buy 6600 PE (Nov-16 expiry)
C. sell 7400 CE (Nov-16 expiry)
D. sell 6500 PE (Nov-16 expiry)

Crude Demand and Supply [27th October 2022]
Crude is trading in no trading zone.We had marked corresponding demand and supply. When the market will reach either of demand or supply zone marked, we will plan our trade depend on candlestick or chart pattern.

My view on CrudeoilCrudeoil forming head & shoulder pattern. Below 6950-6900 it may nose dive.We are keeping on radar crudeoil 6800 PE.

My Assumption on Crude Oil November 2022, This is my assumption on Crude Oil and it may be 100% wrong in actual Trade. I am not a SEBI registered analysts and I do not encourage anyone to take trade on the basis of that. Please consult your Financial Advisor before entering into any trade. I just shared what I feel about Crude Oil in the coming days.
