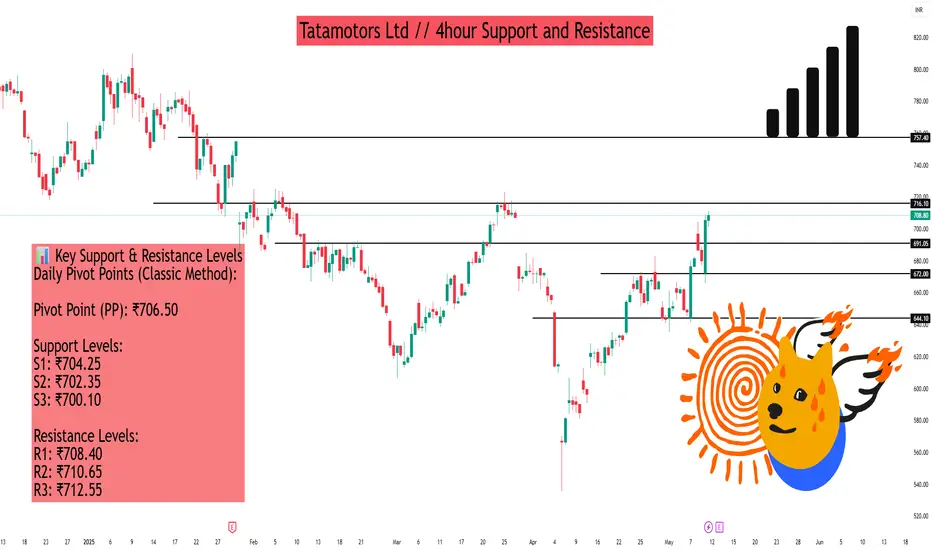
Tatamotors Ltd // 4hour Support and ResistanceAs of May 9, 2025, Tata Motors Ltd. (NSE: TATAMOTORS) closed at ₹736.10. While specific 4-hour support and resistance levels are not directly available, we can infer key levels based on daily and weekly pivot points, which are often utilized by traders for short-term analysis.
📊 Key Support & Resistance Levels
Daily Pivot Points (Classic Method):
Pivot Point (PP): ₹706.50
Support Levels:
S1: ₹704.25
S2: ₹702.35
S3: ₹700.10
Resistance Levels:
R1: ₹708.40
R2: ₹710.65
R3: ₹712.55
Weekly Pivot Points (Classic Method):
Pivot Point (PP): ₹732.62
Support Levels:
S1: ₹686.88
S2: ₹662.77
S3: ₹617.03
Resistance Levels:
R1: ₹756.73
R2: ₹802.47
🔍 Observations
The current price of ₹736.10 is above the daily pivot point, suggesting a bullish short-term trend.
Immediate resistance is observed near ₹740.17 (Daily R2), while support is around ₹724.33
On a weekly scale, the stock is trading near the pivot point of ₹732.62, indicating potential consolidation.
Crypto
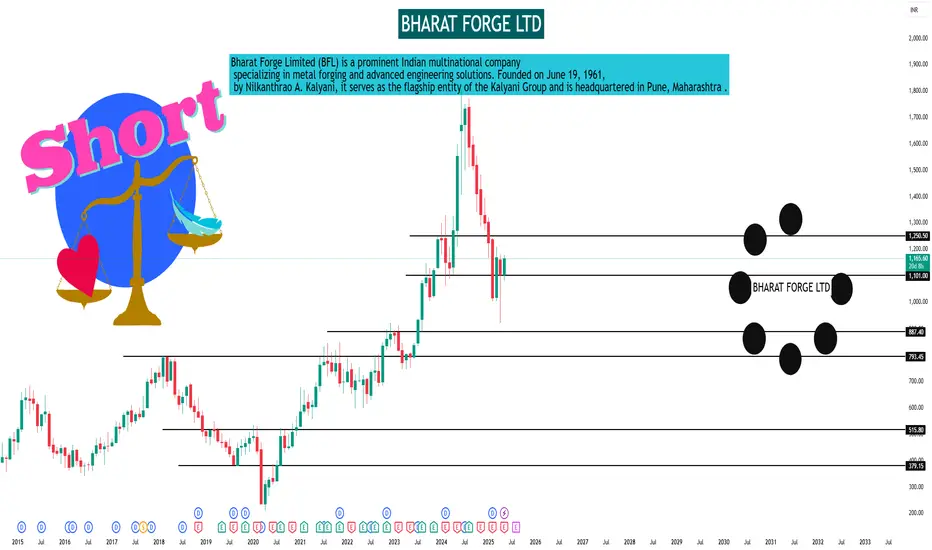
BHARAT FORGE LTDAs of May 9, 2025, Bharat Forge Ltd. (NSE: BHARATFORG) closed at ₹1,165.60. Below are the key monthly support and resistance levels based on various technical analyses:
📊 Monthly Support & Resistance Levels
Standard Pivot Points
Pivot Point: ₹1,215.77
Support Levels:
S1: ₹1,067.43
S2: ₹955.87
S3: ₹807.53
Resistance Levels:
R1: ₹1,327.33
R2: ₹1,475.67
Fibonacci Levels
Pivot Point: ₹1,067.43
Support Levels:
S1: ₹968.15
S2: ₹906.82
S3: ₹807.53
Resistance Levels:
R1: ₹1,166.72
R2: ₹1,228.05
R3: ₹1,327.33
Camarilla Levels
Pivot Point: ₹1,067.43
Support Levels:
S1: ₹1,080.38
S2: ₹1,056.55
S3: ₹1,032.73
Resistance Levels:
R1: ₹1,128.02
R2: ₹1,151.85
R3: ₹1,175.67
Woodie's Levels
Pivot Point: ₹1,076.62
Support Levels:
S1: ₹974.25
S2: ₹816.72
Resistance Levels:
R1: ₹1,234.15
R2: ₹1,336.52
Demark Levels
Pivot Point: ₹1,141.60
Support Level:
S1: ₹881.70
🔍 Observations
The stock is currently trading near the Fibonacci R1 level of ₹1,166.72, indicating potential resistance.
The Camarilla R2 level at ₹1,151.85 has recently been surpassed, suggesting bullish momentum.
Key support levels to monitor include ₹1,067.43 (Standard S1) and ₹1,056.55 (Camarilla S2).
NIFTY BANK INDEX Nifty Bank Index – 15-Minute Timeframe (As of May 9, 2025)
📌 Intraday Support & Resistance (15-min Chart):
🔻 Support Levels:
53,500 – Strong intraday support; multiple bounces seen here
53,200 – Minor support from morning session
52,900 – Gap-fill zone and previous demand area
🔺 Resistance Levels:
53,850 – VWAP + supply rejection area
54,200 – Key resistance from early session high
54,500 – Major barrier; breakdown retest level
📉 Intraday View: Trend remains weak below 54,200; bulls need a reclaim above 54,500 for momentum. Short-term scalpers should watch price action around VWAP (near 53,850).

MACD Trading ( Moving Average Convergence/Divergence) The Moving Average Convergence/Divergence indicator is a momentum oscillator primarily used to trade trends. Although it is an oscillator, it is not typically used to identify over bought or oversold conditions. It appears on the chart as two lines which oscillate without boundaries.

How to Trade ? (Basic to Advance)Open a Demat account. The first step is to open a Demat account, which serves as a digital repository for your stocks. ...
Understand stock terms. ...
Bids and asks. ...
Fundamental and technical knowledge of stocks. ...
Learn to set stop loss orders. ...
Seek expert advice. ...
Start with safer stocks.

Option Trading Options trading gives you the right or obligation to buy or sell a specific security on or by a specific date at a specific price. An option is a contract that's linked to an underlying asset, such as a stock or another security.

Advanced Trading part 1Advanced trading encompasses a range of sophisticated techniques, strategies, and tools used by experienced traders to make informed decisions, manage risk, and capitalize on market opportunities. It involves a deeper understanding of market dynamics, technical analysis, and risk management principles, often utilizing complex instruments like options and futures.

Bitcoin At Big Resistance level so What Next?#BTC/USDT Update – Price at Critical Resistance
The chart structure remains unchanged from our previous update.
🔸 After entry, price dipped ~5% below our zone, but has now printed a strong bullish candle, signaling potential upside momentum.
🔸 However, Bitcoin is currently trading at the upper boundary of the ascending channel, acting as resistance.
Key Level to Watch:
If the HTF candle closes above $99,500, it will signal strength, and I’ll consider closing short positions and initiating fresh long setups.
Important Note:
The current pattern resembles a liquidity trap, not a clean bullish continuation. That’s why I remain cautious.
✅ Plan:
🔸 Wait for confirmation > $99,500
🔸 Use tight stop-loss – no blind trades.
Stay sharp, monitor price action closely.

Institutional Trading part 4Institutional traders buy and sell securities for accounts they manage for a group or institution. Retail traders buy or sell securities for personal accounts. Institutional traders usually trade larger sizes and can trade more exotic products.

Support and ResistanceSupport is a price point below the current market price that indicate buying interest. Resistance is a price point above the current market price that indicate selling interest.

Advanced Trading part 2Advanced trading strategies usually involve multiple technical indicators and more complicated instruments, such as options and futures.

Advanced TradingAdvanced trading strategies usually involve multiple technical indicators and more complicated instruments, such as options and futures.

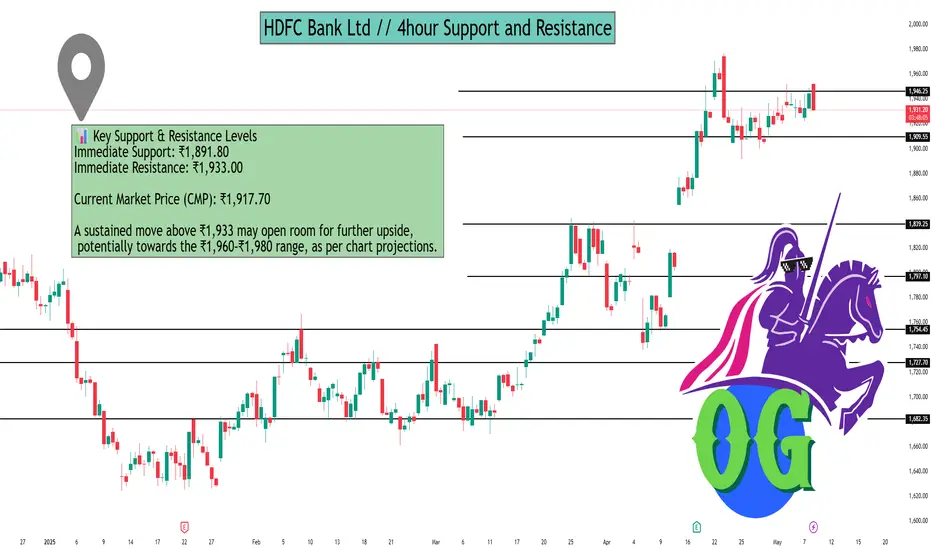
HDFC Bank Ltd // 4hour Support and ResistanceAs of May 8, 2025, here are the key 4-hour support and resistance levels for HDFC Bank Ltd (NSE: HDFCBANK), based on recent technical analyses and pivot point calculations:
📊 Key Support & Resistance Levels
Immediate Support: ₹1,891.80
Immediate Resistance: ₹1,933.00
Current Market Price (CMP): ₹1,917.70
A sustained move above ₹1,933 may open room for further upside, potentially towards the ₹1,960–₹1,980 range, as per chart projections.
🔁 Pivot Point Levels (Daily)
Pivot Type Support Levels Resistance Levels
Classic S1: ₹1,938.90S2: ₹1,929.10S3: ₹1,912.60 R1: ₹1,965.20R2: ₹1,981.70R3: ₹1,991.50
Fibonacci S1: ₹1,938.90S2: ₹1,928.85S3: ₹1,912.60 R1: ₹1,955.15R2: ₹1,965.20R3: ₹1,981.70
Camarilla S1: ₹1,943.19S2: ₹1,940.78S3: ₹1,938.37 R1: ₹1,948.01R2: ₹1,950.42R3: ₹1,952.83
Woodie S1: ₹1,940.57S2: ₹1,932.45 R1: ₹1,958.75R2: ₹1,966.87
Demark S1: ₹1,934.00 R1: ₹1,960.30
📈 Technical Indicators
Relative Strength Index (RSI): 72.46 (Strong Uptrend)
Stochastic RSI: 0.92 (Strong Uptrend)
Commodity Channel Index (CCI): 130.18 (Strong Uptrend)
Money Flow Index (MFI): 86.61 (Strong Uptrend)
These indicators suggest a strong bullish momentum, indicating potential upward movement if buying interest continues.
📌 Trading Insights
Bullish Scenario: A decisive breakout above ₹1,933 could lead to a rally towards ₹1,960–₹1,980.
Bearish Scenario: If the price falls below ₹1,891.80, it may test lower support levels around ₹1,870.69.
Neutral Zone: The area between ₹1,891.80 and ₹1,933 is critical; price action within this range may indicate consolidation before the next significant move.
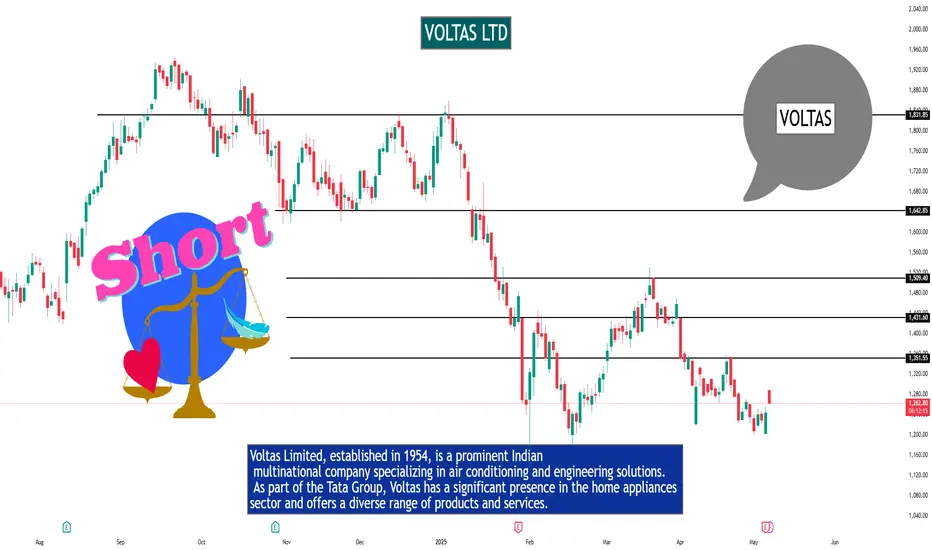
VOLTAS LTDVoltas India Ltd view for Intraday 8th May #VOLTAS
Resistance 1260 Watching above 1263 for upside movement...
Support area 1230 Below 1240 ignoring upside momentum for intraday
Watching below 1228 for downside movement...
Above 1240 ignoring downside move for intraday
Charts for Educational purposes only.
Please follow strict stop loss and risk reward if you follow the level.
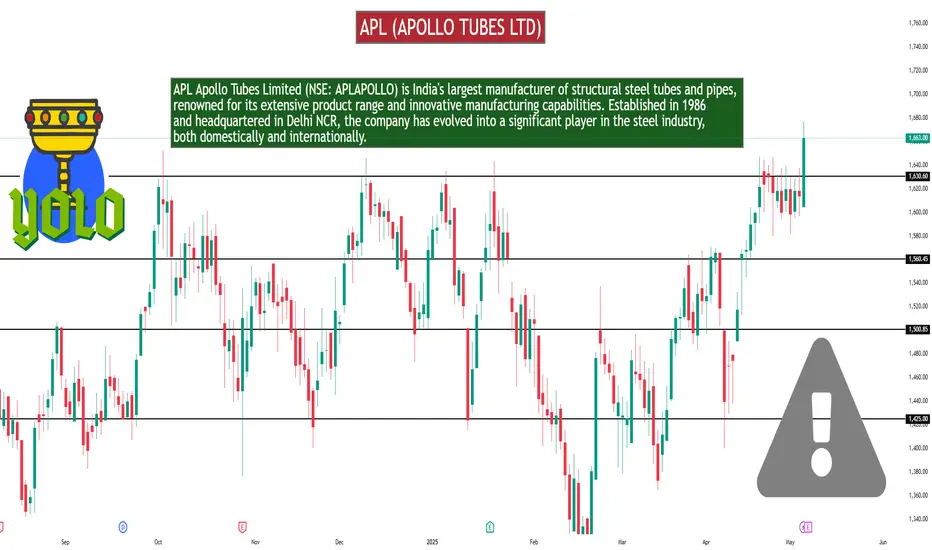
APL (APOLLO TUBES LTD)As of May 6, 2025, here are the key intraday support and resistance levels for APL Apollo Tubes Ltd (NSE: APLAPOLLO):
📊 Intraday Support & Resistance Levels
Standard Pivot Points:
Support Levels:
S1: ₹1614.17
S2: ₹1599.23
S3: ₹1580.17
Resistance Levels:
R1: ₹1648.17
R2: ₹1667.23
R3: ₹1682.17
Fibonacci Pivot Points:
Support Levels:
S1: ₹1614.17
S2: ₹1601.18
S3: ₹1593.15
Resistance Levels:
R1: ₹1635.18
R2: ₹1648.17
R3: ₹1656.20
Camarilla Pivot Points:
Support Levels:
S1: ₹1615.18
S2: ₹1612.07
S3: ₹1608.95
Resistance Levels:
R1: ₹1621.42
R2: ₹1624.53
R3: ₹1627.65
The current price of APL Apollo Tubes Ltd is trading above the Camarilla R3 and Fibonacci R1 levels, indicating strong bullish momentum. Traders may consider these levels for potential entry or exit points, keeping in mind that surpassing the R3 levels could suggest overbought conditions, while approaching S1 or S2 levels might indicate potential support zones.
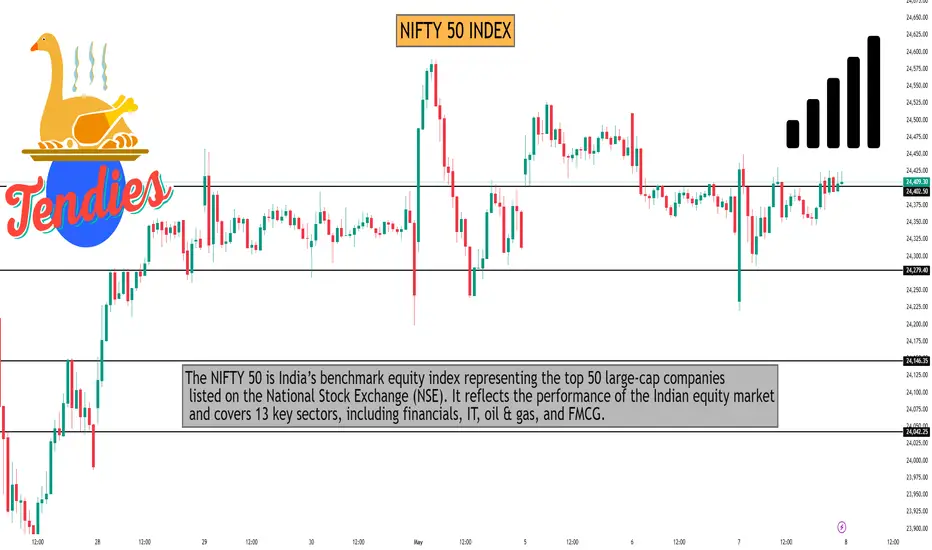
NIFTY 50 INDEXNifty Expiry Day Game Plan (15-Min Chart)
Key Level: 24,300 - Strong Support
Bullish Scenario (High Probability)
✦ If market holds above 24,300:
Look for bullish candles or retest bounce.
Target 1: 24,500
Target 2: 24,800 (in upcoming sessions)
X Bearish Scenario (Only if Breakdown)
✰ If price breaks & closes below 24,300 with volume:With followed Candle Need to Sustain
Target: 24,110
Why this Zone -Prior selling seen below this zone
us Federal Reserve leaves interest rates unchanged, remains at 4.25% - 4.50%.
But warns of potential slowdown in achieving Federal Reserve's objectives.
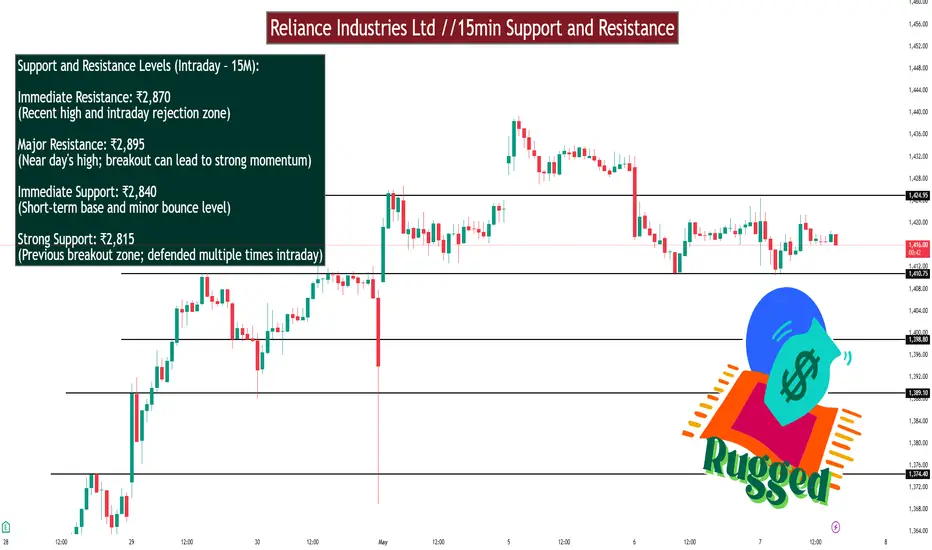
Reliance Industries Ltd //15min Support and ResistanceRELIANCE INDUSTRIES LTD – 15-Minute Chart Support & Resistance
Support and Resistance Levels (Intraday – 15M):
Immediate Resistance: ₹2,870
(Recent high and intraday rejection zone)
Major Resistance: ₹2,895
(Near day's high; breakout can lead to strong momentum)
Immediate Support: ₹2,840
(Short-term base and minor bounce level)
Strong Support: ₹2,815
(Previous breakout zone; defended multiple times intraday)
Trend Insight:
RELIANCE is trading in a rising channel, with buyers stepping in around ₹2,840. Sustained move above ₹2,870 may trigger an upside breakout.
RSI DivergenceRSI: Divergence appears when the RSI's highs or lows diverge from price. For example, if the price makes new lows but the RSI bottoms at higher levels, it signals bullish divergence; if the price makes new highs but the RSI peaks at lower levels, it signals bearish divergence.

MACD (Moving Average Convergence/Divergence )The Moving Average Convergence/Divergence (MACD) is a technical analysis indicator used to analyze price trends and momentum. It's calculated by subtracting a longer-term exponential moving average (EMA) from a shorter-term EMA. The resulting MACD line, along with a signal line (an EMA of the MACD line) and a histogram (the difference between the MACD and signal lines), helps traders identify potential buy and sell signals, as well as changes in the strength and direction of a trend.

Financial Markets A financial market is a market in which people trade financial securities and derivatives at low transaction costs. Some of the securities include stocks and bonds, raw materials and precious metals, which are known in the financial markets as commodities.

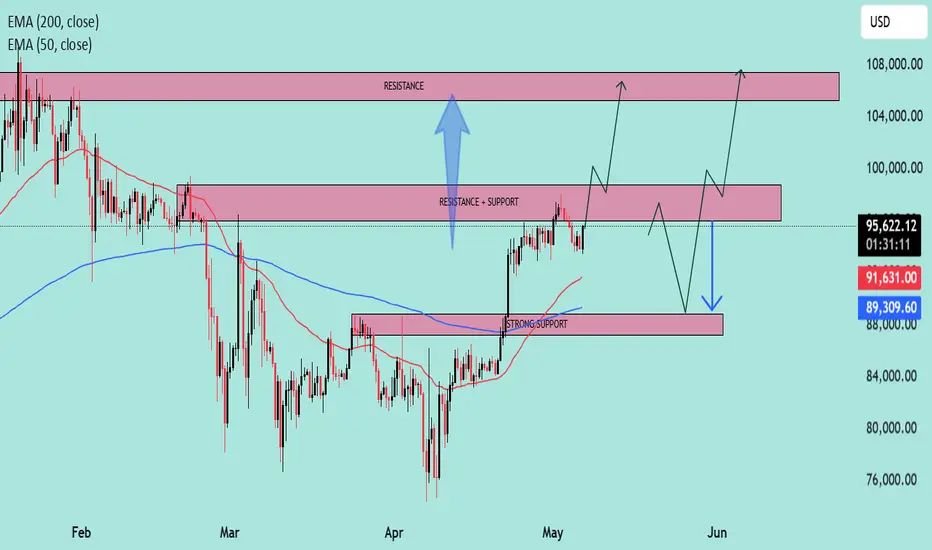
BTC at Key Inflection Zone – Breakout or Rejection Ahead?Asset: BTC/USD
Timeframe: 4H or Daily (based on visual pattern structure)
As of: May 6, 2025
Indicators:
50 EMA (Red): $91,615.79
200 EMA (Blue): $89,305.75
Key Technical Zones:
🔴 Resistance Zone: ~$104,000 – $108,000
This area has historically acted as a major supply zone.
Price has been rejected from this level multiple times, indicating strong selling pressure.
🔁 Flip Zone (Resistance turned Support/Support turned Resistance): ~$95,500 – $100,000
The current price ($95,234.23) is testing this zone from below.
A confirmed break and hold above could signal continuation toward the higher resistance.
🟢 Strong Support Zone: ~$88,000 – $91,000
Confluence of 50 EMA and 200 EMA adds strength to this demand zone.
Previous breakout level and accumulation area.
EMA Outlook:
50 EMA > 200 EMA: Short-term bullish crossover is active, indicating bullish momentum.
Both EMAs are sloping upward slightly, suggesting trend strengthening.
Price is currently above both EMAs, which acts as dynamic support.
Potential Scenarios:
✅ Bullish Scenario:
If price reclaims the $95,500–$100,000 resistance-turned-support zone:
Expect upward momentum to continue.
Target: $104,000–$108,000 zone.
Break of $108K could lead to a macro bull continuation.
⚠️ Bearish Scenario:
If price rejects the current zone and fails to hold above the $91,000 support:
Look for retest of $88,000–$89,000 area (confluence with EMAs).
Breakdown below that zone would invalidate bullish structure and signal potential deeper correction.
Summary:
Bias: Bullish above $91K, Neutral between FWB:88K –$91K, Bearish below $88K.
Key Confirmation Needed: Daily close above $100,000 for strong bullish continuation.
Risk Management: Watch for fakeouts within the $95K–$100K range due to past volatility.
Option Trading AnalysisRelative Strength Index (RSI) The relative strength index (RSI) is one of the most commonly used indicators. ...
Bollinger Bands. ...
Intraday Momentum Index (IMI) ...
Money Flow Index (MFI) ...
Put-Call Ratio (PCR) Indicator. ...
Open Interest (OI)

Institution Trading part 4Institutional trading consists of the purchase and sale of financial assets by institutions through their traders. This definition of institutional trading applies to institutional equity trading, institutional stock trading, institutional options trading - any subcategory.
