Option Trading AnalysisAn option is a contract that represents the right to buy or sell a financial product at an agreed-upon price for a specific period of time. You can typically buy and sell an options contract at any time before expiration. Options are available on numerous financial products, including equities, indices, and ETFs.
Crypto

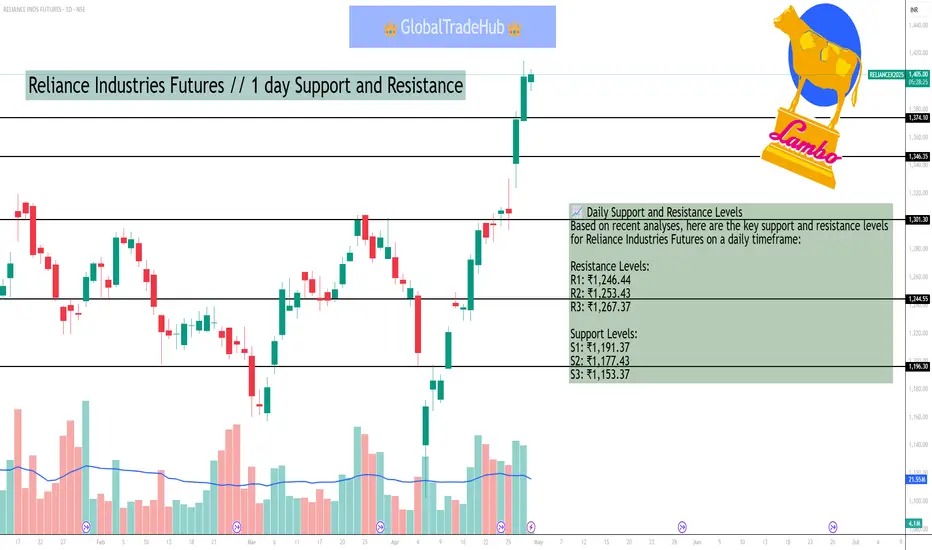
Reliance Industries Futures // 1 day Support and ResistanceAs of April 30, 2025, the Reliance Industries Futures (NSE: RELIANCE) closed at ₹1,235.80, up 0.16% from the previous close of ₹1,233.80. The futures market indicates a slight bullish sentiment, with open interest increasing by 4.82%, suggesting that traders are holding onto long positions.
📈 Daily Support and Resistance Levels
Based on recent analyses, here are the key support and resistance levels for Reliance Industries Futures on a daily timeframe:
Resistance Levels:
R1: ₹1,246.44
R2: ₹1,253.43
R3: ₹1,267.37
Support Levels:
S1: ₹1,191.37
S2: ₹1,177.43
S3: ₹1,153.37
These levels are derived from classic pivot point calculations and can act as potential entry, target, and stop-loss levels for intraday traders.
📊 Technical Indicators
Futures Price: ₹1,243.90
Pivot Point: ₹1,246.98
Support Levels:
S1: ₹1,233.12
S2: ₹1,222.33
S3: ₹1,208.47
Resistance Levels:
R1: ₹1,257.77
R2: ₹1,271.63
R3: ₹1,282.42
These levels are calculated based on the futures price and can provide insights into potential price movements.
🧭 Trading Strategy
Bullish Scenario: If Reliance Industries Futures breaks above ₹1,246.44, it could signal a continuation of the upward trend, with potential targets at ₹1,253.43 and ₹1,267.37.
Bearish Scenario: A decline below ₹1,191.37 may indicate a bearish trend, with support levels at ₹1,177.43 and ₹1,153.37.
Traders should monitor these levels closely and adjust their strategies accordingly.
Please note that these levels are subject to change based on market dynamics and should be used in conjunction with other technical analysis tools for informed decision-making.
Nifty 50 //2hour Support and ResistanceAs of April 30, 2025, at 9:45 AM IST, the Nifty 50 index is trading at approximately ₹24,100. Based on recent analyses and technical indicators, here are the key support and resistance levels for the Nifty 50 on a 2-hour timeframe:
📈 Key Support Levels
S1: ₹23,800 – A significant support level where buying interest may emerge.
S2: ₹23,500 – A crucial support zone; breaching this could indicate further downside potential.
S3: ₹23,200 – A critical support level; if broken, it may lead to a more substantial decline.
📊 Key Resistance Levels
R1: ₹24,460 – Immediate resistance; a breakout above this level could signal bullish momentum.
R2: ₹24,550 – A strong resistance zone; surpassing this could lead to further gains.
R3: ₹24,800 – A significant resistance level; if breached, it may indicate a continuation of the uptrend.
📌 Technical Indicators
Relative Strength Index (RSI): Currently at 41.51, indicating neutral momentum.
Moving Averages: The index is trading above its 200-day Simple Moving Average (SMA) of ₹23,780.57, suggesting a long-term bullish trend.
🧭 Trading Strategy
Given the current levels:
Bullish Scenario: A breakout above ₹24,460 could lead to a rally towards ₹24,800.
Bearish Scenario: A decline below ₹23,500 may indicate a move towards ₹23,200.
Traders should monitor these levels closely and adjust their strategies accordingly.
Please note that these levels are subject to change based on market dynamics. It's advisable to use them in conjunction with other technical analysis tools and indicators.

Nifty Financial Services Index//15min Support and ResistanceAs of April 30, 2025, the Nifty Financial Services Index (FINNIFTY) is exhibiting a bullish trend, with the current price at ₹23,512.80. Technical indicators such as moving averages and pivot points suggest potential support and resistance levels for short-term trading.
📊 Key Support and Resistance Levels
Based on recent analyses, here are the critical levels to monitor:
Resistance Levels:
R1: ₹23,571.52
R2: ₹23,630.23
R3: ₹23,695.77
Support Levels:
S1: ₹23,447.27
S2: ₹23,381.73
S3: ₹23,323.02
These levels are derived from pivot point calculations and are useful for intraday trading strategies.
📈 Technical Indicators
Moving Averages:
The index is trading above its 5-day, 10-day, and 20-day simple and exponential moving averages, indicating a bullish short-term trend.
Pivot Points:
The classic pivot point is at ₹24,264.15, with R1 at ₹24,397.3 and S1 at ₹24,175.85.
🧭 Trading Strategy
Given the current bullish momentum, traders might consider buying near support levels and targeting resistance levels for potential profits. However, it's essential to monitor market conditions closely, as breakouts above resistance levels could lead to further upward movement, while failures to hold support may indicate a reversal.
Please note that these levels are subject to change based on market dynamics and should be used in conjunction with other technical analysis tools for informed decision-making.

Pidilite Industries
PIDILITE Industries is forming a Head and shoulders pattern on 4 Hour Time frame, although the chart is looking bullish and the price is also at a round number
support i.e., 3000, but as this indication is on 4 hour we cannot ignore it.
We will wait for the price to breakdown and let the first 30 min candle close below the neckline and do a retest or give us some confirmation candles.
We will also keep a eye, how price is rejecting from 3000 if it gives us some concrete confluences we will looking for long trades only, trend priority

Engineers India Ltd (EIL)As of April 30, 2025, Engineers India Ltd (EIL) is trading at ₹178.41 on the NSE. Based on the latest technical analysis, here are the key intraday support and resistance levels for EIL:
📊 Intraday Support and Resistance Levels
Pivot Point: ₹180.13
First Support: ₹177.46
Second Support: ₹174.04
Third Support: ₹171.37
First Resistance: ₹183.55
Second Resistance: ₹186.22
Third Resistance: ₹189.64
📈 Technical Indicators
Relative Strength Index (RSI): 37.21 (indicating a potentially oversold condition)
Money Flow Index (MFI): 28.35 (suggesting weak buying pressure)
MACD: -9.01 (indicating a bearish trend)
These levels and indicators suggest that EIL is currently in a bearish phase, with the stock trading below its pivot point and facing resistance at higher levels. Traders may consider monitoring the stock for potential reversal patterns or further breakdowns.
Please note that stock prices and technical levels are subject to change, and it's advisable to consult with a financial advisor or conduct further research before making investment decisions.

Divergence meaningIn the stock market, divergence refers to a situation where the price of an asset moves in the opposite direction of a technical indicator, like an oscillator or momentum indicator. This discrepancy suggests a potential shift in trend momentum or a weakening of the current trend, possibly leading to a reversal.

Option TradingIf you're looking for a simple options trading definition, it goes something like this: Options trading gives you the right or obligation to buy or sell a specific security on or by a specific date at a specific price. An option is a contract that's linked to an underlying asset, such as a stock or another security.

Option and Database TradingIn financial markets, options trading refers to buying and selling contracts that give the holder the right, but not the obligation, to buy or sell an underlying asset (like a stock, index, or ETF) at a specific price (strike price) within a certain time frame. Database trading, on the other hand, involves the buying and selling of data assets or the rights to use specific datasets, often for financial or commercial purposes.

Basic to Advance in TradingMake profits in intraday.
Stock market concepts and workings explained from very basic level.
Learn powerful day trading strategies.
Learn a step by step approach of how to trade in intraday.
Trend Following (Wealth Generation)
Learn the art of minimizing the risk and maximizing the return.

Explanation of RSIThe Relative Strength Index (RSI) is a momentum indicator used in technical analysis to assess the speed and magnitude of price changes. It helps traders identify potential overbought and oversold conditions in a financial instrument, suggesting when an asset might be nearing a trend reversal. RSI values range from 0 to 100, with readings below 30 often indicating oversold conditions and readings above 70 suggesting overbought conditions.

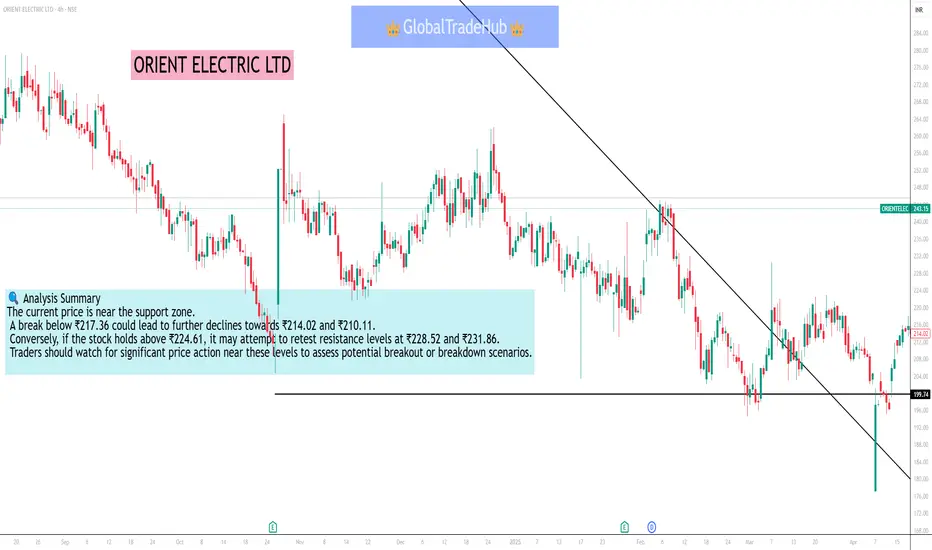
Orient Electric Ltd Orient Electric Ltd :-
🔹 Support Levels
S1: ₹217.36
S2: ₹214.02
S3: ₹210.11
🔹 Resistance Levels
R1: ₹224.61
R2: ₹228.52
R3: ₹231.86
These levels are derived from pivot point calculations and are widely used by traders to identify potential reversal points or breakout zones.
📊 Technical Indicators
Relative Strength Index (RSI): 57.51 (Neutral)
Average True Range (ATR): 11.34 (Indicates moderate volatility)
Moving Averages: The stock is trading below its 50-day, 100-day, and 200-day moving averages, suggesting a bearish trend.
🔍 Analysis Summary
The current price is near the support zone. A break below ₹217.36 could lead to further declines towards ₹214.02 and ₹210.11. Conversely, if the stock holds above ₹224.61, it may attempt to retest resistance levels at ₹228.52 and ₹231.86. Traders should watch for significant price action near these levels to assess potential breakout or breakdown scenarios.
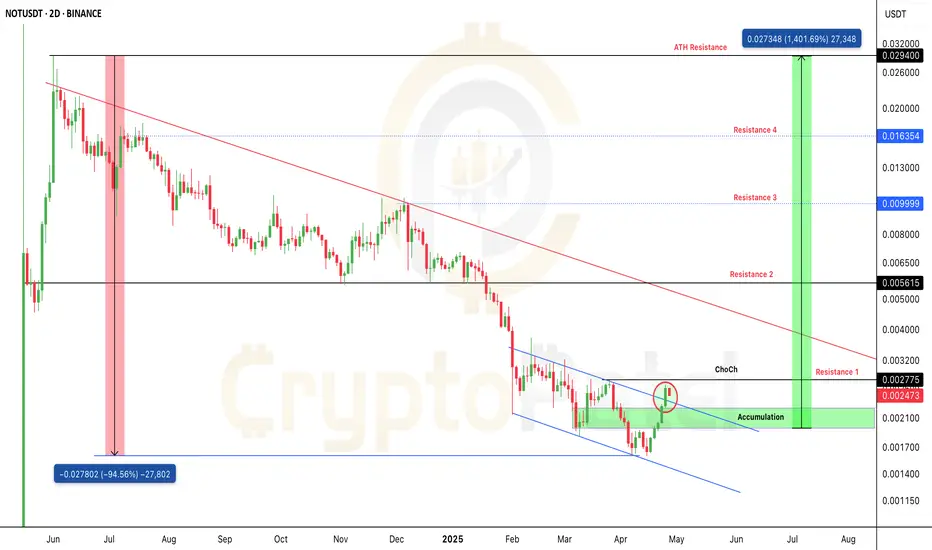
$NOT: Bottomed Out, Breakout Confirmed — Bulls Getting Stronger!GETTEX:NOT : Bottomed Out, Breakout Confirmed — Bulls Getting Stronger! Is This the Last Chance Before $0.03 and New ATH? 🚀
🔰 Current Status:
GETTEX:NOT has corrected -92% from its ATH and recently showed a strong bounce from the bottom, accompanied by a surge in volume.
🔰 Structure Analysis:
▪️ Price is currently forming Lower Lows (LL) and Lower Highs (LH).
▪️ A Change of Character (ChoCh) is identified around $0.0028.
➔ A breakout and candle close above $0.0028 would confirm a major trend reversal.
🔰 Pattern Breakout:
The price has also broken out from a falling wedge pattern, indicating that bullish momentum is building up.
🔰 Accumulation Zone:
Key accumulation area: $0.0022–$0.0019.
🔰 Targets:
Immediate resistance zones will act as the first targets post-breakout.
Major rally potential toward a New ATH if $0.0028 flips into support.
🔰 Risk Management:
Stop Loss suggested at: $0.001590 (below previous support structure).
Key Question:
Can GETTEX:NOT hit $0.03 in this altseason?
If ChoCh breakout and resistance flip are confirmed, $0.03+ becomes a highly probable target during strong altseason momentum.
DYOR — Trade Safe.
RSI DivergenceRSI: Divergence appears when the RSI's highs or lows diverge from price. For example, if the price makes new lows but the RSI bottoms at higher levels, it signals bullish divergence; if the price makes new highs but the RSI peaks at lower levels, it signals bearish divergence.

Technical class 1In trading, "technical" refers to the practice of analyzing historical price and volume data to identify patterns and predict future price movements. This approach, called technical analysis, is a way to evaluate securities and forecast their behavior based on charts and statistical data.

Database Trading part 3InfluxDB is a high-performance, purpose-built time-series database designed for real-time analytics. It boasts low-latency writes, efficient storage, and a powerful query engine tailored for event-driven systems like algorithmic trading.

Option and Database TradingOption type: The options chain segregates call options, which allow you to buy TIL shares, and put options, which grant you the right to sell them. Bid and ask prices: Each option contract at a specific strike price and expiration date comes with bid and ask prices. For example, a call option with a strike price of Rs.

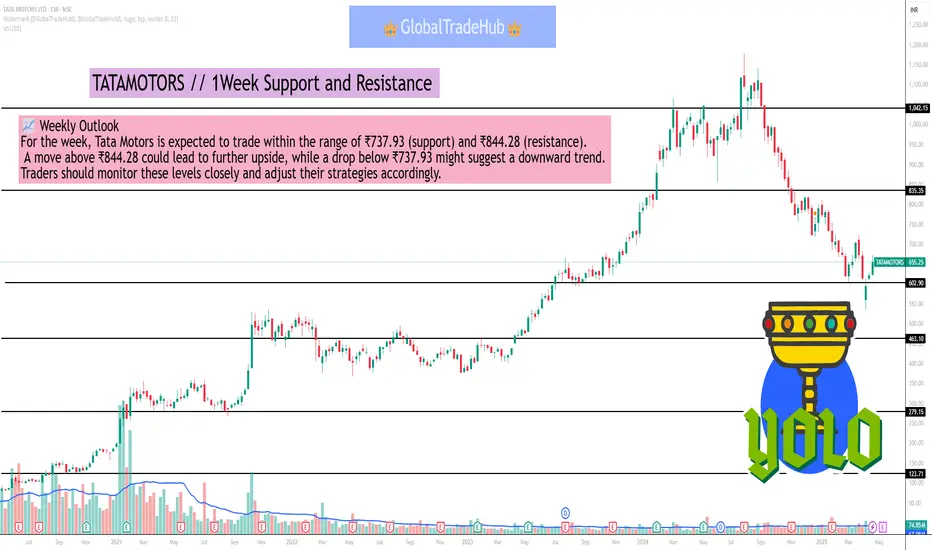
TATAMOTORS // 1Week Support and Resistance As of the latest available data, here are the key support and resistance levels for Tata Motors Ltd. (TATAMOTORS) for the upcoming week:
📊 Weekly Support and Resistance Levels
Type Level Value (₹)
Support S1 773.38
S2 756.47
S3 737.93
Resistance R1 808.83
R2 827.37
R3 844.28
These levels are derived from technical analysis and serve as potential entry, exit, or stop-loss points for traders. A breach below the support levels could indicate a bearish trend, while a breakout above the resistance levels may signal a bullish move.
🔍 Technical Indicators Overview
RSI (14): 43.38 — Indicates neutral momentum.
MACD (12,26): 0 — Suggests a neutral trend.
Moving Averages:
20-day SMA: 655.61 — Slightly below current price, indicating a potential short-term downtrend.
50-day SMA: 655.34 — Aligns with the 20-day SMA, reinforcing the neutral to bearish outlook.
200-day SMA: 655.93 — Further confirms the downtrend.
📈 Weekly Outlook
For the week, Tata Motors is expected to trade within the range of ₹737.93 (support) and ₹844.28 (resistance). A move above ₹844.28 could lead to further upside, while a drop below ₹737.93 might suggest a downward trend. Traders should monitor these levels closely and adjust their strategies accordingly.
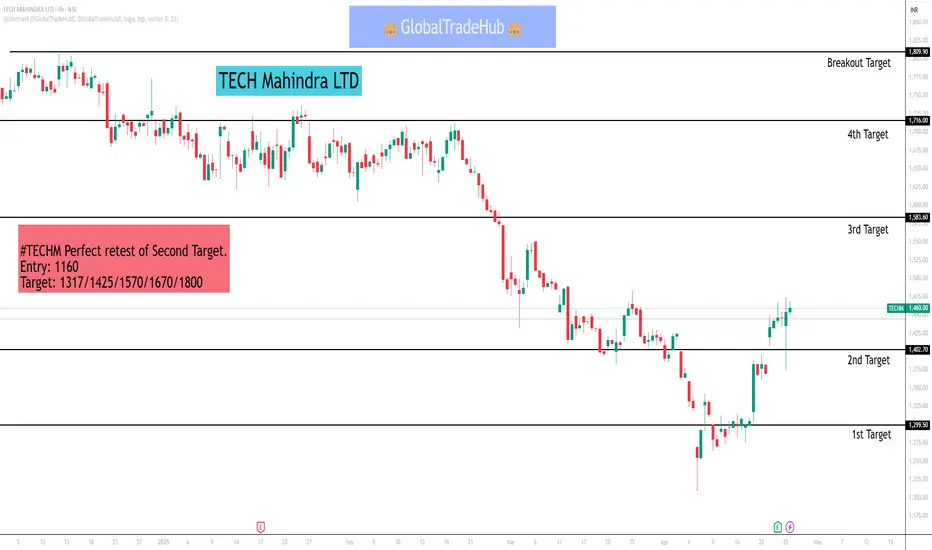
TECH Mahindra LTD
#TECHM Perfect retest of Second Target.
Entry: 1160
Target: 1317/1425/1570/1670/1800
Here are the key 4-hour support and resistance levels for Tech Mahindra Ltd. (TECHM) based on recent technical data:
🔹 4-Hour Support Levels
S1: ₹1,589.75
S2: ₹1,575.45
S3: ₹1,554.75
If the price falls below ₹1,589.75, the next support levels to watch are ₹1,575.45 and ₹1,554.75.
🔸 4-Hour Resistance Levels
R1: ₹1,624.75
R2: ₹1,645.45
R3: ₹1,659.75
If the price rises above ₹1,624.75, the next resistance levels are ₹1,645.45 and ₹1,659.75.
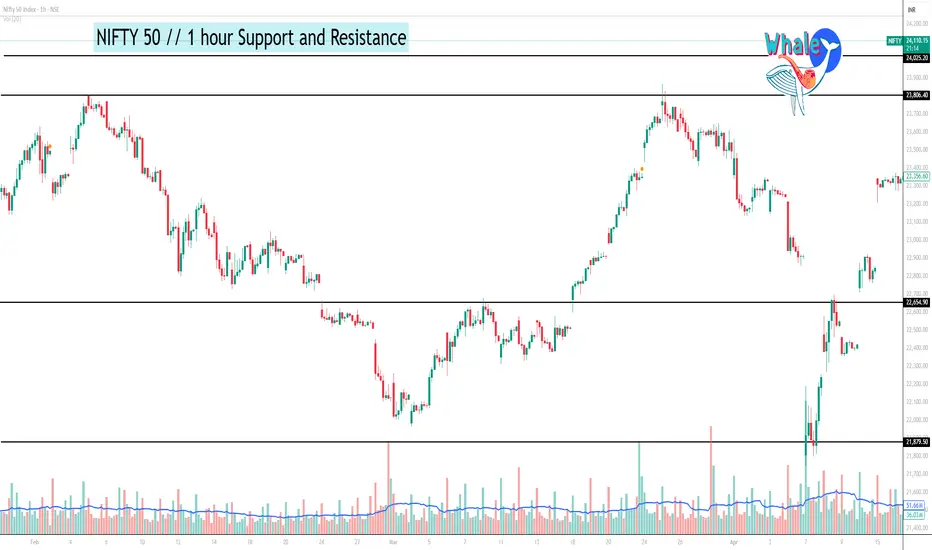
NIFTY 50 1 hour support and resistanceNifty Update
Current Price: 24,150
Nifty crossed 24,300, hitting a high of 24,365 - same as the day before yesterday's open.
Yesterday, it retested this key resistance but failed to sustain.
If Nifty reclaims and sustains above 24,300, it may attempt to break 24,365.
A breakout above that level can lead to an up move towards 24,442-24550.
Key Levels:
Support: 24,100-24000
Resistance: 24,300
#Nifty50 #StockMarket #NSE #TechnicalAnalysis
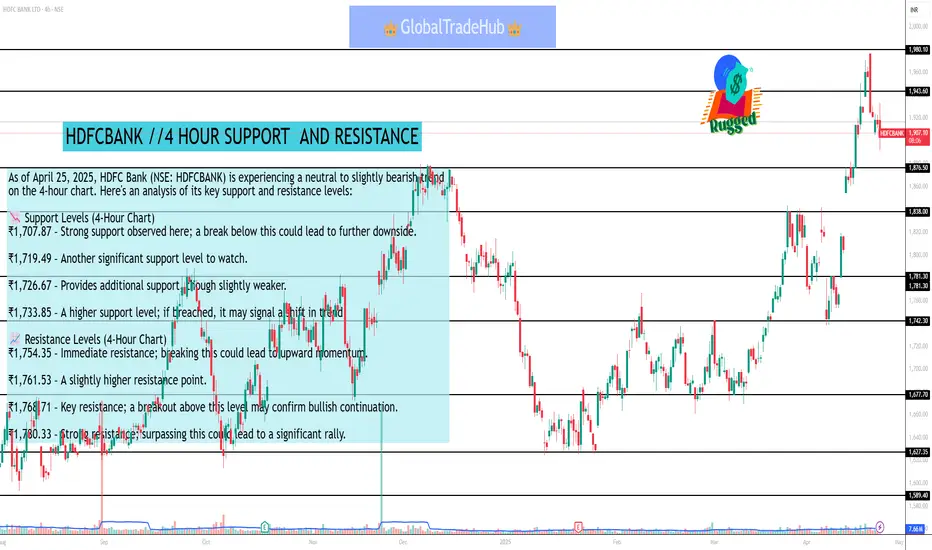
HDFCBANK //4 HOUR SUPPORT AND RESISTANCEAs of April 25, 2025, HDFC Bank (NSE: HDFCBANK) is experiencing a neutral to slightly bearish trend on the 4-hour chart. Here's an analysis of its key support and resistance levels:
📉 Support Levels (4-Hour Chart)
₹1,707.87 – Strong support observed here; a break below this could lead to further downside.
₹1,719.49 – Another significant support level to watch.
₹1,726.67 – Provides additional support, though slightly weaker.
₹1,733.85 – A higher support level; if breached, it may signal a shift in trend.
📈 Resistance Levels (4-Hour Chart)
₹1,754.35 – Immediate resistance; breaking this could lead to upward momentum.
₹1,761.53 – A slightly higher resistance point.
₹1,768.71 – Key resistance; a breakout above this level may confirm bullish continuation.
₹1,780.33 – Strong resistance; surpassing this could lead to a significant rally.
Option Chain AnalysisAn option chain is a comprehensive list of all available option contracts for a specific underlying asset, typically a stock, index, or commodity. It's organized by strike price and expiration date, displaying both call and put options. Traders use this information to understand market sentiment, develop trading strategies, and manage risk.

Option TradingIn trading, an option is a contract that gives the holder the right, but not the obligation, to buy or sell an underlying asset (like a stock) at a specified price (the strike price) by a certain date (the expiration date). This right is purchased for a premium, and the holder can choose to exercise the option, sell it before expiration, or let it expire worthless.
