STOP SCROLLING: BITCOIN TECHNICAL ALERT (3-Year Support Break)🚨 STOP SCROLLING: BITCOIN TECHNICAL ALERT (3-Year Support Break) 🚨
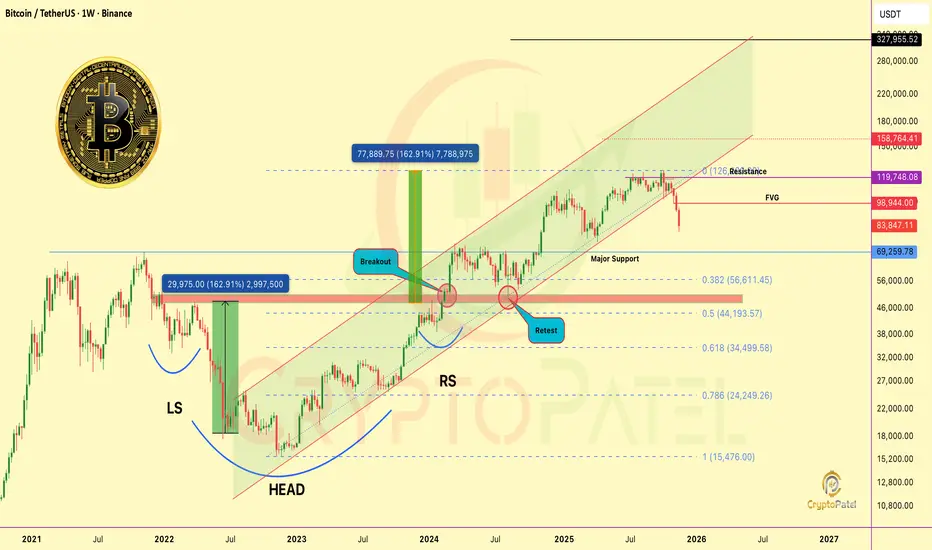
Bitcoin has broken a long-term support channel that’s been respected since 2022. That multi-year channel support was around $108,000 and I warned there to protect capital and trade safe.
Result: Breakdown.
✅ BTC dumped over -25%
✅ Now trading near $83,000
Structure Still Bearish
Trend remains bearish unless BTC reclaims the broken channel.
A Relief bounce is still possible toward: $93,000 / $98,000
But treat that as corrective unless structure flips.
Major Support: $69,000 is a critical level, Last bull-run ATH and strong demand zone. Watch it closely.
If This Channel Break Plays Out Fully…
As a Technical Analyst, I can’t sugar-coat the math.
When a multi-year channel breaks, the natural downside targets usually align with major Fibonacci retracement zones:
Deep Retracement Targets (Bear Case)
0.5 Fib: $44,193 (~60% probability)
0.618 Fib: $34,500 (~30% probability)
0.718 Fib: $24,250 (~10% probability)
These aren’t fantasies. They’re standard TA outcomes after this type of structural failure.
Important: This Is Not Panic
I’m not here to spread fear.
I’m here to state what the chart is objectively signaling.
Markets don’t move on hope, They move on structure, liquidity, and trend mechanics.
If price goes into that 0.5–0.718 Fib zone, it would be painful short-term…
but also a once-in-cycle accumulation window for long-term holders.
CryptoPatel Note:
Believe me, I want BTC at $1M+ in the future.
But wanting isn’t analysis.
My job is to map both paths: bullish and bearish, Before they happen.
Save this post. Mark the levels. Trade safe.
Because when a 3-year support breaks, the market doesn’t whisper, it screams.
NFA & DYOR
Crypto
$SUI JUST ENTERED ITS DO-OR-DIE ZONE CRYPTOCAP:SUI JUST ENTERED ITS DO-OR-DIE ZONE AND THE WEEKLY CHART IS SCREAMING A REVERSAL SETUP
Everyone is panicking at the dump…
But nobody is seeing what actually happened on the HTF:
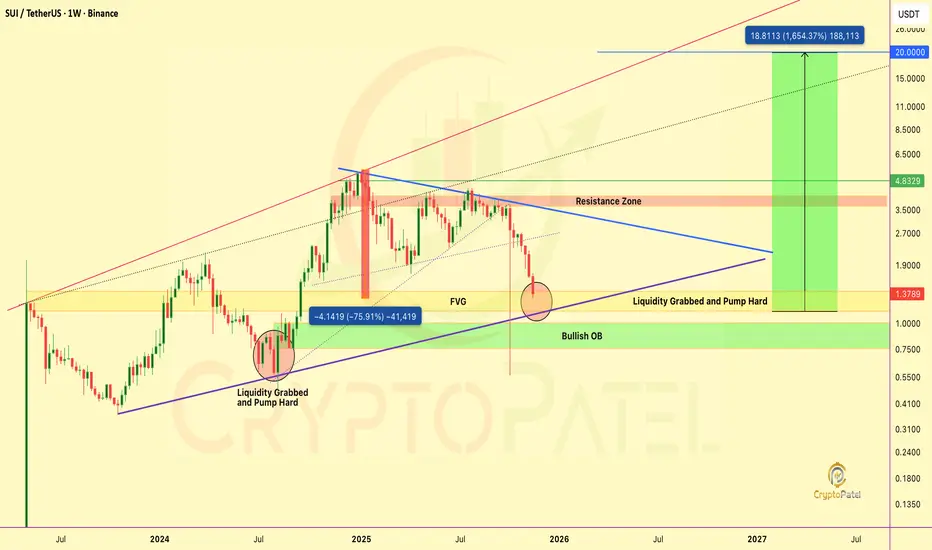
🔹 Massive Liquidity Grab Completed — identical to the 2024 bottom pattern.
🔹 Price nuked directly into FVG + Bullish Order Block.
🔹 Strong rejection wick = smart money accumulation confirmed.
🔹 Macro trendline STILL intact. Structure STILL bullish.
But let’s be Honest:
👉 Market condition is extremely worst right now.
👉 All altcoins dumped hard.
👉 CRYPTOCAP:SUI is –75% down from its Jan 2025 ATH… 10 months of pure bleeding.
Still, the chart is loading something big.
Here’s my IMO approach:
🔹 Accumulation Zone 1: $1.35 – $1.15
🔹 Accumulation Zone 2: $0.90 – $0.75
⭐ Don’t try to buy once.
⭐ No one knows the exact dip.
⭐ Smart way = accumulate slowly inside these zones.
Strong bounce potential sits exactly from the FVG → Bullish OB confluence.
If SUI breaks $4.8 resistance?
Targets: $5 → $10 → $20
IMO one day CRYPTOCAP:SUI will hit $20 easily.
But of course, Not financial advice. DYOR before investing.
BNB/USDT – Bullish Reversal Idea | Demand Zone Reaction📌 Overview
BNB is currently trading at a major higher-timeframe demand zone, showing early signs of accumulation after a sharp sell-off. Price has tapped the demand area multiple times and is holding without breaking structure to the downside.
This setup is based on a potential short-term reversal or a relief bounce.
📍 Analysis
🔹 Demand Zone
Price is reacting from a clean demand zone created by previous strong bullish displacement.
Multiple wicks show buyers defending this level.
🔹 Market Structure
Prior strong downtrend
Price now consolidating at support
Lower timeframe shows slowing bearish momentum
🔹 Entry Logic
A long entry is placed at the reaction zone, anticipating a bounce toward the nearest inefficiency / supply zone above.
🎯 Trade Setup
🟩 Long Position Idea
Entry: At demand zone
Stop-Loss: Below the liquidity wick / zone low
Take-Profit: Previous structure high or the first major supply zone above
This gives a clean R:R setup (as shown in chart).
⚠️ Risk Management
Only risk what you can afford to lose
If the zone breaks cleanly, setup is invalid
Wait for candle confirmation if you want safer entry
📌 Final Thoughts
BNB is at a critical make-or-break level. If buyers hold this zone, a strong bounce is likely. If not, expect continuation lower.
Publishing this to track market reaction and trade execution.

#ETHEREUM Technical Update: $3000 Hit Exactly as Mapped#ETHEREUM Technical Update: $3000 Hit Exactly as Mapped
CRYPTOCAP:ETH has tapped the $3000 zone, exactly as projected when price was breaking down from the $4000 bearish breakdown + retest.
We’re now ~30% down from the short-entry region.
If you shorted, you booked heavy profits.
If you didn’t, at least you avoided longing the top above $4000+
This is where the prime accumulation zone begins.
Key levels to watch:
🔵 $3000: First accumulation zone + bullish OB (Possible bounce reaction from here.)
🔽 Next support: $2400
Major Accumulation Zones:
0.5 FIB: ~$2621
0.618 FIB: ~$2255
If ETH sweeps into these FIB/FVG pockets, that becomes the high-discount, prime long-term accumulation zone.
Macro view unchanged: Long-term Target: $10K–$15K
Stay patient. Stick to structure. Accumulate smart, not emotional.
NFA & DYOR

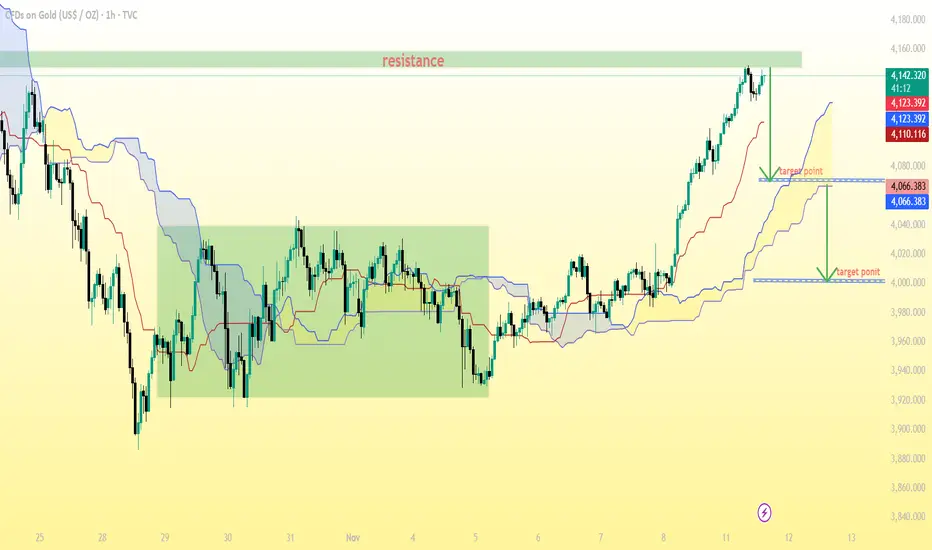
GOLD (XAU/USD) 1-hour chart Pattern..GOLD (XAU/USD) 1-hour chart with Ichimoku Cloud, and my marked resistance and two target points.
Here’s the analysis based on what’s visible:
Current price: Around $4,141 (based on my chart labels).
Resistance zone: Around $4,140 – $4,150, which is where price is currently testing.
Upper target point (minor correction target): Around $4,123 – $4,125.
Lower target point (major correction target): Around $4,066 – $4,070.
📊 Interpretation:
If price fails to break resistance (4,150) and forms rejection candles, it could retrace toward:
Target 1: $4,123 (short-term support)
Target 2: $4,066 (cloud base and major support zone)
If price breaks and holds above 4,150, then the bullish trend can extend further upward, possibly toward $4,180–$4,200.
BTC/USDT Timeframe (4-hour)BTC/USDT Timeframe (4-hour)
Current price: ≈ $105,845
My drawn:
A descending trendline (showing previous resistance)
Ichimoku Cloud, and
Two target points marked with green arrows.
---
🔍 Chart Interpretation
From my image:
Price has broken above the descending trendline.
It’s also moving into/above the Ichimoku Cloud, a sign of a potential trend reversal.
My first target appears around $113,000 – $114,000, which aligns with the upper boundary of the drawn arrow.
The second target (higher arrow) points near $117,000 – $118,000, representing the extended bullish target zone.
---
🎯 Possible Targets Based on my Chart
1. Target 1: $113,000 – $114,000
(Short-term resistance / first profit zone)
2. Target 2: $117,000 – $118,000
(Next key resistance / full breakout target)
---
⚠ Risk Note
Watch for retests near $104,000 – $105,000 (the breakout zone).
If BTC closes back below the trendline or Ichimoku cloud, bullish momentum weakens.

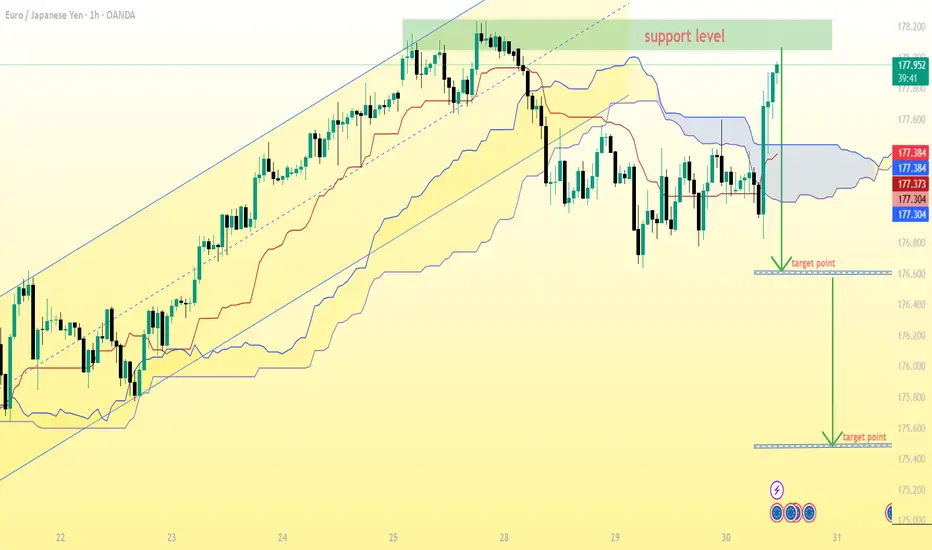
EUR/JPY (1H) chartEUR/JPY (1H) chart, here’s what can be interpreted based on my annotations and price action:
Support level (green zone): around 178.00 – 178.20
Current price: 177.88
Breakdown below cloud: already happened previously, price retested resistance (support turned resistance) and dropped again.
My also drawn two target points below — one short-term and one deeper move.
---
🎯 Target Analysis
From my markings and price structure:
First target (short-term): around 176.40 – 176.50
→ This aligns with my first green arrow and matches a previous minor swing low.
Second target (main target): around 175.20 – 175.30
→ This is the lower arrow, which aligns with the bottom of my previous structure (major support zone).
---
📊 Trade Idea Summary
If my looking at a short setup (since price rejected the resistance zone):
Sell Entry: below 177.70 (confirmation of rejection)
Target 1: 176.40
Target 2: 175.20
Stop-loss: above 178.20 – 178.30 (just above resistance zone)
---
⚖ Risk/Reward (approximate)
If entering at 177.70:
SL: 178.30 (≈ 60 pips risk)
TP1: 176.40 (≈ 130 pips reward)
TP2: 175.20 (≈ 250 pips reward)
➡ R:R = 1:2 to 1:4
---
✅ Conclusion:
My first target is 176.40, and my main target is 175.20.
This setup looks valid if price stays below the 178.00 resistance and cloud confirms bearish momentum.
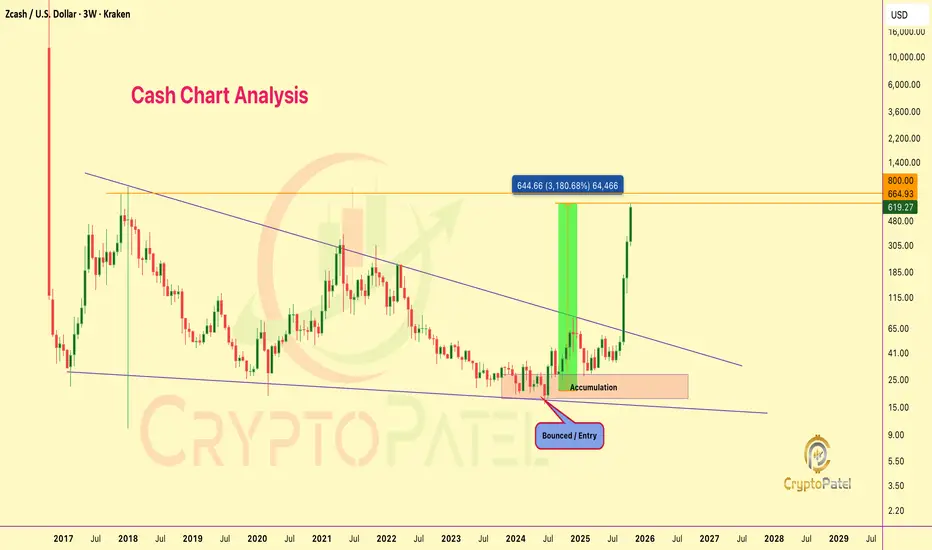
When I called $ZEC at $20, they laughed. Now it’s $662. When I called CRYPTOCAP:ZEC at $20, they laughed. Now it’s $662. Still think I’m crazy?
From our call at $20–$24, CRYPTOCAP:ZEC just went insane: Now at $662 🤯
That’s a massive 3100% GAIN from entry.
I told you legends about that $800 target, and we’re almost there!
Hope you’re counting profits and maybe ordering that new LAMBO already 🏎️
Who believed when I said #Zcash would rise again?
NFA & DYOR
(ETH/USD, 3-hour imeframe...(ETH/USD, 3-hour timeframe, Bitstamp):
The chart clearly shows a descending channel with price breaking below the lower boundary, confirming strong bearish momentum.
The Ichimoku Cloud is fully bearish, and price action is below all major cloud levels — confirming continuation to the downside.
My chart already shows a target point marker at the lower projection level.
📉 Target analysis (based on my chart + structure):
Current Price: ≈ $3,511
Immediate Target (TP1): Around $3,400 (shown near the “target point” on my chart)
Next Target (TP2): Around $3,300 — previous horizontal support & channel extension
Extended Target (TP3): Around $3,180 – $3,200, if bearish momentum accelerates
🔒 Stop-loss (for short trades):
Above $3,650 – $3,700 (upper boundary of current consolidation zone / channel midline)
📈 Summary:
Trend: Bearish continuation
TP1: $3,400
TP2: $3,300
TP3: $3,180
SL: $3,650 – $3,700

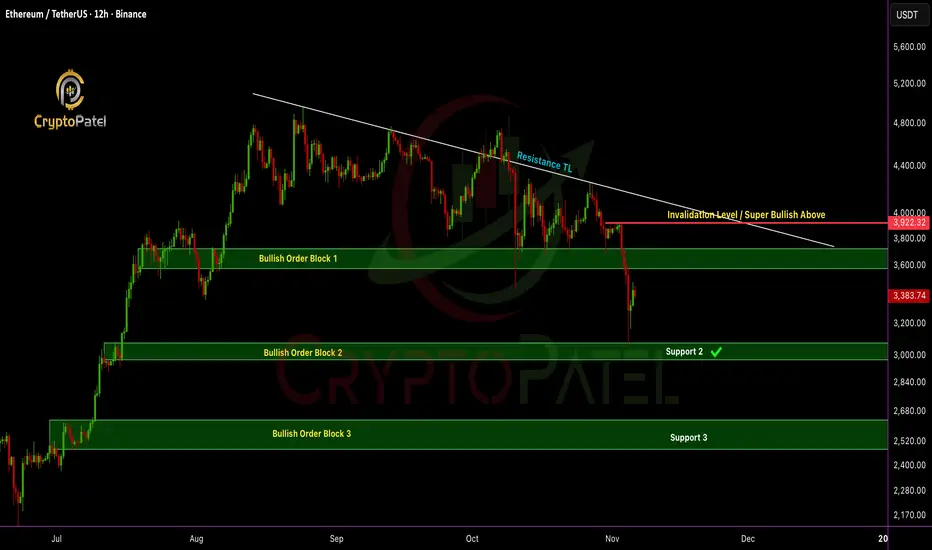
ETH/USDT dumped 20% after my analysisETHEREUM Update: Price just hit the bullish order block at $3,057 and bounced exactly as predicted ✅
Quick recap:
✅ Short-term: I’m bearish below $3,920, next potential leg down $2,500–$2,200 if $3,000 support breaks.
✅ Medium-term: Holding $3,000 support is key, could spark the next bullish wave.
✅ Long-term: Still super bullish & Target remains $10K–$15K ETH
Paper hands panic. Legends load the blood & hold.
Which one are you? 👇
NFA & DYOR
GBP/USD (1-hour) chart...GBP/USD (1-hour) chart:
Price is moving within a descending channel, and currently testing the upper boundary of that channel.
The Ichimoku cloud above the price suggests a bearish bias, as price remains below the cloud.
There’s a projected leg down (green arrow) marked on my chart — pointing toward the lower channel line.
🎯 Likely Target Zone
If the move respects the current channel and the upper rejection holds:
Short-term downside target: around 1.2910–1.2920, aligning with the lower channel trendline and my marked “target point.”
Intermediate resistance: near 1.3040–1.3060 (top of the cloud / channel upper edge).
Summary:
📉 Sell bias below 1.3040
🎯 Target: 1.2910–1.2920
❌ Invalidation: If price breaks above 1.3070 with strong candles (then potential reversal).

BTC First Weekly BB Break Since March: This Changes EverythingFirst Weekly BB Break Since March: This Changes Everything!
Bitcoin is currently testing a key support zone around $104K, forming what appears to be the 5th major support retest in this ongoing bullish cycle.
Historical Pattern Insight:
Each of the previous four support retests (1–4) led to substantial rallies ranging from +70% to +200%, as shown in the green zones.
If the pattern repeats, the next potential upside move (Wave 5) could project CRYPTOCAP:BTC toward the $200K region, marking a ~100% upside from current levels.
New Technical Development:
This week marks Bitcoin’s first breach of the lower Bollinger Band (BB) on the weekly timeframe since March, signaling heightened volatility and potential exhaustion of the current corrective phase.
Bearish Scenario:
A confirmed breakdown below this critical support could trigger a deeper correction toward the $50K area (–55%), similar to previous cycle corrections highlighted in red.
Key Levels to Watch:
🔹 Support: $103K–$100K
🔹 Resistance: $110K, then $135K
🔹 Upside Target: $200K
🔹 Downside Risk: $50K
Indicators:
Bollinger Bands remain squeezed, indicating volatility expansion is near. The weekly mid-band continues to act as dynamic support, but a sustained close below it could shift the bias short-term.
🟩 Bullish Bias remains valid above $100K, invalidated only on a weekly close below support.
🟩 Pattern repetition or deviation here will define Bitcoin’s next macro leg.
NFA & DYOR

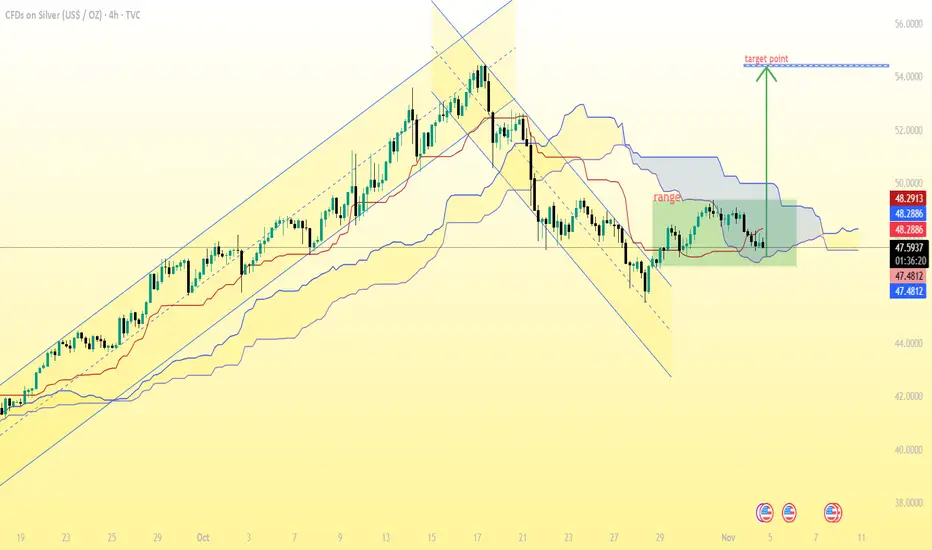
(Silver / USD, 4H timeframe)...(Silver / USD, 4H timeframe):
✅ Analysis Summary:
The price has broken out of a falling channel and is now moving inside a range, just below the Ichimoku cloud.
The projected move (marked on my chart) shows a bullish breakout from the range.
The measured move target from the breakout zone points upward to the $52.15–$52.50 area.
📈 Target Levels:
Immediate resistance: $48.30 – $48.70
Breakout confirmation: Above $49.00
Main bullish target: $52.10 – $52.50
Extended target (if strong momentum): $53.80 – $54.00
📉 Support levels:
$47.50 (near cloud base)
$47.00 (range bottom)
➡ Conclusion:
If Silver sustains above $49.00, the next target is $52.15 – $52.50 as shown in my chart.
If it fails to hold above $47.50, the bullish setup becomes invalid.
L
BTC/USDT (4h timeframe)...BTC/USDT (4h timeframe), I can summarize what’s visible and help interpret my targets:
Current price: Around $107,469
Chart setup: my using Ichimoku Cloud (Kumo) with marked zones:
Resistance level (green zone) around $107,000 – $108,000
Two target points drawn on the chart:
First target point: around $111,350 – $111,500
Second (higher) target point: around $116,500 – $117,000
✅ Summary of target levels visible on my chart:
1. Target 1: ~$111,350
2. Target 2: ~$116,700
These targets are likely based on a breakout above the Ichimoku Cloud and prior resistance zones.

XAU/USD (Gold Spot vs. U.S. Dollar) 1-hour chart XAU/USD (Gold Spot vs. U.S. Dollar) 1-hour chart on TradingView.
Here’s what I can observe:
There is a symmetrical triangle pattern (a type of consolidation pattern) drawn on the chart.
The price appears to be breaking out upwards from the triangle.
There’s an arrow drawn upward with a “target point” marked above current price levels.
To calculate the target from this breakout:
📈 Symmetrical Triangle Target Formula:
Target = Breakout Point ± (Height of the Triangle)
1. Measure the height of the triangle:
From the highest point of the pattern to the lowest point within the triangle.
Approximate values (from the chart):
High ≈ 4,080
Low ≈ 3,940
→ Height ≈ 140 points
2. Add the height to the breakout level:
Breakout ≈ 4,000
→ Target ≈ 4,000 + 140 = 4,140
🎯 Estimated Target: 4,140 USD
That matches closely with the dashed horizontal line labeled “target point” on my chart — right around 4,120–4,140.
So, my bullish target zone after breakout is approximately 4,120–4,140 USD per ounce.

MicroStrategy Broken 55-SMA so Will Bitcoin follow the Same ?NASDAQ:MSTR Crashes Below 55-Week SMA
History shows: MicroStrategy weakness = early CRYPTOCAP:BTC top warning.
▶️ NASDAQ:MSTR bottom?: ~$115
▶️ CRYPTOCAP:BTC possible floor: ~$75K
Bitcoin is still ready for a new crash if it follows NASDAQ:MSTR below its 55-SMA.
BTCUSDT is at a critical point. Watch, learn, and act & Follow for high-value market updates.
NFa & DYOR

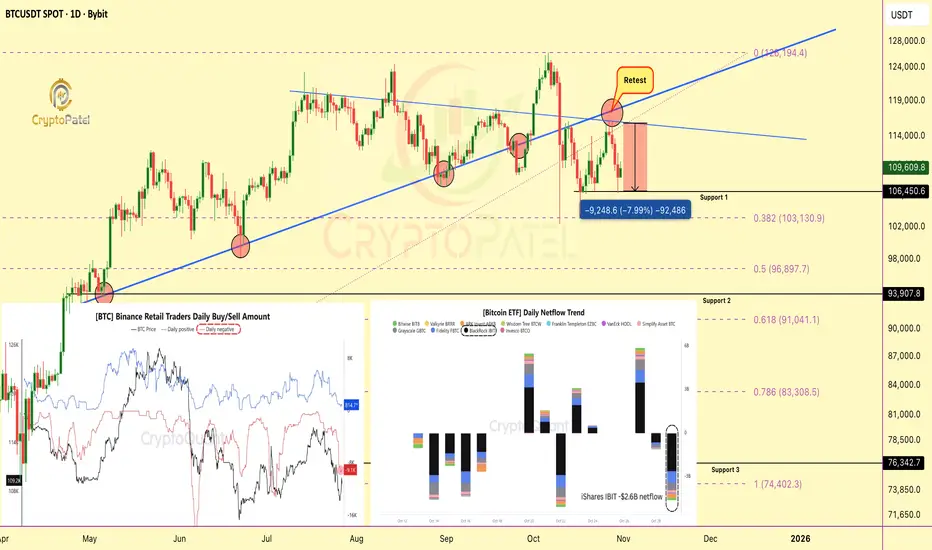
Retail Panic Meets ETF Outflows: $1B Bitcoin Sell-Off Hits MarkeRetail Panic Meets ETF Outflows: $1B Bitcoin Sell-Off Hits Markets
Bitcoin saw renewed selling pressure on Oct 30, as Binance retail traders dumped over 9,200 BTC (~$1B) around $107.7K, just days after another 12,000 BTC sell wave near $108.3K.
Technical View:
Retail traders are aggressively selling into weakness, while long-term holders remain largely inactive.
Historically, these sharp sell-offs from short-term players often form local bottoms, liquidity events where smart money quietly accumulates.
Fundamental Side:
Spot Bitcoin ETFs added more weight to the downside:
🔹 BlackRock: -$2.6B
🔹 Fidelity: -$790M
🔹 Grayscale: -$500M
These ETF outflows likely shifted capital to spot exchanges, amplifying short-term selling pressure.
Key Insight:
▶️ Retail capitulation + ETF outflows = short-term volatility
▶️ But remember, markets often bottom when retail panic peaks.
Note: NFA & DYOR
$ONDO Could Be the Next 20x Gem: Are You Ready?LSE:ONDO Could Be the Next 20x Gem: Are You Ready?
Currently in bearish breakdown, but if price falls below $0.50, IMO best accumulation zone starts.
Strong Support Zones:
Support 1: $0.53–$0.46
Support 2: $0.24–$0.20
Targets (Long Term): $5 / $10 (~20x from entry if filled)
Manage risk & DYOR, huge upside if supports hold!

AUD/USD (3H)...AUD/USD (3H) chart, here’s a breakdown of what I see and how the target can be projected:
---
🧠 Pattern Analysis
My identified a Cup and Handle pattern, which is a bullish continuation setup.
Cup low: around 0.6450
Cup rim (resistance / breakout level): around 0.6580 – 0.6590
Current price: ~0.6585 (right around the breakout level)
Handle: short pullback, touching near Ichimoku cloud support — healthy structure before potential breakout.
---
🎯 Target Projection (Cup & Handle Rule)
Cup and Handle target = Breakout level + Depth of the cup
Depth of cup:
0.6585 (rim) – 0.6450 (bottom) = 0.0135
Target = 0.6585 + 0.0135 = 0.6720
---
✅ Target Summary
Entry (breakout confirmation): above 0.6590
Target: 0.6720
Stop-loss: below 0.6535 – 0.6540 (below handle & cloud support)
Risk/Reward ratio: ~1:2.5
---
💡 Bonus Confirmation
Price is above the Ichimoku Cloud (bullish bias).
Handle retracement is shallow and respecting Tenkan/Kijun lines — typical of strong continuation setups.
Volume on breakout (watch for increase) would add confirmation.
---
Final Target: 0.6720 (main take-profit zone)

GBP/JPY 2-hour chart...GBP/JPY 2-hour chart, here’s what I can interpret based on my markings:
Range zone (pink box): approximately 203.8 – 204.4
Resistance zone (green box): around 201.0 – 201.5
Current price: ~202.18
Ichimoku cloud: price is just breaking back toward the cloud (potential short-term bullish momentum)
Marked target point: around 204.3 – 204.4
🎯 Target Analysis
If price continues its upward momentum from the bounce near 201.3 (support zone) and breaks above the cloud:
First target: 203.20 (top of the cloud / minor resistance)
Second target (main): 204.30 – 204.40 (the top of my marked range)
📉 Invalidation / Stop-loss idea
If price falls back below 201.70 – 201.50, that would invalidate the bullish setup and could signal another test of the green support zone.
Summary
Buy zone: Above 202.20–202.30 (confirmation above Tenkan/Kijun lines)
Target 1: 203.20
Target 2: 204.30–204.40
Stop-loss: 201.50

SOL/USDT (1H timeframe)...SOL/USDT (1H timeframe):
Here’s a clear technical breakdown 👇
🧭 Chart Overview:
Current price: around $200.40
Trend: Uptrend, but showing short-term pullback
Support area: $190 – $195
Resistance area: $205 – $210
🔍 Key Observations:
The ascending trendline is acting as dynamic support.
Price recently rejected near the $210 resistance zone and is pulling back toward the trendline and Ichimoku cloud.
The target points marked on my chart suggest downside retracements if support breaks.
---
🎯 Target Levels:
If price stays above the trendline/support → bullish continuation:
Target 1: $207
Target 2: $212
Target 3: $220 (major breakout target)
If price breaks below the trendline/cloud support → bearish correction:
Target 1: $195 (short-term support / first target point)
Target 2: $188 (lower target zone marked on chart)
Target 3: $180 (major downside target if correction deepens)
---
⚠ Summary:
📈 Bullish scenario: Hold above $198 → move to $207–$212.
📉 Bearish scenario: Break below $198 → drop to $195 → $188.

USD/CAD (3H timeframe) chart...USD/CAD (3H timeframe) chart 👇
🧭 Chart Overview:
Current price: ≈ 1.3979
Trend: Bearish breakdown from support and trendline.
Price has cleanly broken below both the ascending trendline and Ichimoku cloud, confirming a downside continuation.
---
🔍 Key Technical Details:
The previous support zone (1.4010–1.4040) has turned into resistance.
Momentum is bearish after retesting that area and rejecting it.
Two target points are clearly marked on my chart.
---
🎯 Target Levels:
If bearish momentum continues 👇
Target 1: 🟢 1.3900 — first major support / first target
Target 2: 🟢 1.3730–1.3750 — second major target zone (full extension of breakdown)
---
⚙ Trade Setup Suggestion:
Entry (Sell): Below 1.3980 (confirmation of continuation)
Stop Loss: Above 1.4045 (above broken support)
Take Profit 1: 1.3900
Take Profit 2: 1.3730
---
⚠ Summary:
📉 Structure = Bearish
🎯 Targets = 1.3900 → 1.3730
🔄 Resistance = 1.4010–1.4040 (sell zone if retested)

chart for GBP/JPY...chart for GBP/JPY. Based on what I’m seeing + recent technicals, here’s a target-zone scenario for my. Remember: this is a probabilistic view, not a guarantee — set my risk accordingly and use a stop.
---
🔍 Current technical context
GBP/JPY is hovering around ~ 203.0-203.5 (per recent data).
There is resistance near ~ 205.30 according to one analysis.
On the downside, support is referenced around ~ 200.67 or ~ 197.47 in one view.
The pair’s trend signals show a generally bullish macro trend, though short-term momentum might be weakening.
---
🎯 Target zones
Given my chart shows a break of a trendline (uptrend) and a move lower, here are two plausible targets depending on how the move unfolds:
If a bearish move continues (i.e., break of support around ~ 200.6) → A target around 197.50-198.00 is reasonable.
If the price instead holds support and bounces/reverses → A target near or above the resistance around 205.30-207.00 becomes possible.
---
✅ My preferred “play” based on my setup
Since my chart shows a breakdown of an ascending trendline, I lean toward the bearish target path:
Entry: At current ~ 203.0 area (assuming my chart confirms the break).
Stop-loss: Just above the recent high / trend‐line (say ~ 205.50) to manage risk.
Target: ~ 197.50-198.00 (gives about 5-6 points of drop from current).
Risk-reward: Check how many pips my risking vs this target — ensure the reward is larger than the risk.
---
⚠ Things to watch
If price breaks back above ~ 205.30 with good momentum, the bearish scenario is invalidated and my need to pivot.
Macroeconomic/fundamental events (e.g., UK or Japan monetary policy) can blow this setup either way — be aware.
The move to 197.50 might not be smooth — there may be bounces, retests of broken trendline, etc.
---
If you like, I can plot multiple target-levels (e.g., near‐term, mid-term, and stretch) on my exact chart timeframe (1-hour) and we can mark stop and risk-zones.
