[EOSUSDT] Currently in a magic Box? 💎 EOS/USDT is situated in a potent supply zone. It's broken through the trendline, signaling a shift in its trajectory.
💎Currently, it's consolidating within a specific range, or as we like to call it, 'the box'.
💎If EOS/USDT manages to break out of this box, we could be witnessing a significant bullish wave. Stay tuned, Paradisers!
💎In the ever-changing landscape of crypto, staying informed and adaptable is crucial. Keep an eye out for more updates and happy trading!"
Crypto

Lina USDTLina Usdt Descending
Short Lina
Entry 0.01925, 0.02025, 0.02150
Tp: 0.01819, 0.01725, 0.01664

Arpa USDTArpa Usdt Double Bottom
Short ARPA Usdt
Entry : 0.10580, 0.10650, 0.10800
TP: 0.10,0.09745, 0.0950
SL: 0.10900


Bitcoin Dead Or Gone At This Level $28200 or $26450See #bitcoin has this condition right now, no wonder btc always disappoint as well as always outperformed.
the resistance level of btc which is $28200 has to be crossed in order to reach $30k to $40k frame
if reversal pattern cross the support level of $26400 then we will se the collapse till $24k to $22k
hope you have the clarity in market
show love and respect for me to provide the best information of the market
thanks!
#crypto
#pepe
#btc

BTC SHORT ELLIOT WAVEI don't know why othere are talking about head and shoulder patterns however market is in a downtrend and there is a clear elliot wave structure. Target profit level should be 25500 however it is likely that it will go even lower.

BTCUSD : Looking for Short!BTCUSD is looking for short after forming H&S and impulsive move to the downside & formed a corrective formation, expecting to reach at 25,500

Bitcoin TA : WHAT THE FUTURE HOLDS ?We are now seeing a retracement on #btc after striking the 50% fib level at price $31125 from last high to swing low on monthly.
The next move is #btc tumbling further to our respective demand zones. We have Identified two possible outcomes A & B.
Option A(Blue): Bitcoin will reach the 50% fib at 22,521 and if the level holds we could see a retracement back to highs and potential newer high of 36.6k level. Which marks major supply for #btc.
Option B(orange) : Bitcoin could see a steeper retracement towards the 61.8-78.6% golden ratio on the fib. The prices are 21k-18.9k and see a strong pullback to the supply zone of 36k.
Note: These are technical analysis based on probability and is not 100% accurate. Please do your own research before investing.

ADA USDTADA USDT successfully retest support line and bounce back.
Long ADA
Entry Price: 0.3920, 0.38
TP: 0.4050, 0.4180, 0.44
SL: 0.3690

Next Expected BTC move Well BTC correction Pending from a long time, This is what I am expecting new BTC move to be

btc breakoutbtc broken of 1 month range a smaller resistance and huge resistance.. breaking both of it

analysis for bankniftyhello guys in this analysis i am sharing my view about the banknifty analysis i am not sebi registered but i am able to give you great analysis guys . as you know the banknifty have facing resistance from that area and early it create resistance zone which is very sidway so my viewpoint is to sidway next week and it will give you a great movie later in the market .

BTC Pure Manipulation | Target 25k..#BTC has been rejected three times at the 28.6k level, indicating a strong likelihood of a significant decline. It is advisable to maintain short positions and refrain from making impulsive decisions, as this appears to be a result of market manipulation.
#staystrong #trap #BTC

BTC Major Update | 25k soon.....It is evident that the current market trend is showing a consistent downward movement, forming a descending triangle pattern. Upon breaking the crucial support level of 26.5k, it is highly likely that the market will experience a further decline towards the levels of 25k or even 24.5k.
#BTCUSDT #short #futures #crypto

XAUUSDT | SHORT SETUP 5 min Small stop loss, xauusd reversed at 5min resistance level so am expecting one more down movement

BTC Next Target 25k 🩸🩸BTC is moving as expected. Next target is 25100. Will close the short position there and then re-enter in short by watching the market conditions. Follow for more updates.

EURUSD | ANALYSIS | 1DJust my view EURUSD, long if it's taking support, short if the price breaks the support

SOLUSDTPER | 1D | Try long entries when we hit the support (green zone) and wait for confirmation before entering. Analyse the chart, Look at the Fibonacci levels price reversed at 61.8% exactly. We can see the next support was also at the same level.

XAUUSD | ANALYSIS 1D If the green zone breaks the price, then more down movements possible, if it's taking support again in this area the next target is red supply zone

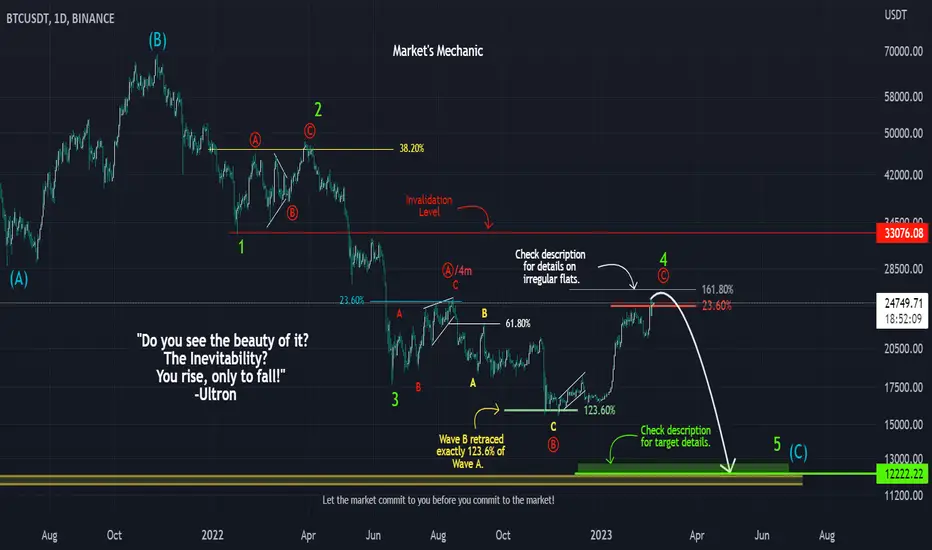
'You Rise, Only to Fall!' Elliotical Approach to BTCUSDT.Hello Traders!
"Do you see the beauty of it? The Inevitability? You rise, only to fall!"
As Ultron has pointed out, at times, markets rise, only to fall, what we traders call a 'retracement'. The bullish retracement of BTC is almost at its fag end.
1. We'll begin from the All-Time-High of about $69000. From there, we see the first 5-wave impulse down and then an ABC correction. That means, we have clear Waves 1 and 2.
2. Again, we see a 5-wave impulse in the form of Wave 3 and then again an ABC correction forming what we thought was Wave 4 (called Wave 4m from now on) .
3. There is a wonderful Rule of Alternation given in Elliot Wave theory. Wave 2 and Wave 4 will differ in at least one of the following ways if not all; PRICE, INTERNAL STRUCTURE, and/or TIME . There are a couple of other things as well but these 3 remain prominent.
4. Now, Wave 2 and Wave 4m took almost the same time and also had the same price value. Of course, the internal structures were different and that would have done it, but we didn't see the next 5-wave impulse down as the final fifth wave after 4 clear waves.
5. In such scenarios, we give the market time to unfold. Time is a very important key to market movement. We stay away until we understand what's really going on.
6. The market went further down and made a new low of around 15500 in 3 waves (marked with yellow ABC) . The move up breaking the high formed by 4m, confirmed that the correction was still going on. Wave 4m was just Wave A of actual Wave 4.
7. The 3 yellow ABC waves, were Wave B of Wave 4. They also happened to retrace exactly 123.6% of Wave A (4m) . This gave us the hint that an irregular flat correction was taking place.
8. What is an Irregular Flat Correction? The image has been attached. Please refer.
9. Wave C, ideally, should not cross 161.8% of Wave A. There can be a scenario of an extra elongation of Wave C but that is very very rare.
10. Coming to the Target Zone now. Wave 5 can be equal to Wave 1 through wave equality. That gives us a target of around 12222. We also have an important support for BTC at that price level. Once Wave 4 is finally complete, a parallel channel drawn through Waves 2, 3, and 4 should give us an approximate target of Wave 5.
11. The invalidation level for this analysis has been shown on the chart. Wave 4 should not enter the price territory of Wave 1. If it does, we'll have to re-analyze. Although, since it's a large C wave, the possibility of a diagonal exists (where Waves 1 and 4 can coincide), it doesn't seem to be in the picture yet.
12. It is expected that the market will break its current high on 25250 once before beginning the impulse down.
Do use proper risk management.
Happy Trading!
Profits,
Market's Mechanic.
Breakout or Breakdown in Ethereum on 30m and 4H TF Hello Traders,
I am tracking the ethereum on 30m and 4h time frame.
On 30m chart
- Bollinger Band Squeezed
- ema(20,50,100,200) lies in between the Bollinger Bands
- RSI Neutral
- MACD Neutral
From these levels we can get a good trade on either side.
Wait for the breakout or breakdown and enter the trade in that direction, a good small trade can be executed.
On 4H chart
- Bollinger band expands
- Price is at the middle line
- sma(20) coincides with the support/resistance level
- Intraday move decides the direction for swing trade.
Happy trading and keep learning.
Thanks
Er. Simranjit S Virdi


