BTC Next Target 25k 🩸🩸BTC is moving as expected. Next target is 25100. Will close the short position there and then re-enter in short by watching the market conditions. Follow for more updates.
Crypto

EURUSD | ANALYSIS | 1DJust my view EURUSD, long if it's taking support, short if the price breaks the support

SOLUSDTPER | 1D | Try long entries when we hit the support (green zone) and wait for confirmation before entering. Analyse the chart, Look at the Fibonacci levels price reversed at 61.8% exactly. We can see the next support was also at the same level.

XAUUSD | ANALYSIS 1D If the green zone breaks the price, then more down movements possible, if it's taking support again in this area the next target is red supply zone

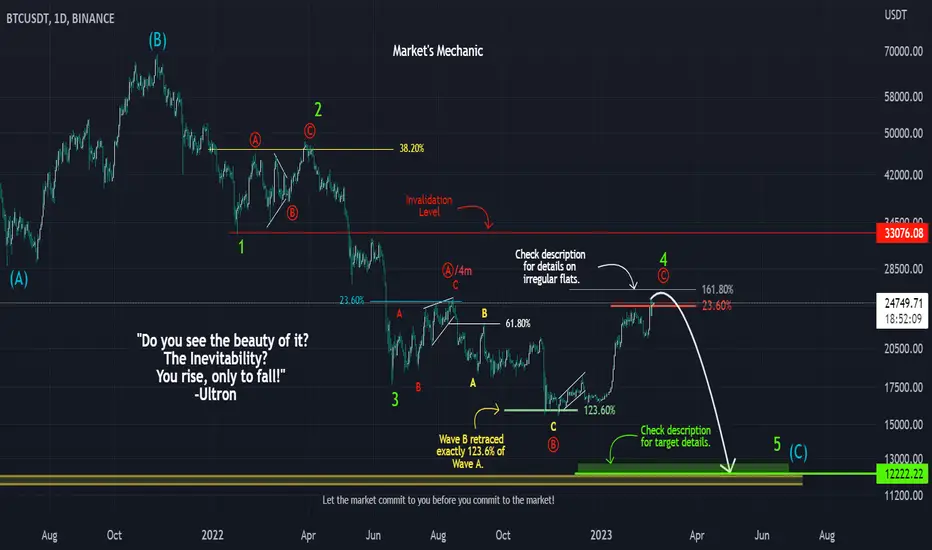
'You Rise, Only to Fall!' Elliotical Approach to BTCUSDT.Hello Traders!
"Do you see the beauty of it? The Inevitability? You rise, only to fall!"
As Ultron has pointed out, at times, markets rise, only to fall, what we traders call a 'retracement'. The bullish retracement of BTC is almost at its fag end.
1. We'll begin from the All-Time-High of about $69000. From there, we see the first 5-wave impulse down and then an ABC correction. That means, we have clear Waves 1 and 2.
2. Again, we see a 5-wave impulse in the form of Wave 3 and then again an ABC correction forming what we thought was Wave 4 (called Wave 4m from now on) .
3. There is a wonderful Rule of Alternation given in Elliot Wave theory. Wave 2 and Wave 4 will differ in at least one of the following ways if not all; PRICE, INTERNAL STRUCTURE, and/or TIME . There are a couple of other things as well but these 3 remain prominent.
4. Now, Wave 2 and Wave 4m took almost the same time and also had the same price value. Of course, the internal structures were different and that would have done it, but we didn't see the next 5-wave impulse down as the final fifth wave after 4 clear waves.
5. In such scenarios, we give the market time to unfold. Time is a very important key to market movement. We stay away until we understand what's really going on.
6. The market went further down and made a new low of around 15500 in 3 waves (marked with yellow ABC) . The move up breaking the high formed by 4m, confirmed that the correction was still going on. Wave 4m was just Wave A of actual Wave 4.
7. The 3 yellow ABC waves, were Wave B of Wave 4. They also happened to retrace exactly 123.6% of Wave A (4m) . This gave us the hint that an irregular flat correction was taking place.
8. What is an Irregular Flat Correction? The image has been attached. Please refer.
9. Wave C, ideally, should not cross 161.8% of Wave A. There can be a scenario of an extra elongation of Wave C but that is very very rare.
10. Coming to the Target Zone now. Wave 5 can be equal to Wave 1 through wave equality. That gives us a target of around 12222. We also have an important support for BTC at that price level. Once Wave 4 is finally complete, a parallel channel drawn through Waves 2, 3, and 4 should give us an approximate target of Wave 5.
11. The invalidation level for this analysis has been shown on the chart. Wave 4 should not enter the price territory of Wave 1. If it does, we'll have to re-analyze. Although, since it's a large C wave, the possibility of a diagonal exists (where Waves 1 and 4 can coincide), it doesn't seem to be in the picture yet.
12. It is expected that the market will break its current high on 25250 once before beginning the impulse down.
Do use proper risk management.
Happy Trading!
Profits,
Market's Mechanic.
Breakout or Breakdown in Ethereum on 30m and 4H TF Hello Traders,
I am tracking the ethereum on 30m and 4h time frame.
On 30m chart
- Bollinger Band Squeezed
- ema(20,50,100,200) lies in between the Bollinger Bands
- RSI Neutral
- MACD Neutral
From these levels we can get a good trade on either side.
Wait for the breakout or breakdown and enter the trade in that direction, a good small trade can be executed.
On 4H chart
- Bollinger band expands
- Price is at the middle line
- sma(20) coincides with the support/resistance level
- Intraday move decides the direction for swing trade.
Happy trading and keep learning.
Thanks
Er. Simranjit S Virdi


THIS IS BITCOIN TETHERUSSo as you see on 4H there's CHoCH so I created first POINT OF INTEREST { POI } for long and now waiting for Mitigation so I placed an order for long! But then we saw a rejection on 16FEB23 21:30 with big candle and small body. Next day on 17FEB23 1:30 another HUGE RED CANDLE so I have to mark POI so I mark another POI and wait for Mitigate. MITIGATION means we have to wait for the market to come in the POI price entering the box is called MITIGATION.
18FEB23 1:30 price entered the box and we can see a price consolidate.
19FEB23 13:30 placed short entry and my SL is above New HIGH which created on 16FEB23 21:30 @25250
RRR 1:3
21FEB23 13:30 we saw a rejection again! REJECTION FROM PREVIOUS HIGH!!!
CORRECT ME IF I'M WRONG!!!

XAUUSD | SHORT SETUP FOR XAUUSD Short when the support is broken, CHoCH happened and Continuing to creating new lower lows ,

THIS IS SOLANA TETHERUS.On 4H as you see after every BOS I marked an POI to captured a good trade. As you see second POI is Mitigate with BIG RED CANDLES. Now it's time for long 1:3 If I booked with loss means if I exit market after touched of SL or price crossed my SL and went DOWN then there is my first POI which I already created.
First HIGH @26.869 with small body and big wicks.
Second HIGH @27.150 with small body and big wicks and got rejection from that area.
LETS SEE IF ITS WORK'S OR NOT!
CORRECT ME IF I'M WRONG!!!

$BTC AnalysisBitcoin rose 2.3% when it finally reached the middle of my liquidity box. This deal occurred in the early hours of the morning, so I missed it even though I wanted to participate. What follows then? I'll wait for Bitcoin to either break my liquidity box, which would then indicate that $22300 would be the next target on the downside, or for BTC to break the resistance trend line, after which it would consolidate before starting its next leg up. Weekly closing is one more thing to keep an eye on; I'll provide an update on it tomorrow.
Not a financial advice
Trade at your own risk

$BTC attempts to break my liquidity box$BTC has previously made three attempts to break the liquidity box but was unsuccessful in doing so. A rally to 29k can start with a close above 25.2k. Normally, it takes 4-5 solid volume attempts to crack a box like this.
Not a financial advice
Trade at your own risk

BTC immidiate TargetBTC is looking good with DXY rejection from resistance level just before the weekend. It can pump to 24.4K over the weekend

Zilliqa- ZILWith shift in narratives so sudden, there seems to be a great development in the web3 gaming side of things. This could be a strong narrative when it manifests.
Projects like ZIL, trying to place themselves for that shows positive signs. ZIL has been around for a long time and has its pump sooner or later.
This chart is looking great. Signs of bottom are there and signs of accumulation with price support for weeks is assuring. Will be buying spot first, then plan longs when it finally starts to move.
NFA, good luck.

LITECOIN (LTC) This is based on the Elliott Wave Theory. The current structure can be assumed as a triangle due to internal ABC formations. This suggests that the price would remain bullish from the current levels.

ETHEREUM - Elliott Wave ViewThe idea is based on the Elliott Wave Theory. It suggests that the correction cycle may be over and the next bullish cycle could begin from here.

$BTC Daily Update$BTC #BTC As expected $23,479 support came in effect, 1D failed to follow up bullish engulfing closing bearish. $23,479 testing as of now, needs to hold above $23K to retest $24,129. Continue watching given S/R.

$BTC Daily Update$BTC #BTC $23,713 support testing. Reattempt at $24,129 resisting as expected. $22,750 support held. Last 1D closed good, Current 1D not looking good as of now. 4H closed bearish $23,713-$23,479 test likely.

$BTC Daily Update$BTC #BTC Failed to follow thru on bullish engulfing from Sunday, put bearish engulfing on last 1D close, $22,750 support tested and currently in effect. Current support at risk, next support to watch $22,379, $21,791. Continue watching S/R

Shiba Inu-Double bottom retestingShiba Inu coin formed a double bottom pattern in 15m time frame.It is retesting now from the neckline(S1) and can give a upper breakout to R1.If the neckline breaks out with high volume candles,a long trade can be initiated.Support and resistances are marked on the chart.keep on eye on this trade.
Happy trading.

BITCOIN IN A MOOD TO MAKE A BIG MOVE SEE THE PATTERNS Bitcoin is holding range of 23400-22400 a breakout is necessary for a big move from previous trend investors are expecting some big move in bitcoin upside direction so traders can play in a range by buying at whenever btc touches or support price.
DICLAIMER: THIS POST IS FOR EDUCATIONAL PURPOSES ONLY THIS IS NOT ANY RECOMENDATIONS TO ANYBODY FOR BUYING OR SELLING IN MARKET.

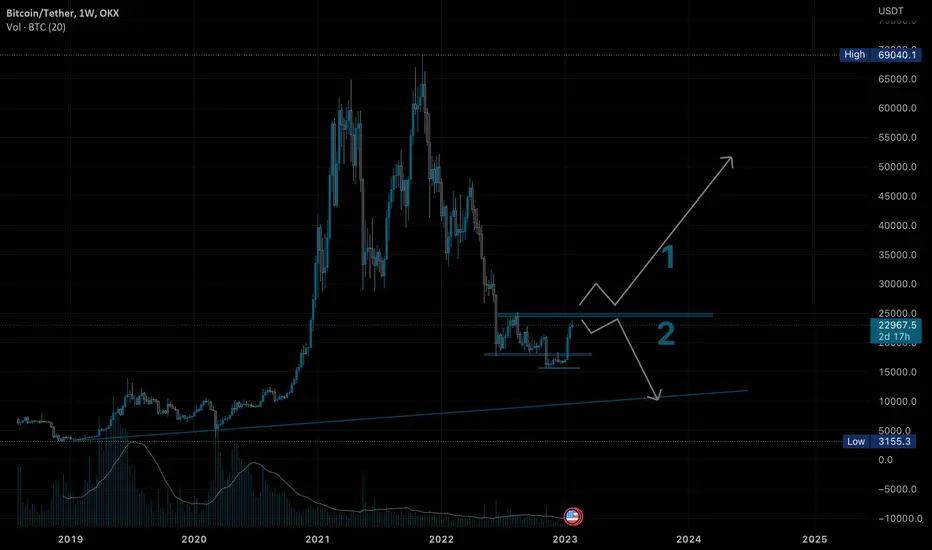
Bitcoin next move update1 or 2 ?
Lets not guess.
Lets react to the market
If guessing is the game i’l go with 1
#fingerscrossed