Silver Futures (MCX) 4-hour chart Silver Futures (MCX) 4-hour chart, and my marked a resistance zone and a downward breakout below the Ichimoku cloud and key support.
Here’s what I can interpret:
Price broke below the Ichimoku cloud, confirming a bearish trend.
There’s a clear resistance area around ₹151,000–₹153,000.
The breakdown happened below the ₹145,000–₹146,000 level.
My marked a target zone below, with a downward arrow.
✅ Likely Target Projection
Using standard technical projection (height of range = target distance):
Resistance zone top: ~₹153,000
Breakdown zone: ~₹145,000
Height: ₹8,000
If we subtract that from the breakdown area:
Target = 145,000 – 8,000 = ₹137,000
🎯 Estimated Short-term Target:
₹137,000 – ₹138,000
This aligns with my chart’s “target point” mark.
If you want to be more precise, you could:
Watch for support around ₹140,000, which might give a bounce.
If that breaks, next major support zone = ₹136,000–₹137,000.
Crypto

EUR/USD chart...EUR/USD chart:
Chart timeframe: 2H (2-hour chart)
Pattern: It looks like a descending trendline breakout from a consolidation (range) zone, confirmed by Ichimoku signals and upward momentum.
Indicators: Ichimoku Cloud shows price breaking above the cloud — a bullish sign.
Target zone: my marked two “target points” with arrows on my chart.
---
To estimate the target price, let’s infer it based on the chart:
1. Current price (breakout point): ≈ 1.1667
2. Height of the range (pink box): roughly from 1.1520 to 1.1670
→ Range height ≈ 150 pips (0.0150)
If this is a range breakout, then:
Target 1 (conservative): 1.1667 + 0.0150 = 1.1817
Target 2 (extended): another projection from that = 1.1967
---
✅ Targets Summary:
🎯 Target 1: 1.1817
🎯 Target 2: 1.1967
These align with my chart’s two “target point” lines visually.

XAU/USD (Gold) chart on the 3-hour timeframe...XAU/USD (Gold) chart on the 3-hour timeframe, I can see my using the Ichimoku Cloud and have marked a range with a potential breakdown area and a target point already indicated on the chart.
Here’s what the chart suggests:
Current price: around 4031 USD
Range low (support): around 4030 USD (which is currently being tested)
Range high (resistance): around 4190–4200 USD
Breakdown target (measured move): around 3940–3950 USD
📉 Analysis:
Price has broken below the range box, indicating a bearish breakout.
The Ichimoku Cloud ahead is bearish and thick, showing potential resistance.
A measured move from the height of the range (≈ 150–170 points) projects downward to around 3940–3950 USD.
My chart already marks 3944.299 as the target point, which aligns well with this projection.
✅ Target Summary
Type Level (USD) Comment
Short-term target 3,944 Measured move target after range breakdown
Extended target 3,900–3,880 Possible continuation if bearish momentum sustains
Invalidated above 4,090–4,100 If price re-enters the range and closes above the cloud

Bank Nifty (Nifty Bank Index, 2-hour timeframe)... Bank Nifty (Nifty Bank Index, 2-hour timeframe) chart, here’s the clear technical chart:
---
🧭 Chart Observation
Current price: Around ₹56,800
My marked a bullish breakout from the Ichimoku cloud and an uptrend channel.
The “target point” line is drawn around ₹57,900–₹58,000 area.
Trendline support sits much lower near ₹55,700.
Cloud and Tenkan–Kijun lines both support bullish continuation.
---
🎯 Target Projection
From the chart setup:
Type Target Comment
Primary (Short-term) ₹57,800 – ₹58,000 Matches my “target point” area and previous resistance zone.
Extended (if breakout continues) ₹58,400 – ₹58,600 Possible if momentum and volumes stay strong.
---
📈 Suggested Trading Plan (Bullish Setup)
Entry zone: On dips toward ₹56,400–₹56,500
Target: ₹57,800–₹58,000
Stop Loss: Below ₹56,200 (below Tenkan line / minor support)
Risk–Reward ratio: ~1:2
---
⚠ Notes
The trend is clearly bullish; Ichimoku cloud is providing strong trailing support.
Only if Bank Nifty closes below ₹56,200, the momentum could weaken, and support would then shift near ₹55,700 (trendline).
---
✅ Final Target: ₹57,800 – ₹58,000
That’s your next major resistance / profit-taking zone according to the chart.

GBP/JPY (British Pound / Japanese Yen) 1-hour chartGBP/JPY (British Pound / Japanese Yen) 1-hour chart, I have drawn a rising wedge pattern — which is typically a bearish reversal setup once the lower trendline breaks.
Here’s the detailed target analysis:
---
📉 Current price:
Around 203.50
⚠ Breakdown level (support zone):
Around 203.20 – 203.00
If the price closes below this zone, the bearish move is confirmed.
---
🎯 Target 1 (short-term target):
≈ 202.20 – 202.30
This aligns with my first target point marked on the chart — the initial measured move from the wedge height.
---
🎯 Target 2 (extended / full move):
≈ 201.20 – 201.30
This matches my second target point — the full measured projection of the wedge pattern.
---
✅ Summary:
Level Description Zone
🔻 Breakdown Point Confirm sell below 203.20 – 203.00
🎯 Target 1 First profit level 202.20 – 202.30
🎯 Target 2 Final profit level 201.20 – 201.30
⛔ Stop-loss Above recent high 204.00 – 204.20

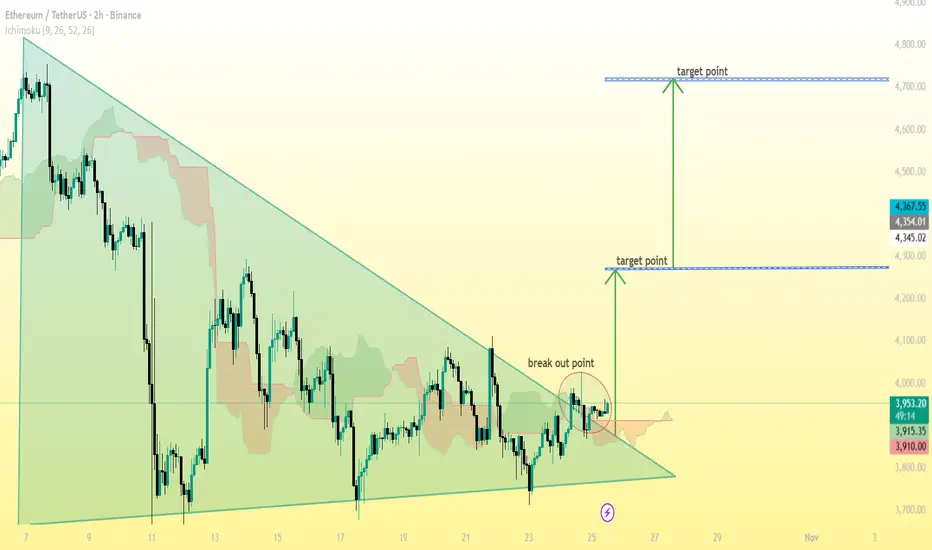
ETH/USDT (Ethereum vs Tether) on the 2-hour timeframe...ETH/USDT (Ethereum vs Tether) on the 2-hour timeframe, the pattern drawn is a symmetrical triangle — a consolidation setup that often leads to a strong breakout.
Here’s the target breakdown based on my chart:
---
📈 Current breakout level:
Around $3,950 – $3,960
🎯 Target 1 (short-term):
Around $4,350 – $4,370
This is the first target after the breakout, matching my chart’s lower target point.
(≈ +10% move from the breakout)
---
🎯 Target 2 (extended / major):
Around $4,700 – $4,750
This is the second target — the measured move from the triangle’s height projected upward.
(≈ +18%–20% move from the breakout)
---
⚠ Support / Stop-loss suggestion:
If price closes back below $3,900, it may invalidate the breakout and signal a false move.
---
✅ Summary:
Breakout point: $3,950
Target 1: $4,350
Target 2: $4,700
Stop loss: $3,900
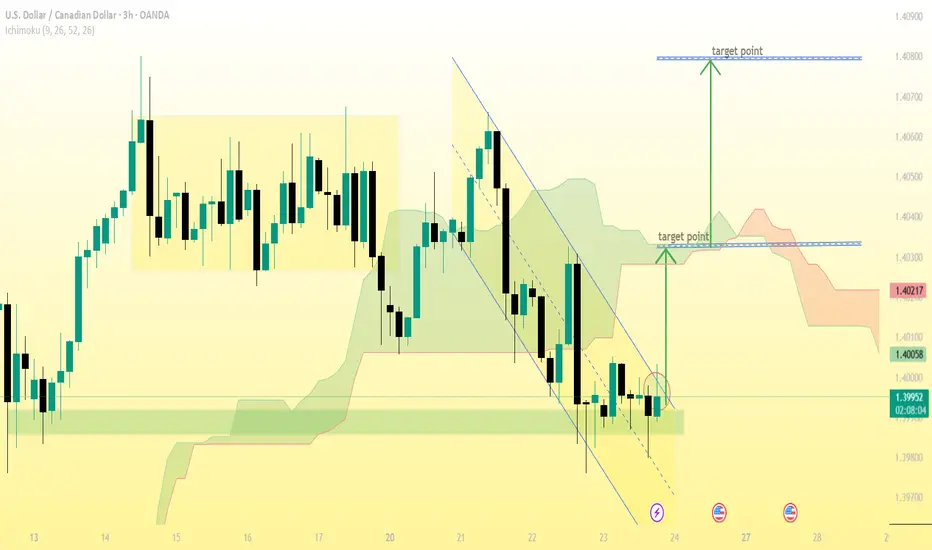
USDCAD (3H chart) setup ...USDCAD (3H chart) setup — here’s what can be seen and the likely target analysis based on my chart:
🔍 Chart Observations:
The pair has broken out of a descending channel (marked by the two slanting lines).
Price is currently around 1.3999 and testing the upper boundary of the breakout.
The chart also uses Ichimoku Cloud, with price beginning to move above the cloud area — a bullish sign.
Two target points are already drawn on my chart.
🎯 Target Levels:
1. First Target (Short-term):
📍 Around 1.4020 – 1.4030
→ This aligns with my first “target point” label and matches initial resistance from the cloud zone.
2. Second Target (Main Bullish Target):
📍 Around 1.4070 – 1.4080
→ This corresponds to the higher target level drawn on my chart and previous horizontal resistance zone.
✅ Summary:
Buy Zone: 1.3980 – 1.4000
TP1: 1.4020
TP2: 1.4070
Stop Loss (SL): Below 1.3960 (under the support base)
This setup supports a bullish breakout continuation toward 1.4070 if the price sustains above 1.4000.
SOLANA 27,560% CYCLE IS ABOUT TO REPEAT - $9,200 TARGET BY 2029 SOLANA 27,560% CYCLE IS ABOUT TO REPEAT - $9,200 TARGET BY 2029
Previous Bull Cycle Metrics:
1️⃣ Duration: 1,492 days
2️⃣ % Gain: 27,560%
3️⃣ Price: $1 → $295
Now here's where it gets CRAZY...
IF we get a healthy retracement to the golden pocket ($60-$35), and IF the fractal repeats:
1️⃣ Bottom: $60-$35
2️⃣ Same % gain: 27,560%
3️⃣ Same timeframe: 1492 days (Feb 2029)
This is Wyckoff accumulation into parabolic expansion.
The risk/reward is GENERATIONAL
Bookmark this. Screenshot this. Thank me in 2029.
This is just my math based on past fractals & returns. Not financial advice - DYOR

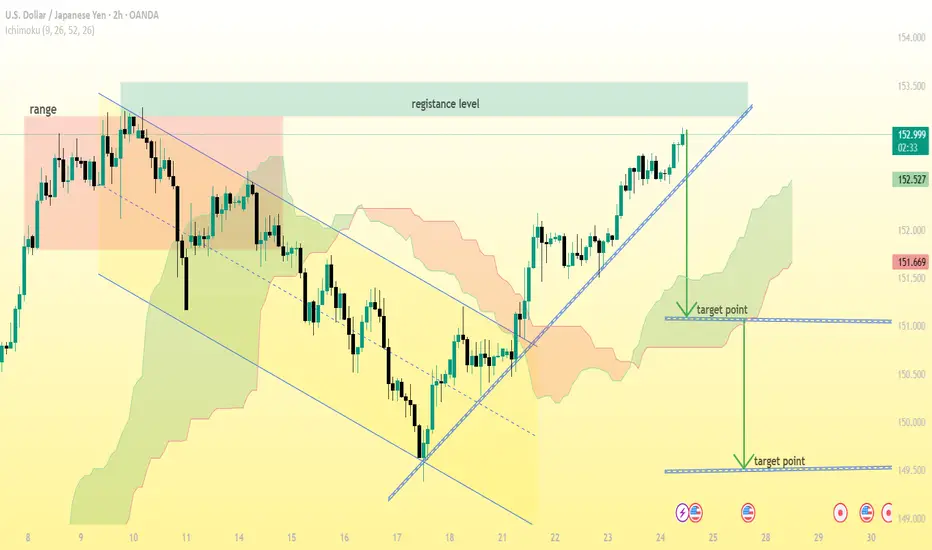
USD/JPY (2H chart)...USD/JPY (2H chart):
The current price is around 152.97, sitting at the upper resistance zone marked on my chart.
There’s a visible ascending trendline, and the price is currently testing or slightly above that line.
My marked two target points below — likely indicating a bearish correction setup if the trendline breaks.
Here’s the detailed breakdown:
---
📉 Bearish Scenario (if price breaks below trendline and 152.50 zone):
1. First Target:
Around 151.65 – 151.70
→ This aligns with my first “target point” label and Ichimoku cloud support.
2. Second Target:
Around 150.30 – 150.50
→ my lower target zone, near the previous consolidation support.
---
📈 Bullish Scenario (if resistance breaks and price sustains above 153.00):
Next resistance levels: 153.50 – 153.80, and then 154.20.
Only valid if there’s a strong close above 153.00 with volume.
---
🔹 Summary:
Scenario Condition Target 1 Target 2
Bearish Break below 152.50 151.65 150.30
Bullish Break & close above 153.00 153.50 154.20
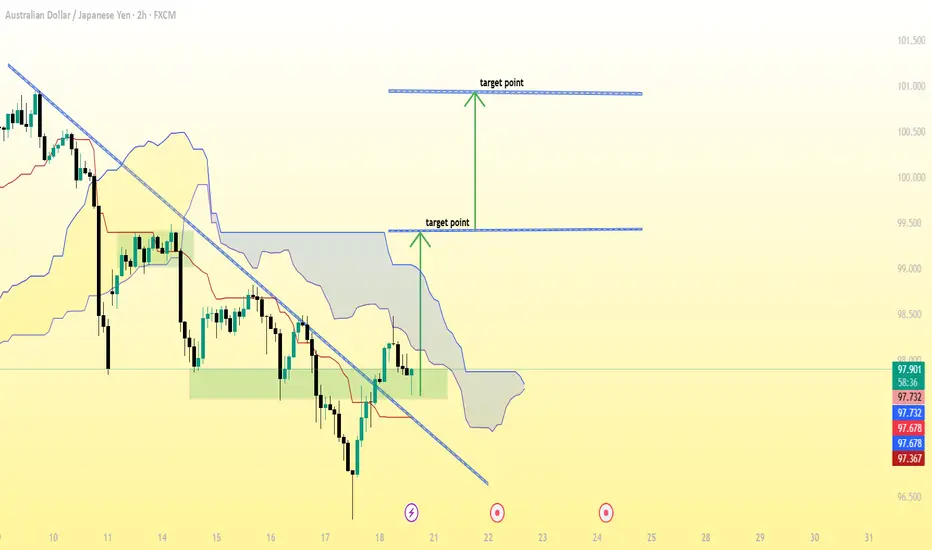
AUD/JPY (2-hour timeframe), here’s a breakdown of what’s visibleAUD/JPY (2-hour timeframe), here’s a breakdown of what’s visible:
The downtrend line has been broken to the upside, suggesting a potential bullish reversal.
The Ichimoku Cloud shows price moving above or attempting to move above the cloud — another bullish signal.
Two target points are already marked on my chart:
1. First target: around 99.50
2. Second (final) target: around 100.75–101.00
✅ Summary of Target Zones:
🎯 Target 1: ~99.50
🎯 Target 2: ~100.75–101.00
📉 Stop Loss Suggestion:
My might place it just below the recent support or below the cloud (around 97.00–97.20 zone), depending on my risk tolerance.
EUR/USD (Euro vs US Dollar) chart on the 2-hour timeframe...EUR/USD (Euro vs US Dollar) chart on the 2-hour timeframe, here’s a detailed breakdown of what my setup is showing and the likely target levels 👇
---
🧭 Chart Overview:
Current price: ≈ 1.1608
My using Ichimoku Cloud, trendlines, and measured move projections.
The chart shows a breakout from a falling channel, with two marked target points above.
---
🎯 Target Points (as per my chart):
1. First Target (Short-term):
Roughly around 1.1680 – 1.1700
This level aligns with the top of the Ichimoku Cloud and previous structure resistance.
It’s my initial profit zone after confirmation of breakout continuation.
2. Second Target (Extended):
Roughly around 1.1780 – 1.1800
This level is derived from the measured move (height of previous range projected upward).
It represents the full bullish objective if momentum sustains.
---
⚙ Trading Logic (Example):
Buy Entry: After breakout retest near 1.1600 – 1.1620
Target 1: 1.1680 – 1.1700
Target 2: 1.1780 – 1.1800
Stop Loss: Below 1.1550 (previous swing low / lower cloud boundary)
---
📊 Potential Gain:
From 1.1600:
Target 1: ≈ +80 pips
Target 2: ≈ +180–200 pips

XAGUSD (Silver/USD) 1-hour chart...XAGUSD (Silver/USD) 1-hour chart, here’s what I can observe and infer about potential target levels:
---
🔍 Chart Summary:
My using Ichimoku Cloud and trendlines.
Price is currently around $49.10.
The chart shows two target points drawn:
1. First Target Point: Around $51.90 – $52.00
2. Second Target Point: Around $54.30 – $54.50
---
🎯 Target Levels Based on the Chart:
1. First Target (Short-Term):
Around $51.9 – $52.0
This coincides with resistance from the previous range and Ichimoku cloud top.
Represents a possible initial take-profit zone if price breaks above current consolidation.
2. Second Target (Extended):
Around $54.3 – $54.5
Aligns with the projected measured move from my trendline channel.
This would be the larger bullish target if price sustains above the $52 breakout zone.
---
📈 Trading Idea (Hypothetical Example):
Buy Zone: Above $49.5 – $49.8 (confirmation breakout)
Target 1: $51.9 – $52.0
Target 2: $54.3 – $54.5
Stop Loss: Below $48.5 support (near Ichimoku base)

XAGUSD (Silver vs USD) on the 1-hour timeframeXAGUSD (Silver vs USD) on the 1-hour timeframe, here’s what can be inferred:
The price has clearly broken below the ascending trendline.
It also broke down through the Ichimoku cloud, confirming a bearish signal.
There’s a sharp rejection candle followed by continuation below previous structure support (around $52.00–$51.80).
My marked a “target point” on your chart — roughly near $47.50, which seems to be aligned with the next major support zone from earlier price action (likely a demand area or Fibonacci retracement level).
🧭 Technical Breakdown:
Current Price: ~$51.81
Immediate Resistance: $52.30–$52.45 (bottom of the cloud)
Support/Target:
Short-term: $50.80
Medium-term: $49.50
Major target (as on your chart): $47.50
🎯 Expected Target:
If bearish momentum continues and the price stays below the $52.00 resistance, your target of $47.50 looks reasonable as a swing target.

$LTC ACCUMULATION PHASE IS OVER: Ready to $500?🚨 CRYPTOCAP:LTC ACCUMULATION PHASE IS OVER 🚨
✅ Strong bounce from 7-YEAR trend line support
✅ Soon Break out 4-YEAR descending wedge
✅ Re-accumulation zone: COMPLETE
1️⃣ Target 1: $216 (+129%)
2️⃣ Target 2: $388 (+311%)
3️⃣ Target 3: $532 ALL-TIME HIGH (+464%)
👉 Last time this pattern played out = 1,596% PUMP
But yeah, keep buying at ATH 🤡
NFA & DYOR

BTC/USDT (Bitcoin vs Tether).....BTC/USDT (Bitcoin vs Tether) on the 1-hour timeframe (Binance).
Here’s what the technicals show:
A clear ascending trendline has been broken downward.
Price is retesting the broken support (now resistance) around 108,800–109,000.
There’s a bearish continuation setup after the sharp drop from the 113,000 zone.
The chart marks a “Target Point” at the bottom, aligned with the measured move of the pattern.
📉 Analysis Summary:
Breakdown level: ~109,000
Current price: ~107,800
Measured move / target: ~103,000
✅ Bearish Target Zone:
> 🎯 Target = 103,000 – 103,200 USDT

XAU/USD (Gold vs USD) 4H chart:XAU/USD (Gold vs USD) 4H chart:
I can see a clear double top pattern near the 4,330 zone (circled areas).
Price has broken the ascending trendline and is currently retesting near the 4,080–4,100 resistance zone (previous support).
The green zone shows the neckline area that price already broke below.
📉 Technical Breakdown:
Pattern: Double Top
Neckline: Around 4,130
Measured Move Target: Equal to the distance from the top (~4,330) to the neckline (~4,130), i.e. ≈ 200 points.
Applying that below the neckline gives:
→ 4,130 - 200 = 3,930
However, my chart’s “Target Point” line is drawn slightly lower — around 3,848.57, which aligns with a deeper support level and the full projection of the trend break.
✅ Final Target Zone:
Primary Target: 3,930
Extended / Full Target: 3,850 (3,848.57)
So:
> 🎯 XAU/USD Bearish Target = 3,850 – 3,930 zone

XAU/USD (Gold) chart: Timeframe: 30 minutes...XAU/USD (Gold) chart:
Timeframe: 30 minutes
Price action: Price bounced strongly from an ascending trendline (blue line).
The green zone above represents resistance (previous swing highs).
There’s a red arrow showing an expected upward move to a target point.
🔍 Analysis
Current price: around $4,269
The target point line my marked is near $4,365–$4,375 region.
That corresponds to the previous resistance zone (green box).
🎯 Target summary
Entry zone: around $4,260–$4,270 (near the trendline bounce)
Target: $4,365 – $4,375
Upside potential: roughly +100 to +110 points (~2.5%)
Stop-loss suggestion: below the trendline, around $4,230 (to protect against breakdown)

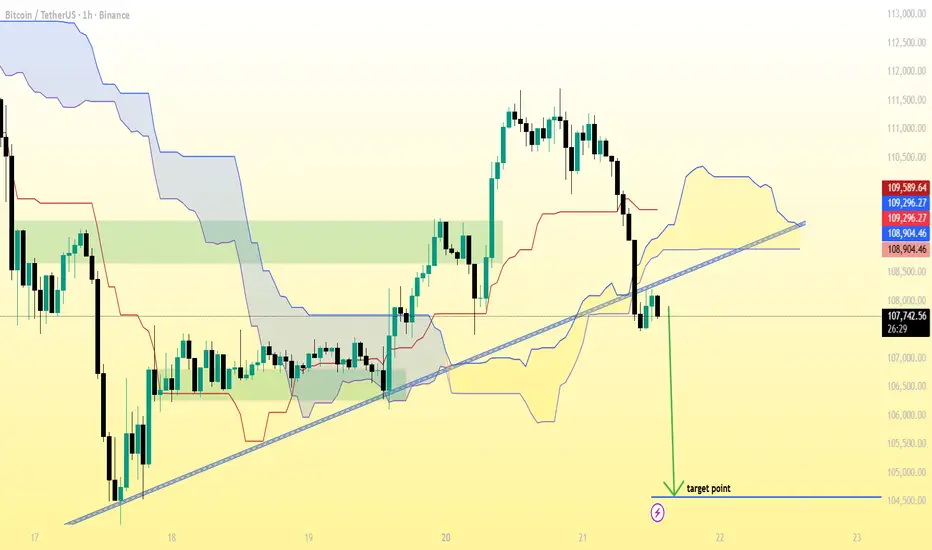
BTC/USDT (1-hour timeframe...BTC/USDT (1-hour timeframe) on Binance.
The price has broken below a trendline and is trading under the Ichimoku Cloud, which indicates bearish sentiment.
A green arrow is drawn downward pointing to a target zone labeled “target point.”
🔍 Based on the chart:
Current price: around $107,854
The projected target point (according to my drawn line) appears to be near the $105,400–$105,600 range.
📉 Summary:
If the bearish breakdown continues:
Target: around $105,500
Potential drop: roughly 2.2%–2.4% from current levels
Invalidation (stop loss): if BTC closes back above the trendline or $109,300–$109,500 region (top of the cloud)
ETHUSD (Ethereum / U.S. Dollar) on the 1-hour timeframe...ETHUSD (Ethereum / U.S. Dollar) on the 1-hour timeframe, here’s what stands out technically:
---
🧭 Chart Overview
The price has broken above a descending trendline, which is a bullish breakout signal.
The breakout is supported by Ichimoku confirmation — price is trading above the cloud, and the cloud ahead is turning bullish.
There’s a clear retest of the breakout zone (around $3,950–$3,970), where buyers stepped in again.
My marked a target point on the chart near the $4,225–$4,250 region.
---
🔍 Technical Breakdown
Current price: ~$4,040
Support zone: $3,950–$3,970 (retest area / Kijun + trendline retest)
Immediate resistance: $4,100–$4,150
Target zone (as shown): $4,220–$4,250
That corresponds closely to the measured move from the prior consolidation or inverse head-and-shoulders structure on the left side.
---
🎯 Expected Target
✅ Primary target: $4,225–$4,250
(aligns with your marked “target point” and measured breakout projection)
⚠ Stop-loss suggestion (for risk control): Below $3,930
(to stay safe if it dips back into the cloud)
---

$TRUMP MEMECOIN: -98% DRAWDOWN ANALYSIS$TRUMP MEMECOIN: -98% DRAWDOWN ANALYSIS
TECHNICAL BREAKDOWN:
▶️ ATH Distribution: $70 (Exit signal executed)
▶️v Current Price Action: 98% retracement from peak
▶️ Market Structure: Parabolic blow-off → capitulation phase complete
▶️ Performance validates early exit thesis.
CURRENT MARKET STRUCTURE:
▶️ Bias: Bearish continuation
▶️ Key Resistance: $8.00 (structural pivot)
▶️ Invalidation Level: Sustained break above $8 with volume
▶️ Breakout scenario → $50 measured move target
▶️ Probability: Low (requires liquidity catalyst)
SPECULATIVE OPPORTUNITY (HIGH RISK):
▶️ Asset Class: Extreme volatility / lottery ticket
▶️ Entry Thesis: 92% discount from ATH = asymmetric R/R
▶️ Position Allocation: 1-2% max portfolio weight
▶️ Time Horizon: 12-24 month hold
▶️ Stop Loss: Total loss acceptable
▶️ This is binary outcome speculation, not investing.
INSTITUTIONAL PERSPECTIVE:
▶️ Celebrity token = coordinated distribution to retail
▶️ Tokenomics favor insiders
▶️ Liquidity profile indicates exit event completed
▶️ Capital preservation >> speculative moonshots
Risk Disclosure: Speculative asset. Trade accordingly.
⚠️ NOTE: Never invest hard-earned money in celebrity/influencer tokens. These are engineered liquidity extraction schemes, not legitimate projects.
Capital preservation > moonshot gambling.
NFa & DYOR

USDCHF (U.S. Dollar / Swiss Franc) 1-hour chart... USDCHF (U.S. Dollar / Swiss Franc) 1-hour chart.
Here’s what I can read from my setup:
The price has been in a downtrend, shown by the descending trendline.
There’s a bullish breakout attempt from that trendline.
Two target points are marked above the current price — both inside and above the Ichimoku Cloud (suggesting possible bullish recovery targets).
🔍 Technical Breakdown:
Current price: ≈ 0.7921
First target point: ≈ 0.7965 – 0.7970
Second (main) target point: ≈ 0.8010 – 0.8020
🎯 Targets:
1. TP1: 0.7965 → retest of lower cloud resistance
2. TP2: 0.8010 → full cloud breakout / upper structure resistance
⚔ Suggested Stop-Loss (for buy setup):
Below recent swing low → around 0.7900 – 0.7910
✅ Summary:
Direction Entry (approx) Target 1 Target 2 Stop Loss
BUY 0.7920 0.7965 0.8010 0.7900

XAUUSD (Gold/USD) chart (1-hour timeframe)... XAUUSD (Gold/USD) chart (1-hour timeframe), here’s a breakdown of what’s visible:
Price has broken below an ascending trendline and dropped into the Ichimoku Cloud.
My marked target point below, around the 4,100–4,120 zone.
Current price: ≈ 4,217 USD.
Cloud support seems to extend down to roughly 4,100–4,080, and the horizontal support line drawn near the bottom confirms that area as the next target/support level.
✅ Technical Summary (from chart):
Trend: Short-term bearish correction.
Immediate support/target: ≈ 4,100–4,080.
Resistance: Around 4,260–4,285 (top of cloud / broken trendline retest).
📉 Target:
> 🎯 4,100 – 4,080 zone
That’s my likely downside target if price continues following the bearish momentum and cloud support break setup.

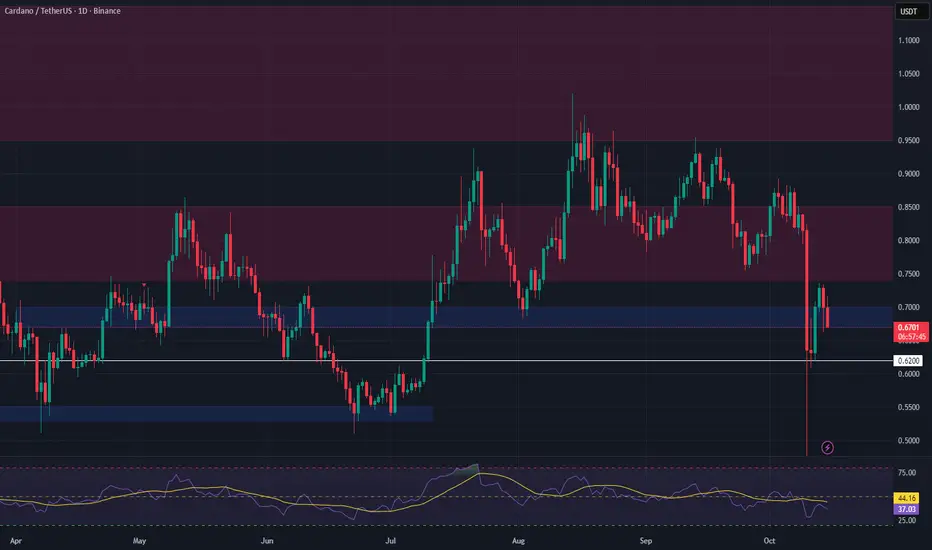
ADA Approaching Major Support – Spot Long Setup in ProgressCardano (ADA) is trending down toward a critical support zone at $0.67–$0.70, which could offer a low-risk entry for a laddered spot long position. The broader crypto market remains cautious, and near-term direction is still unclear—so position sizing and disciplined execution are essential.
🎯 Plan of Action:
Entry Zone: $0.67–$0.70 support, with staggered buys to improve cost basis.
Confirmation Required: Wait for signs of stabilization (e.g., bounce, volume support) before adding further.
Avoid chasing rallies if they lack volume follow-through.
📊 Targets & Risk Management:
Take Profits in Tiers:
First zone: $0.74–$0.85
Second zone: $0.95–$1.15
Stop Loss: Just below $0.62, invalidation of the support structure.
Keep allocation modest—ADA is still in a volatile downtrend.
💡 Reminder: This is a technical setup, not a prediction. Let the chart lead the decision, and stay adaptive to market conditions.