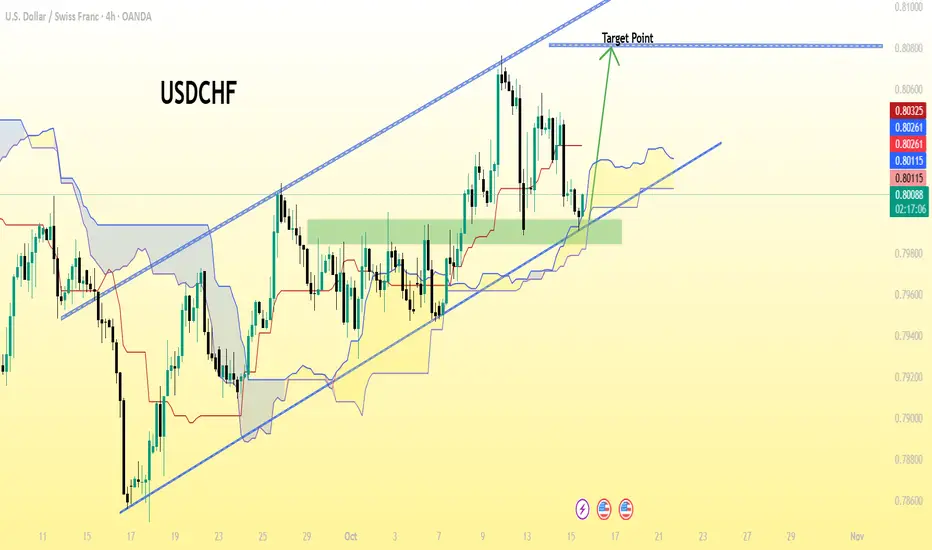
USD/CHF (U.S. Dollar vs. Swiss Franc) on the 4-hour timeframe...USD/CHF (U.S. Dollar vs. Swiss Franc) on the 4-hour timeframe.
From my chart :
The price is moving in an ascending channel.
A green support zone has been marked near 0.8000 – 0.8020.
The upper trendline of the channel is marked as the “Target Point.”
That line aligns approximately with 0.8080 – 0.8090 on the chart.
📈 Potential target area: 0.8080 – 0.8090
⚠ Note:
This is a technical projection based on the channel breakout/continuation pattern visible on my chart.
Price can fluctuate due to news or macroeconomic factors.
Always manage risk with stop loss — in this chart, a stop might logically sit below the support zone (~0.8000).
Crypto
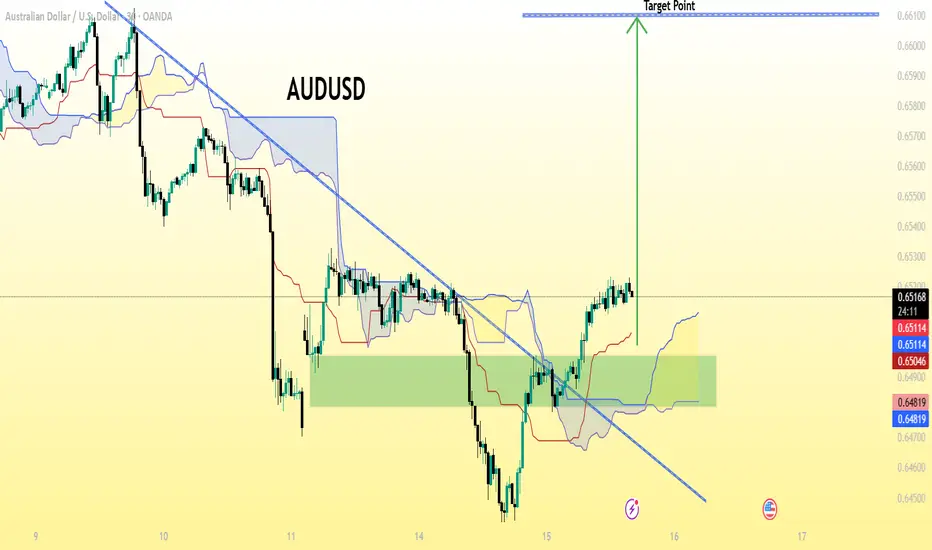
AUD/USD on a 30-minute timeframe (based on the visible labels)..AUD/USD on a 30-minute timeframe (based on the visible labels). Let’s break it down carefully:
The pair AUD/USD is currently trading around 0.6518.
The chart shows a bullish breakout above a descending trendline.
The green zone marked looks like a demand/support zone.
A target line is already drawn near the top of the chart, labeled “Target Point”.
🔍 Based on the chart:
The “Target Point” appears to be at approximately 0.6600 – 0.6605 level.
🧭 Summary:
Type Level
Entry Zone Around 0.6500–0.6520
Target (TP) 0.6600 – 0.6605
Stop Loss (SL) Likely below the green zone, around 0.6480
💡 Interpretation:
This setup seems to be a breakout + retest trade idea where the expectation is that AUD/USD will move upward about 80–100 pips toward the 0.6600 target area.
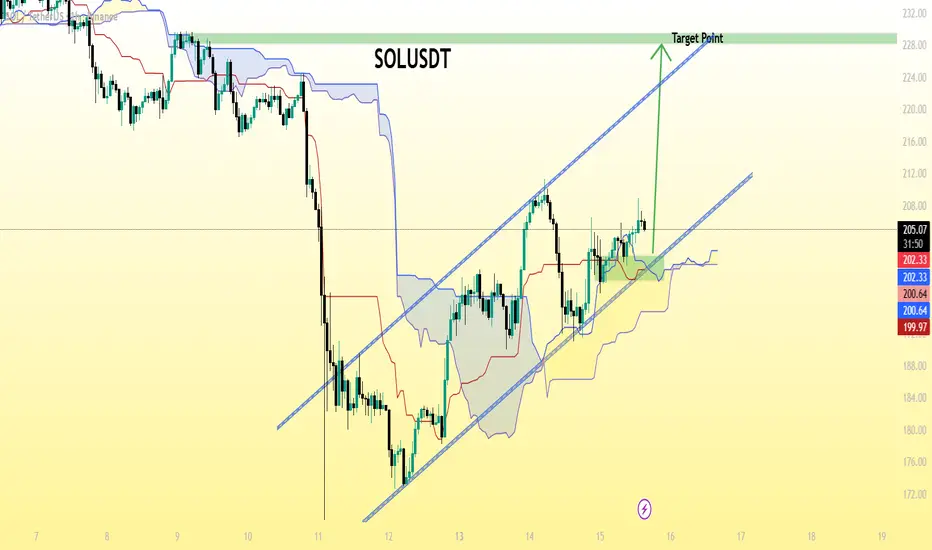
SOL/USDT chart pattern..SOL/USDT
The current price is around 205.5 USDT.
There’s a clear ascending trendline (blue line).
A breakout setup is indicated, with a marked “Target Point” near the top of the chart.
That target level appears to be around 230 USDT — the horizontal green line my labeled “Target Point.”
✅ Summary:
Current price: ≈ 205.5
Target price: ≈ 230 USDT
Upside potential: about +12% from the current level.
⚠ Note: Watch for support around 200–202 USDT (the Ichimoku cloud zone). If SOL holds that level, continuation toward 230 looks likely. A breakdown below the trendline could invalidate the move.
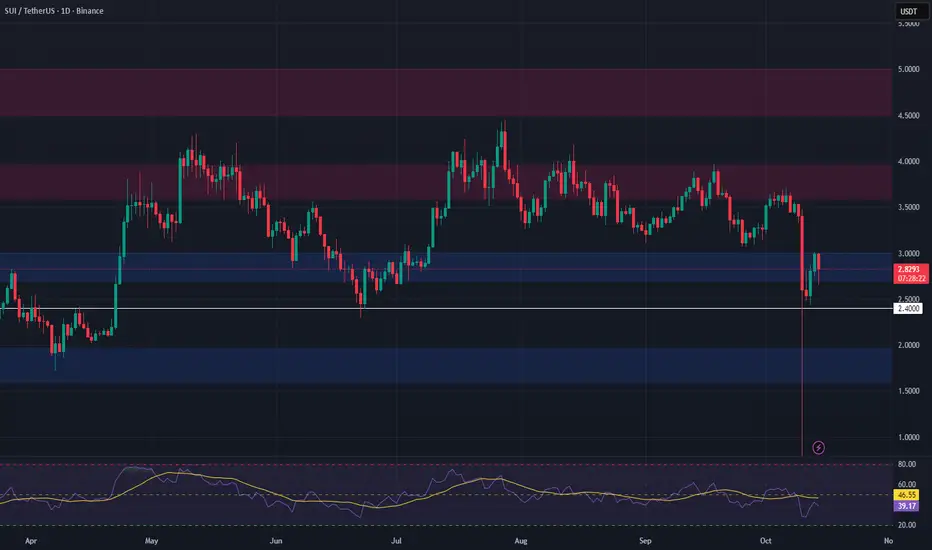
SUI – Swing Trade Setup from Key Support ZoneSUI is currently trading in a major support zone between $2.70 and $3.00, a level that has previously acted as a strong demand area. The price is consolidating here, and this could offer a high-probability long opportunity for swing traders watching for a potential bounce.
📈 Entry Zone: $2.70 – $3.00
🎯 Take Profit Targets:
• TP1: $3.60 – $3.95
• TP2: $4.50 – $5.45
🛑 Stop Loss: $2.40
ALGO Swing Trade Setup — Support Bounce OpportunityWe see a strong support zone forming around $0.186 – $0.195, which has been tested multiple times in the past. This area is acting as a potential springboard for a bullish reversal.
If price respects this zone, we may see momentum carry ALGO upward toward key resistance areas.
Entry Zone: $0.186 – $0.195
Target 1: $0.225 – $0.26
Target 2: $0.285 – $0.33
Stop Loss: Just below $0.18, invalidating the setup if price breaks lower

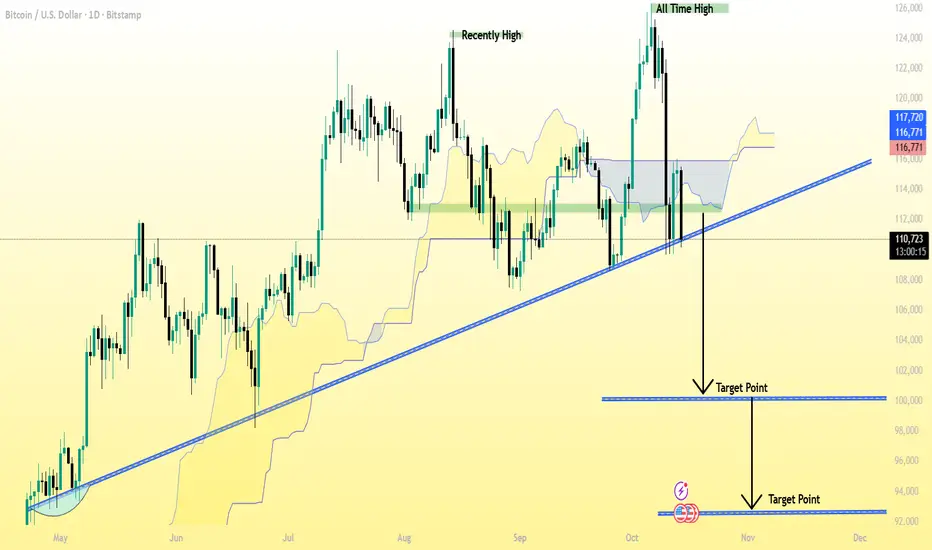
BTC/USD (Bitcoin) 1D (Daily) chart Pattern.BTC/USD (Bitcoin) 1D (Daily) chart 👇
✅ Current Price: around $110,685
✅ Trend: Bearish breakdown — price has clearly broken below the long-term ascending trendline.
✅ Market structure: After rejecting near $117,000, BTC dropped below both the Ichimoku cloud and the trendline — confirming downside pressure.
---
🎯 Target Levels (Downside)
1. Primary Target: $100,000 – $98,000
This matches my first marked “Target Point”.
It’s a strong historical support zone and aligns with previous price consolidation.
2. Extended / Final Target: $94,000 – $92,000
This is the second target point shown on my chart.
It would be the next major support if BTC continues falling after $98,000 breaks.
---
🛡 Resistance / Stop-Loss
Immediate resistance: $113,000 – $114,000 (broken trendline retest zone).
Stop-loss for short trades: above $115,000 – $116,000 (invalidates bearish setup).
---
🔍 Summary
Trend bias: Bearish (break of trendline + below cloud)
Sell zone: $111,000 – $113,000
Target 1: $100,000 – $98,000
Target 2: $94,000 – $93,000
Stop-loss: above $115,000
BTCUSD and ETHUSD BTCUSD and ETHUSD could not break the hurdle and formed nearly a triple top pattern. Some reversal has been seen. Maybe could fall some more. One should consider co-relating it with the trend of Gold and find entry opportunities in Crypto (just as a hedge in my view).

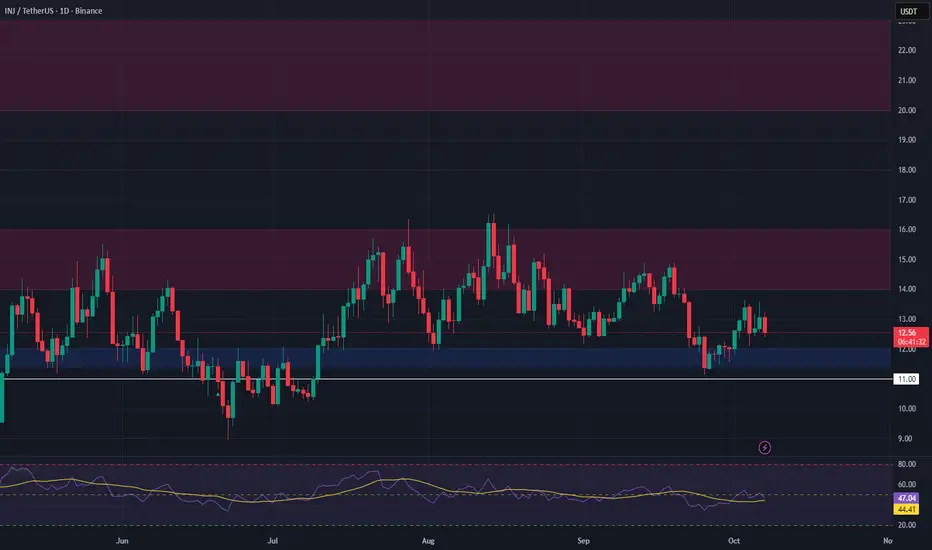
INJ Spot Trade Setup – Waiting for PullbackINJ has been rejected at resistance, and we are now watching for a pullback into the $11.40 – $12.00 support zone. This level has acted as a strong support area in the past and may offer a good entry point for a long spot position.
🔹 Entry Zone: $11.40 – $12.00
🔹 Take Profit Targets:
• TP1: $14.00 – $16.00
• TP2: $20.00 – $23.00
🔹 Stop Loss: Below $11.00 (conservative SL placement)
BNB 400% up from our Entry People laughed when I said CRYPTOCAP:BNB will hit $2000–$3000.
but people still doubt my $2000–$3000 targets? 🤔
From 1st Entry of this bull run: +400% ( TP1 ✅ )
From $500 re-entry: +120%
You can doubt targets, but not momentum.
Just don’t forget — book profits.
Because trading without a safe zone = casino mode.
Not Financial Advice

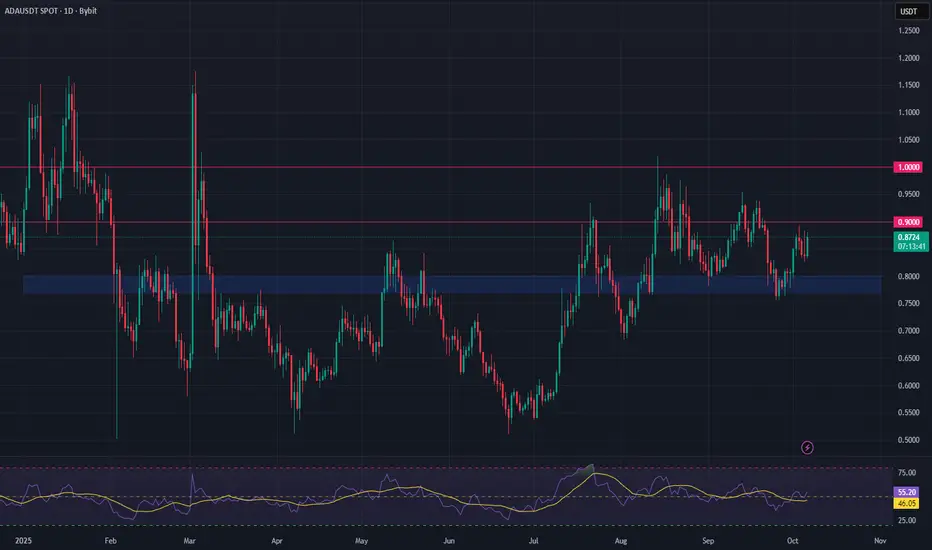
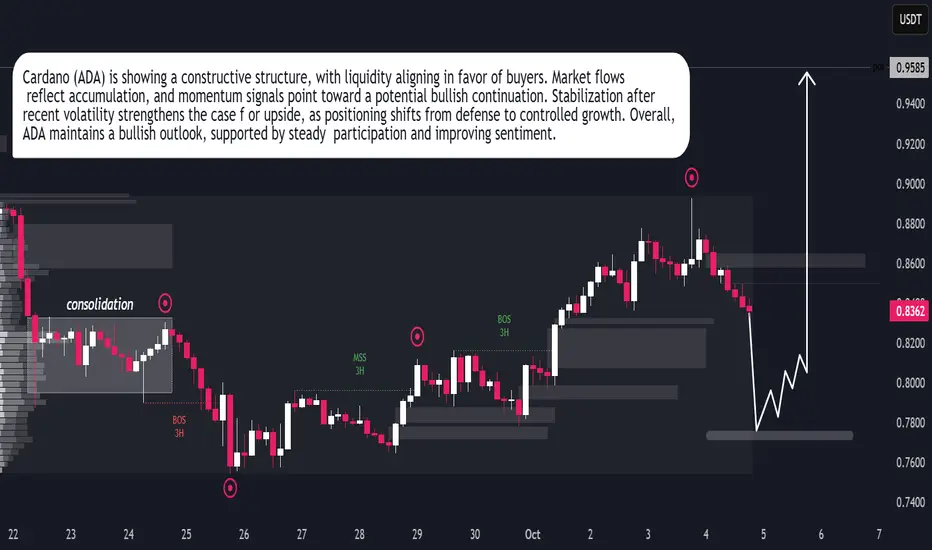
Cardano (ADA) – Bulls Regain Control, Eyes on $0.90 BreakoutCardano had a strong week, managing to hold above key support at $0.77 and closing with a bullish weekly candle. This price action signals a shift in momentum, with buyers back in control.
However, ADA now faces a critical test: the $0.90 resistance level. So far, bullish momentum hasn't been strong enough to force a breakout, but with the broader market showing strength, this level may not hold for long.
A confirmed breakout above $0.90 would be significant, opening the path for a potential move above $1 — a level not seen since mid-2022.
Looking forward, October has started with a strong bullish tone across the crypto market. If this continues, Cardano could be positioned for a fresh rally, provided bulls can take out the $0.90 resistance.
📌 Key Levels to Watch:
Support: $0.77
Resistance: $0.90
Target if breakout confirms: $1+
🟢 Bias: Bullish above $0.77
🔴 Risk: Failure at $0.90 could lead to a retest of support
XRP Breaks Above $3 – Bullish Momentum BuildsOverview:
XRP has officially closed the week above the $3 mark, a psychological resistance now turning into support. This is a major technical shift suggesting renewed bullish control.
🔑 Key Levels to Watch:
Support: $3.00
Short-Term Target: $3.20
Major Resistance / Magnet: $3.60 (All-Time High)
📊 Market Structure:
XRP appears to be breaking out of a consolidation zone between $2.70 and $3.00. This range held for several weeks, and a clean breakout could fuel a strong continuation toward previous highs.
🐂 Bullish Scenario:
Continued higher highs with volume could open the path to $3.20 and eventually $3.60.
A successful retest of the $3 level as support would further validate the breakout.
⚠️ Risk Note:
Watch for any fakeouts or low-volume rallies. A drop below $3 would negate the breakout and put the $2.70 support back in play.
📅 Outlook:
With Q4 2025 underway, a rally toward the ATH at $3.60 could be driven by both technical momentum and market sentiment.
💬 What’s your take? Are we heading for a new ATH this quarter?
📌 #XRP #Crypto #Altcoins #Breakout #TechnicalAnalysis #Q4Outlook

Cardano (ADA) Ready for Bullish ExpansionCardano (ADA) Ready for Bullish Expansion
Cardano (ADA) is building strength as market conditions favor accumulation over distribution. Liquidity behavior shows steady inflows, suggesting participants are positioning for upward continuation. The recent stability reflects confidence, with sentiment gradually tilting toward growth. Momentum indicators align with this view, reinforcing the prospect of a bullish expansion phase. ADA’s structure signals resilience, and the market tone supports the case for sustained upside in the near term.
Bitcoin – Let’s Play the Resistance Game at 114,500Bitcoin on the 1-hour chart has entered a critical resistance zone around 114,200–114,500. Price has rallied strongly from the recent lows near 113,000, but now faces a major supply area. The structure suggests that BTC could face rejection here and move back toward the support zone near 112,600 if sellers step in.
As long as price stays below 114,500, this resistance remains valid. A clean breakout above this level with strong momentum would invalidate the bearish view and open the path for higher levels. On the downside, holding support near 112,600 will be key for buyers to maintain control.
Disclaimer: This analysis is for educational purposes only and should not be taken as financial advice. Please do your own research or consult your financial advisor before investing.
Analysis By @TraderRahulPal (TradingView Moderator) | More analysis & educational content on my profile
👉 If you found this helpful, don’t forget to like and follow for regular updates.

BTC Market Update – Bullish Trend RebuildingBTC Market Update – Bullish Trend Rebuilding
The market structure on Bitcoin highlights a sequence of expansion, consolidation, and sharp corrective phases. After reaching a peak around 115,000, the price shifted into a prolonged sideways phase, where liquidity built up before a decisive breakdown. This breakout introduced stronger bearish momentum, driving price toward lower ranges.
Currently, Bitcoin is stabilizing around 109,500 after the decline, with price action suggesting a potential extension into deeper liquidity zones near the lower range before regaining upward momentum. The projected flow reflects a scenario where downside movement acts as a liquidity sweep, providing the conditions for buyers to re-engage.
The broader outlook remains constructive. Even with short-term pressure favoring the downside, the long-term structure still supports recovery potential. A strong reaccumulation phase could lift Bitcoin back toward the 115,000 zone, aligning with the market’s tendency to reclaim imbalance after periods of sharp displacement.

DOGEUSDT Forecast: Correction Near EndDogecoin has cycled through an aggressive expansion phase followed by distribution and a clear corrective sequence. The strong rally earlier in September reached exhaustion after buyers failed to sustain momentum, leading to a controlled decline. This retracement phase has pushed price back toward levels where market participants are reassessing risk and value.
Recent flows highlight reduced seller dominance, with price beginning to display characteristics of absorption. Market behavior suggests that liquidity is being tested, creating conditions where a potential recovery phase could emerge. Historical Dogecoin cycles often show this pattern: rapid expansions, corrective cooling, then renewed accumulation before the next impulse.
BTC Crashes to 3-Week Low: A True Nerve Test for TradersHello fellow traders, Bitcoin has entered an extremely tense phase!
BTC has slipped below 109,000 USD, marking its lowest point in three weeks. The main pressure comes from the looming expiry of a massive 22-billion-USD options contract at the end of the month, which is driving strong short-term selling.
On the daily chart, prices keep getting rejected at the downtrend line and the Ichimoku cloud, confirming that bears still hold the upper hand.
The current scenario points to further downside, with key support zones at 104,000 USD (TP1) and 98,900 USD (TP2).
These are the critical “do-or-die” levels to watch closely — only if BTC manages to hold above them can we expect a recovery once the options-driven selling pressure eases.
In short: Bitcoin is at a make-or-break moment. Traders, keep your stops tight and stay alert!

ETHUSDT: Strong Uptrend with Solid SupportETHUSDT is currently experiencing a strong uptrend driven by the stability of the cryptocurrency market and strong fundamental factors. Despite some recent pullbacks, the primary trend remains bullish, supported by a solid foundation and positive investor sentiment.
Technical Analysis: ETHUSDT is currently testing a key support level at 3,985. If this level holds, there is a high probability of a rebound and continued upward momentum. The next resistance level is expected at 4,215.
Trading Strategy: If the price stays above the support level at 3,985, ETH is likely to continue rising towards the next resistance levels.
Outlook: Given the current fundamentals and technical indicators, ETHUSDT is likely to maintain its upward trajectory and target the 4,215 resistance level in the near future.

Gold Neowave Stuctural UpdateNamaskaram Everyone
Welcome to intelligent investor, we provide market insights by synchronising and combining all the price action waves from different time frames and gives you single trend.
How To Read My Charts...Click Below
FX:XAUUSD FX:XAUUSD OANDA:XAUUSD MCX:GOLD1!

BTC/USD: Bearish Trend After Flash Crash and Key NewsThe BTC/USD chart shows a strong bearish trend following the "flash crash" event and contract liquidations. Currently, BTC is moving within a downward channel with support levels at 110,300 USD and 108,000 USD.
News Impact:
Morgan Stanley to Offer Crypto Trading: Morgan Stanley’s partnership with Zerohash to provide crypto trading on E*Trade could boost cryptocurrency acceptance, but it's not enough to reverse the bearish trend in BTC.
Fed Chairman Jerome Powell on Interest Rates: Jerome Powell's statements regarding the possibility of maintaining high interest rates have increased uncertainty, negatively impacting the cryptocurrency market.
Conclusion: The bearish trend of BTC/USD may continue. Traders should pay attention to support levels and stay updated with economic news to make informed trading decisions.

BTC/USDT Outlook – Volatility Rises After Sharp DeclineBTC/USDT Market Report
Bitcoin recently faced heavy selling pressure, pushing the market into a sharp decline. This drop reflects a shift in sentiment where earlier stability has been replaced by increased volatility and downside momentum.
Price action shows signs of exhaustion after the fall, suggesting the possibility of a short-term rebound attempt. However, broader behavior still reflects uncertainty, with buyers needing stronger participation to shift momentum back in their favor.
If downward pressure continues, deeper corrections could emerge before any meaningful recovery. In the near term, traders should expect sharp swings as the market tries to stabilize.

Bitcoin Market Report – Liquidity Grabs Before Next ExpansionThe market is showing clear signs of engineered volatility, with strong impulsive moves followed by rapid retracements. This behavior reflects liquidity targeting, where price sweeps both sides before resuming its broader path.
Current conditions suggest Bitcoin is in a redistribution stage, with momentum alternating to trap short-term participants. The repeated liquidity grabs signal that larger players are accumulating positions while clearing out weaker hands.
The overall structure points to continued testing of lower liquidity pools before any major directional expansion. Once this phase is complete, the market is likely to enter a more decisive trend, supported by the buildup of institutional flow and reduced volatility pockets.
In short, Bitcoin is cycling through liquidity collection and preparation, positioning itself for a larger move as market balance shifts.

Solana Price Forecast | SOLUSDT Market OutlookSOLUSDT has completed a strong upward cycle and is now unwinding through a structured retracement. This phase is not showing disorderly selling but rather a controlled reset, where liquidity is being cleared to prepare for the next expansion.
The chart reflects a market that is cycling through accumulation, breakout, and pullback phases with consistency. Current downside movement is shaping a foundation zone that could serve as the springboard for renewed upward momentum.
Overall, the asset is displaying a constructive trajectory: corrections are functioning as fuel rather than weakness, pointing toward continuation of its broader growth path once this reset stabilizes.

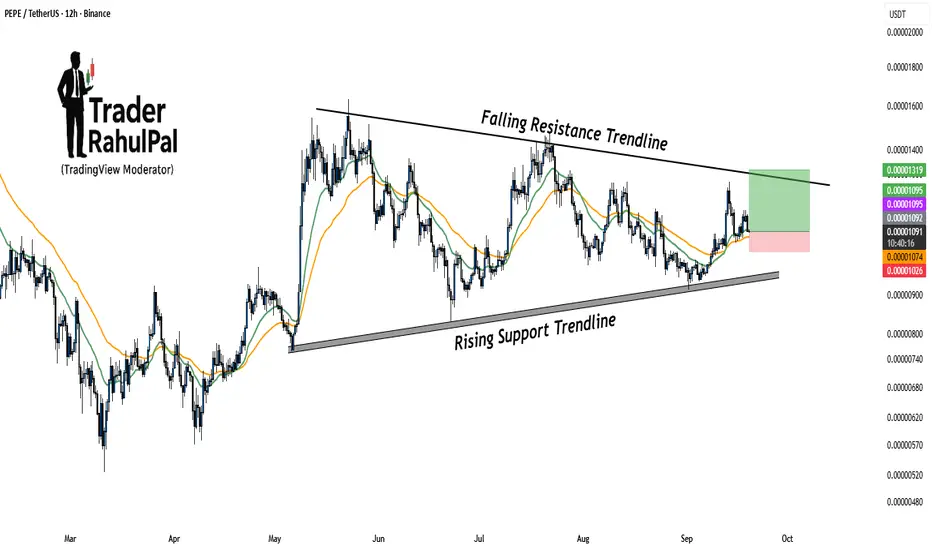
PEPE Getting Ready for a Big Move – Breakout Loading!PEPE is trading within a well-structured range, bounded by a rising support trendline and a falling resistance trendline . This setup indicates that the price is getting squeezed, and a decisive breakout move may be coming soon.
Currently, the price is holding above key moving averages, which adds strength to the bullish bias. As long as the rising support trendline remains intact, buyers will continue to defend dips. A breakout above the falling resistance could trigger a sharp move higher, targeting the next resistance levels near 0.00001319 .
On the downside, if price fails to hold above the rising support, we may see a deeper pullback toward 0.00001074–0.00001026 levels. Traders should closely watch how PEPE reacts near the falling resistance line in the coming sessions.
Disclaimer: This analysis is for educational purposes only and should not be taken as financial advice. Please do your own research or consult your financial advisor before investing.