HYPE Long Swing Setup – Approaching Key Support ZoneHYPE is under pressure but now nearing a major support level, presenting a potential opportunity for a bounce. We’re eyeing the $39.00–$40.00 zone for a long entry as buyers may step in at this key area.
📌 Trade Setup:
• Entry Zone: $39.00 – $40.00
• Take Profit Targets:
o 🥇 $42.18
o 🥈 $43.90
• Stop Loss: Daily close below $38.31
Crypto

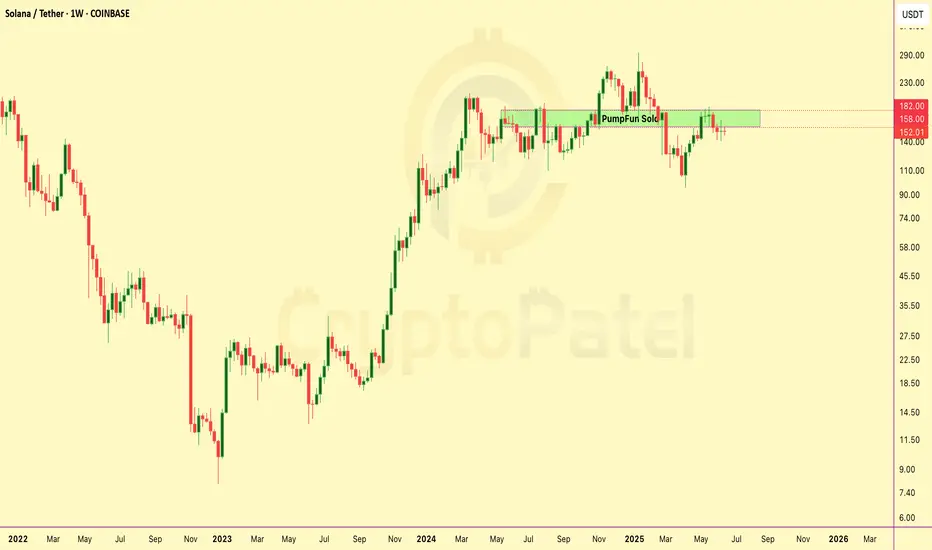
Pump.fun Sells $741M in SOL After X Suspension – What’s Really?Pump.fun Sells $741M in SOL After X Suspension – What’s Really Happening?
PumpFun (@pumpdotfun), a popular Solana-based meme token launch platform, was recently suspended from X — but they’ve been making major moves behind the scenes.
Since May 19, 2024, the platform has sold around 4.1 million SOL, worth nearly $741 million, at an average price of $180.
Here’s the full breakdown:
🔹 264,373 SOL sold for $41.64 million USDC at $158
🔹 3.84 million SOL, worth $699 million, sent to Kraken at $182
Why is Pump.fun selling so much?
Is this an exit strategy, or are they just managing risk?
ZKJ COIN DUMPING HARD — What’s REALLY Going On?ZKJ COIN DUMPING HARD — What’s REALLY Going On?
The price of Polyhedra Network’s $ZKJ has dropped sharply — falling over -87% in just a few days. But what’s really causing this?
A big reason is the token unlock on May 19 — over 15.5 million ZKJ tokens (worth around $30 million) were released into the market. That’s a lot of new supply, and many holders started selling.
At the same time, trading volume fell by 40%+, meaning fewer buyers and more pressure on price.
In total, ZKJ is down about 95% from its all-time high — and panic selling made things worse.
But here’s something most people are missing:
The project itself is still strong.
They have partners like Google Cloud, Revolut, Bima
zkPyTorch is live
📅 Heads up: Another big unlock is coming on June 19, so stay alert!

BTC Near $100K – Breakdown or Bounce?BTC Near $100K – Breakdown or Bounce?
BTCUSD – Will Bitcoin Hold ₹100K Support Equivalent? Signs of Weakness Amid Global Caution
🧭 Global Market Context
Bitcoin is facing some serious resistance after failing to hold above the $108K zone. And just as Indian markets react to global cues, BTC is showing signs of stress too.
🔺 US bond yields are climbing again – bad news for crypto risk appetite
🧊 Spot Bitcoin ETFs continue to attract inflows, but not strong enough to push new highs
💵 The US Dollar (DXY) is gaining strength again as investors flee risk — and that puts pressure on Bitcoin
Add to that the recent institutional sell-off, and it’s clear: BTC may need to “cool off” before another rally.
📉 Technical Picture (1H)
Bitcoin is showing a classic lower-high, lower-low pattern. A clear downtrend is in motion:
Price is below all key EMAs (34/89/200), with every rally being sold off
Important resistance sits at 106,000 – 107,000
Major support levels are now at 102,821, then 101,539, and if pressure continues — 100,419 (₹83+ lakh level for reference)
Momentum indicators like RSI are flat. No strength yet. And without a solid bullish candle from support, buyers may stay away.
🔎 Strategy Plan for Indian Traders
🔻 Short-term SELL Setup
Entry: 106,000 – 107,000
SL: 107,500
Targets: 102,821 → 101,539 → 100,419
🧠 Ideal for short-term traders looking to follow the trend
🔹 Medium-term BUY Setup (only if price reacts from 100K zone)
Entry: 100,500 – 100,800
SL: 99,800
Targets: 102,800 → 104,400 → 106,000
⚠️ Wait for bullish confirmation — avoid bottom fishing blindly
📌 Final Thought
Bitcoin is in a danger zone right now. If it loses grip on $100K support, we may see panic selling from leveraged traders. But this zone also holds opportunity — a strong bounce could spark a fresh rally.
🧘 Trade with patience. Don't chase. Let the market come to you.

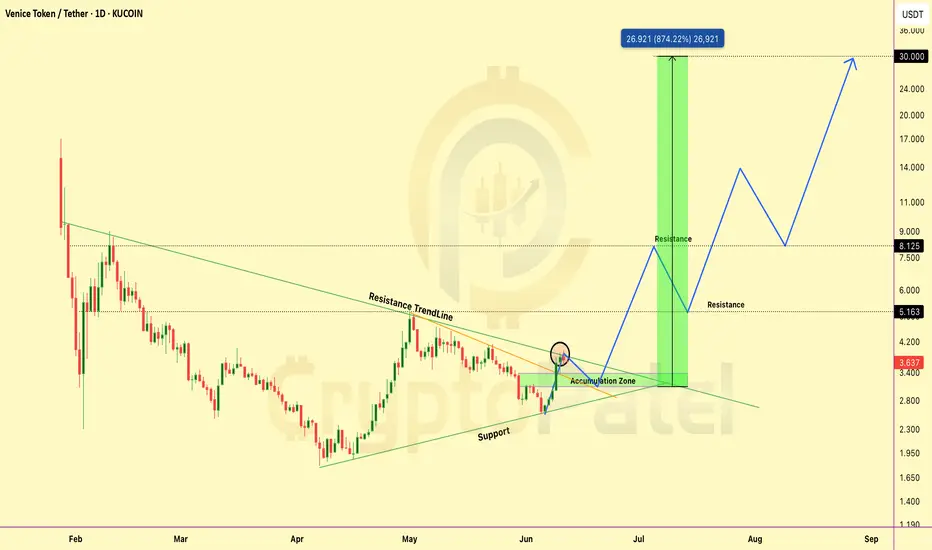
Is VVV The Next 10x RWA Play? Breakout + Strong Fundamentals!VVV is starting to show one of the strongest setups on my radar right now.
Here’s why this could turn into a major long-term bullish play 👇
Technical Picture:
✅ Broke LTF (lower time frame) resistance trendline
✅ Now attempting to break HTF (higher time frame) resistance trendline
✅ Accumulation Zone: $3.40–$3
✅ Strong Support: ~$2.70
👉 If HTF breakout confirms → serious upside could follow.
My Long-Term Targets:
$5 → $10 → $20 → $30 🚀
Why VVV Is Bullish Fundamentally:
✅ Real-world utility → tokenized luxury + travel ecosystem
✅ Strong partnerships → hotels, luxury brands, travel services
✅ Scarce supply + clear token utility (staking, discounts, access)
✅ Aligns with major Web3 + AI + RWA narratives → a trend driving this cycle
✅ Still low market cap → high asymmetry → early opportunity
Summary:
👉 If HTF breakout confirms, this could easily become one of the top runners this year.
👉 Narrative + chart + fundamentals are all lining up perfectly.
🎯 Strategy: Accumulate within the zone, watch for breakout confirmation → hold for long-term targets.
👉 Keep this one on your radar.
Note: NFA & DYOR
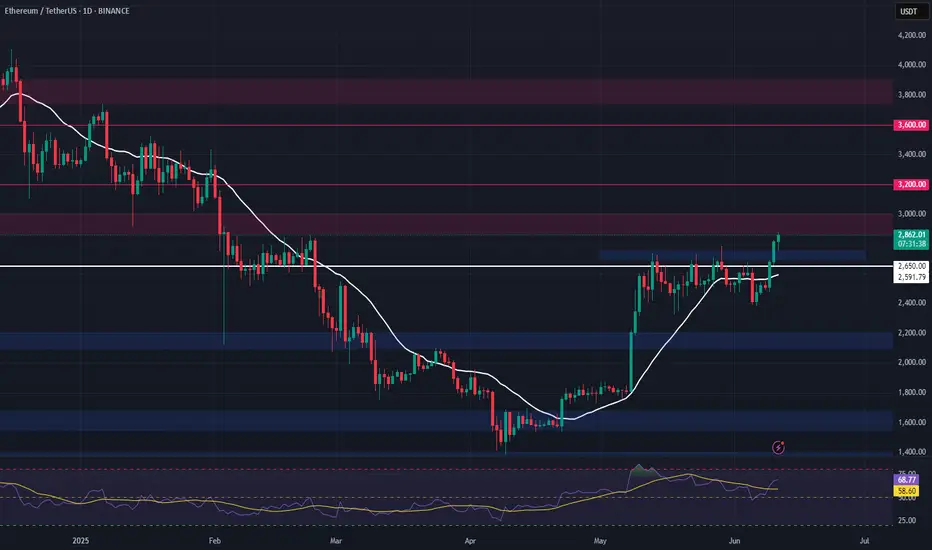
ETH Long Swing Setup – Breakout Retest of Key ResistanceETH has broken above the critical $2,750 resistance, signaling bullish momentum. We’re now watching for a retrace into the $2,700–$2,750 zone, which is expected to act as support for a continuation higher.
📌 Trade Setup:
• Entry Zone: $2,700 – $2,750
• Take Profit Targets:
o 🥇 $3,000
o 🥈 $3,200
o 🥉 $3,700
• Stop Loss: Daily close below $2,650
Why Is Hamster Kombat ($HMSTR) Dumping Hard?Why Is Hamster Kombat ($HMSTR) Dumping Hard? Here’s What’s Happening 👇
Hamster Kombat ($HMSTR) was one of the most anticipated airdrop tokens this year — but after going live, the token is now seeing a steep decline.
Here are the main reasons behind this big dump:
▶️ Massive Airdrop Sell Pressure
→ Over 131M users received free tokens
→ Many are selling immediately to lock in profits
→ Top wallets (insiders) are also unloading heavily
▶️ Weak Tokenomics
→ Circulating supply ~64B, max 100B
→ More tokens set to unlock = more selling expected
▶️ Community Frustration
→ Many users reported unfair airdrop mechanics
→ Only 88.75% unlocked at launch
→ Trust in the project took a big hit
▶️ Technical Issues
→ Telegram wallet & TON blockchain faced glitches during trading
→ Early trading experience was poor → More sell pressure
▶️ Tap-to-Earn Model Fatigue
→ The tap-to-earn hype is fading
→ Most players are cashing out, not holding or building
▶️ Bearish Chart Structure
→ Broke key support (~$0.00235)
→ No bullish signals yet — latest low ~$0.001214
Bottom line:
Right now, $HMSTR is following the typical pump & dump cycle we’ve seen with other tap-to-earn tokens. Until trust is rebuilt and real utility emerges, expect cautious trading ahead.
👉 Are you holding $HMSTR or watching from the sidelines?
#HamsterKombat #HMSTR #CryptoNews #CMC #Altcoins

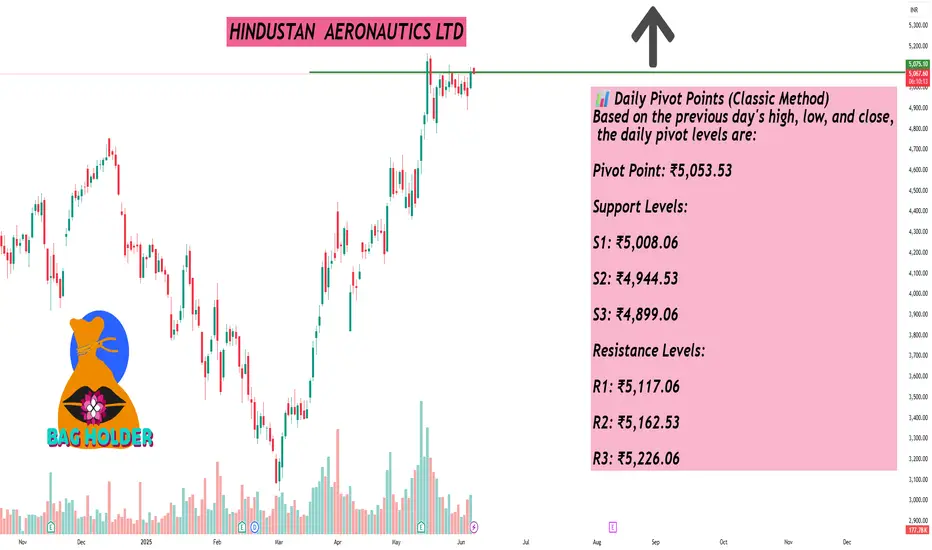
HINDUSTAN AERONAUTICS LTDAs of June 6, 2025, Hindustan Aeronautics Ltd. (NSE: HAL) is trading at approximately ₹5,071.60, reflecting a 2.25% increase over the previous day. Here's a detailed technical analysis focusing on daily support and resistance levels:
📊 Daily Pivot Points (Classic Method)
Based on the previous day's high, low, and close, the daily pivot levels are:
Pivot Point: ₹5,053.53
Support Levels:
S1: ₹5,008.06
S2: ₹4,944.53
S3: ₹4,899.06
Resistance Levels:
R1: ₹5,117.06
R2: ₹5,162.53
R3: ₹5,226.06
📈 Fibonacci Pivot Points
Using Fibonacci calculations, the levels are:
Pivot Point: ₹5,053.53
Support Levels:
S1: ₹5,011.90
S2: ₹4,986.17
S3: ₹4,944.53
Resistance Levels:
R1: ₹5,095.17
R2: ₹5,120.90
R3: ₹5,162.53
🔍 Camarilla Pivot Points
Derived using the Camarilla method:
Pivot Point: ₹5,053.53
Support Levels:
S1: ₹5,061.61
S2: ₹5,051.62
S3: ₹5,041.63
Resistance Levels:
R1: ₹5,081.59
R2: ₹5,091.58
R3: ₹5,101.58
📌 Trading Insights
Immediate Support: ₹5,008.06 (Classic S1)
Immediate Resistance: ₹5,117.06 (Classic R1)
Given the current price of ₹5,071.60, the stock is trading near its pivot point, suggesting potential for upward movement if it breaks above the immediate resistance. However, traders should monitor for any signs of reversal or consolidation around these levels.
Option Chain Analysis An option chain is a comprehensive listing of all available options contracts for a specific underlying asset, like a stock, index, or commodity, organized by strike prices and expiration dates. It's essentially a table that provides detailed information about call and put options for that asset, including strike prices, expiration dates, premiums, open interest, volume, implied volatility, and last traded price.

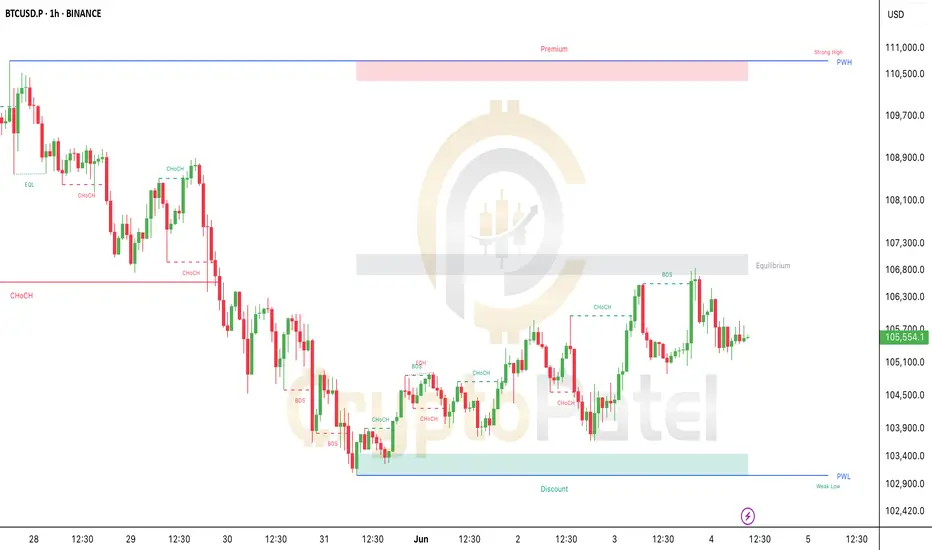
Breakout or Breakdown? BTC at Critical Level!Breakout or Breakdown? BTC at Critical Level!
#Bitcoin is showing early bullish signs after a clean reversal from the discount zone (~$103K).
We saw a CHoCH → BOS → Retest sequence play out perfectly!
Price is now consolidating just below a key supply zone (~$106.8K). This is the Equilibrium Zone – where smart money decides the next move.
🔹 As long as BTC holds above $104.2K, we stay bullish.
🔻 BUT – if we break below $103.4K, expect a deeper pullback, and we could even see Bitcoin drop under $100K for a proper liquidity sweep.
What’s Next?
If we reclaim $106.8K with strength, the next target is the Premium Zone around $110K–$111K, where major liquidity sits!
Watch for breakout or rejection – don’t FOMO. Patience = Profits.
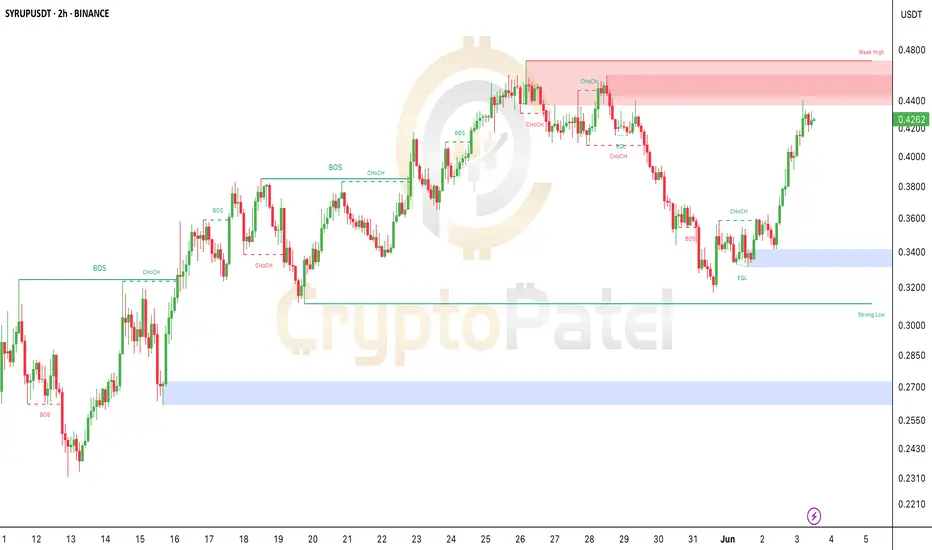
SYRUP/USDT About to Explode? Here’s What Smart Money is Doing!SYRUP/USDT About to Explode? Here’s What Smart Money is Doing!
After weeks of sideways action, SYRUP just flipped bullish from a strong demand zone near $0.34.
It broke structure, reclaimed key levels, and is now eyeing the $0.44–$0.46 weak high zone!
This move looks like a classic Smart Money re-accumulation setup — and it’s gaining momentum fast!
Key Signals:
✅ Strong CHoCH + BOS combo
✅ Equal lows protected (liquidity trap avoided)
✅ Massive green candles + volume spike
✅ Next resistance: $0.46 — if broken, clean sky above!
Watch Closely:
If price reclaims $0.4450 with volume, we might see a breakout rally!
Short-Term Target: $0.46+
Strong Support: $0.38 and $0.34 zones
Don’t sleep on this move! Track, set alerts, and trade smart.
Your edge is in the knowledge — not the hype.
NFA & DYOR
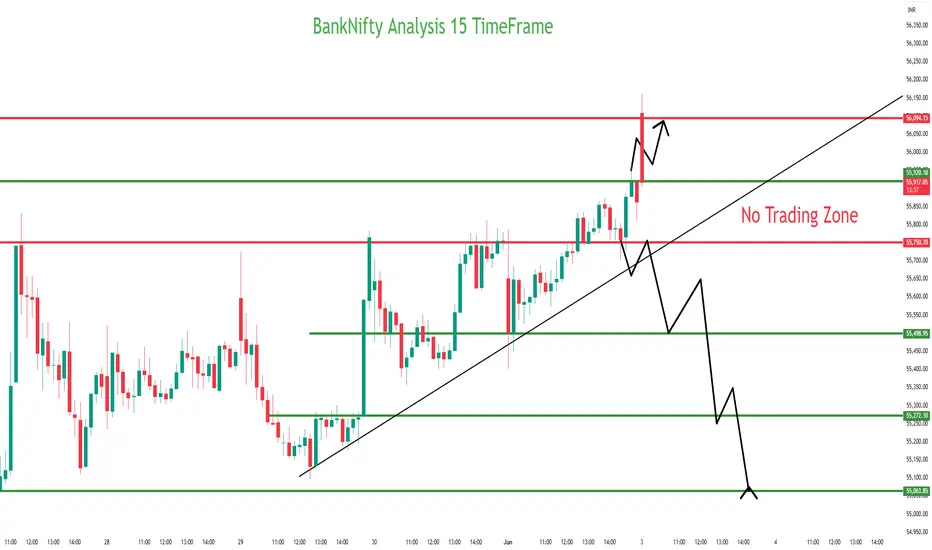
BankNifty Analysis 15 TimeFrame#Banknifty
BANKNIFTY INTRADAY ANALYSIS FOR
TODAY
Time Frame - 15 min.
Date 03/06/2025
That's my Analysis.
I do not give any advice about buying and selling. The information provided is for
educational purposes only. *
What is Relative Strength Index (RSI) ?The Relative Strength Index (RSI) is a momentum indicator used in technical analysis to measure the magnitude of recent price changes to evaluate overbought or oversold conditions in the market. It ranges from 0 to 100, with values below 30 generally indicating an oversold condition and values above 70 suggesting an overbought condition.

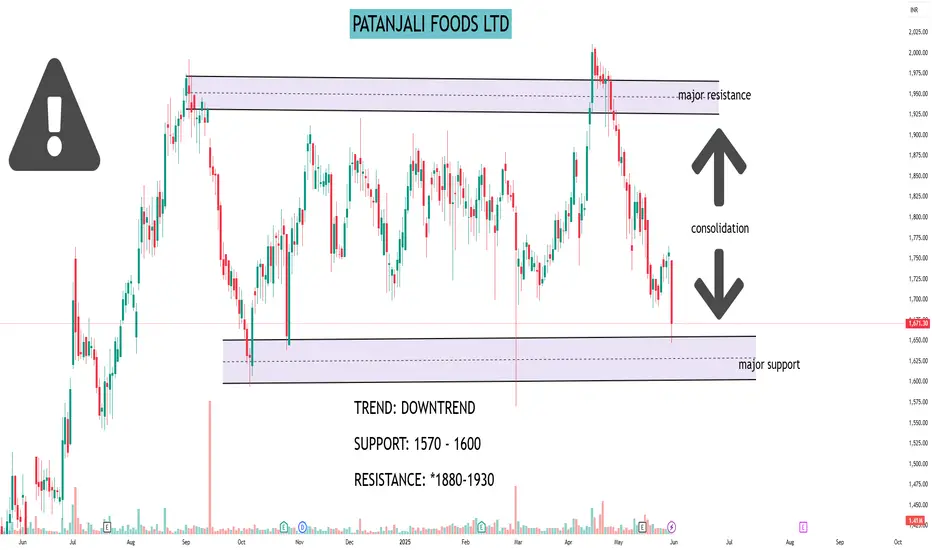
PATANJALI FOODS LTD#PATANJALI
STOCK NAME: PATANJALI FOODS LTD (NSE)
CHART ANALYSIS:
Price has broken out of a long consolidation range. Strong bearish candles indicate downside momentum. Ideal shorting opportunity for swing traders.
TREND: DOWNTREND
SUPPORT: 1570 - 1600
RESISTANCE: *1880-1930
TRADE:
SELL BELOW 1670
Target 1: *1620
Target 2: *1575
Target 3: *1520
Stop Loss: *1750
▲ I AM NOT SEBI REGISTERED. THIS IS ONLY FOR EDUCATIONAL PURPOSES.
$SUI Looks Super Bullish, But There’s a Catch!CRYPTOCAP:SUI Looks Super Bullish, But There’s a Catch!
SUI Network is heating up in this bull market, and yes — it could potentially reach $10… even $15–$20 long-term! 🔥
But here’s something you need to know 👇
🔓 Today, 44M CRYPTOCAP:SUI (~$143M) tokens got unlocked — that’s 1.32% of the circulating supply.
▶️ Only 33.87% of total supply is unlocked — meaning 66.13% is still locked with early investors and the team.
▶️ That’s ~$140M worth of tokens unlocking every month. This could put serious sell pressure on the price!
✅ I'm still bullish long-term, already holding from $0.50–$0.60.
▶️ If CRYPTOCAP:SUI drops to around $2.80, I’ll be buying more.
Short-term dip = Long-term opportunity?
Be smart. Track unlocks. Buy low. Think long.
NFA & DYOR

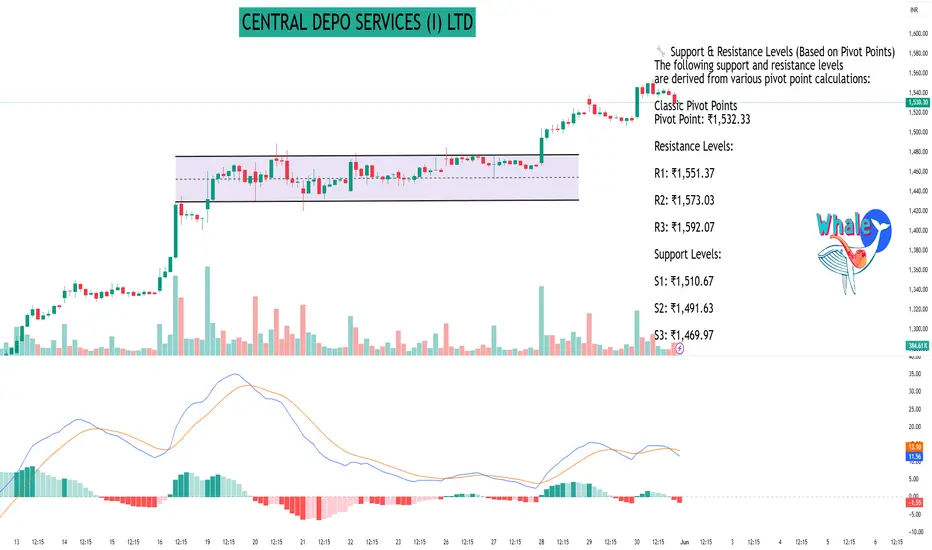
CENTRAL DEPO SERVICES (I) LTDAs of May 30, 2025, here are the 45-minute interval support and resistance levels for Central Depository Services (India) Ltd (NSE: CDSL), based on the latest available data:
📊 Current Price Snapshot
Last Traded Price: ₹1,529.70
Day’s Range: ₹1,513.30 – ₹1,554.00
52-Week Range: ₹917.63 – ₹1,989.80
Volume: 5,711,655 shares
VWAP: ₹1,539.78
Market Capitalization: ₹31,971 crore
Beta: 1.34
Dividend Yield: 0.82%
Book Value per Share: ₹73.16
Upper Circuit Limit: ₹1,664.30
Lower Circuit Limit: ₹1,361.70
🔧 Support & Resistance Levels (Based on Pivot Points)
The following support and resistance levels are derived from various pivot point calculations:
Classic Pivot Points
Pivot Point: ₹1,532.33
Resistance Levels:
R1: ₹1,551.37
R2: ₹1,573.03
R3: ₹1,592.07
Support Levels:
S1: ₹1,510.67
S2: ₹1,491.63
S3: ₹1,469.97
Fibonacci Pivot Points
Pivot Point: ₹1,532.33
Resistance Levels:
R1: ₹1,547.88
R2: ₹1,557.49
R3: ₹1,573.03
Support Levels:
S1: ₹1,516.79
S2: ₹1,507.18
S3: ₹1,491.63
Camarilla Pivot Points
Pivot Point: ₹1,532.33
Resistance Levels:
R1: ₹1,533.43
R2: ₹1,537.16
R3: ₹1,540.89
Support Levels:
S1: ₹1,525.97
S2: ₹1,522.24
S3: ₹1,518.51
📈 Technical Indicators Summary
Relative Strength Index (RSI): Data not available
MACD: Data not available
ADX: Data not available
Stochastic RSI: Data not available
Supertrend: Data not available
Parabolic SAR (PSAR): Data not available
🧭 Trading Outlook
Trend: Neutral to Slightly Bullish
Recommendation: The stock is trading near its pivot point, indicating a neutral stance. Traders should monitor for a breakout above R1 (₹1,551.37) for bullish confirmation or a breakdown below S1 (₹1,510.67) for bearish signals.
Option and Database Trading Examples of options data include information on the price, volume, and open interest of various options contracts, as well as details about the strike price, expiration date, and implied volatility.

PCR Trading part 2In the context of trading, PCR stands for Put-Call Ratio. It's a technical indicator used to assess market sentiment, specifically in the options market. The PCR is calculated by dividing the volume (or open interest) of put options by the volume (or open interest) of call options over a specific period.

SHOBHA LTD#SOBHA
Intraday stock for 30/05/2025
BUY
ENTRY:-1400
SL:-1385
TARGET:-1415
TARGET 2:-1430
Disclaimer:-All views are my personal and only for educational purpose.

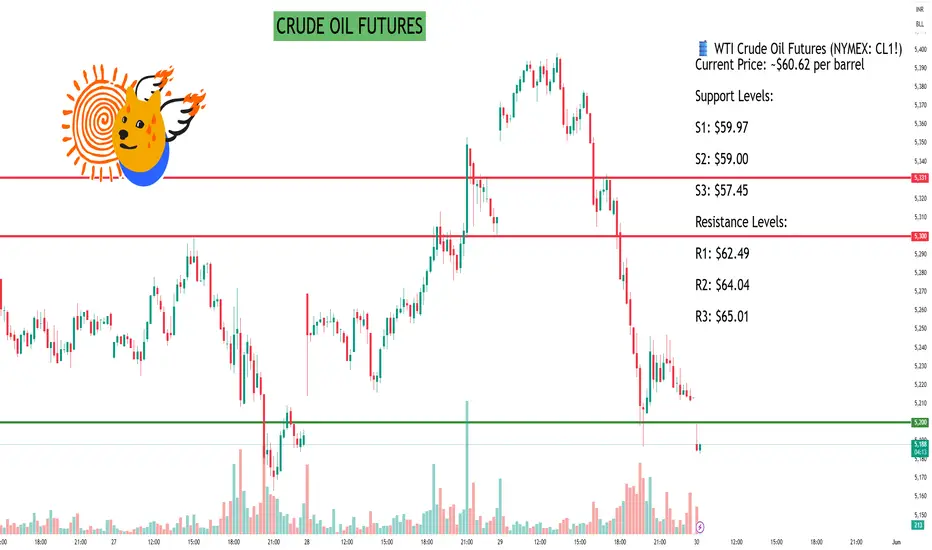
CRUDE OIL FUTURESAs of May 30, 2025, here are the latest 15-minute support and resistance levels for Crude Oil Futures:
🛢️ WTI Crude Oil Futures (NYMEX: CL1!)
Current Price: ~$60.62 per barrel
Support Levels:
S1: $59.97
S2: $59.00
S3: $57.45
Resistance Levels:
R1: $62.49
R2: $64.04
R3: $65.01
🇮🇳 MCX Crude Oil Futures (INR)
Current Price: ~₹5,191 per barrel
Support Levels:
S1: ₹5,153.33
S2: ₹5,092.67
S3: ₹5,031.33
Resistance Levels:
R1: ₹5,231.67
R2: ₹5,292.33
R3: ₹5,353.67
📊 Technical Outlook
Trend: Neutral to slightly bearish
Indicators: The 15-minute chart shows a potential for a bullish reversal, but confirmation is needed.
Strategy: Traders may consider watching for a breakout above resistance levels for potential long positions, or a breakdown below support levels for short positions.
GRASS–Long Swing Trade Setup After 80% Rally GRASS has seen a strong +80% move recently, and is now pulling back into a key support zone. This type of price action—post-rally consolidation at support—often precedes another leg higher, particularly if structure holds and momentum resumes.
🔹 Entry Zone:
$2.16 – $2.77 (support area & previous breakout zone)
🎯 Take Profit Targets:
🥇 $2.80 (recent high / range reclaim)
🥈 $3.50 (next major resistance zone)
🛑 Stop Loss:
$2.00 (just below structural invalidation level)
📌 Strategy Notes:
Volume surge confirms strong interest; this pullback could be accumulation.
Monitor for bullish engulfing or higher low confirmation on lower timeframes.
Maintain discipline with tight invalidation under $2.00.
If support holds and a reversal candlestick confirms, this could be a high-probability continuation setup. Let me know if you'd like a risk-reward breakdown or chart overlay!

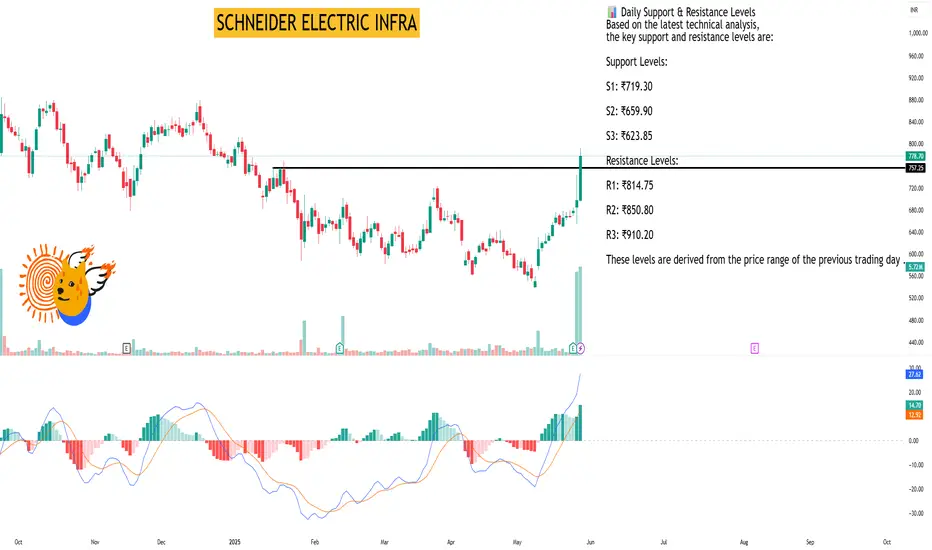
SCHNEIDER ELECTRIC INFRAAs of May 29, 2025, Schneider Electric Infrastructure Ltd. (NSE: SCHNEIDER) is trading at ₹778.70, reflecting an 11.57% increase over the past 24 hours .
📊 Daily Support & Resistance Levels
Based on the latest technical analysis, the key support and resistance levels are:
Support Levels:
S1: ₹719.30
S2: ₹659.90
S3: ₹623.85
Resistance Levels:
R1: ₹814.75
R2: ₹850.80
R3: ₹910.20
These levels are derived from the price range of the previous trading day .
🔍 Technical Indicators Overview
Relative Strength Index (RSI): 79.38 – Indicates overbought conditions.
MACD (12,26): 27.62 – Suggests bullish momentum.
ADX: 28.53 – Points to a strong trend.
Stochastic Oscillator: 90.63 – Suggests overbought territory.
Rate of Change (ROC): 25.57 – Indicates strong upward momentum.
Supertrend: 634.53 – Below current price, indicating bullish trend.
Parabolic SAR (PSAR): 646.47 – Below current price, supporting bullish sentiment.
These indicators collectively suggest a strong bullish trend for Schneider Electric Infrastructure Ltd. .
📈 Market Sentiment
The technical indicators collectively suggest a strong bullish sentiment for Schneider Electric Infrastructure Ltd. However, the RSI and Stochastic Oscillator indicate that the stock is in overbought territory, which may lead to a short-term correction. Investors should monitor the support and resistance levels closely for potential breakout or pullback scenarios.
Please note that stock market investments are subject to market risks, and it's essential to conduct thorough research or consult with a financial advisor before making investment decisions.
Why TONCOIN is Potential to hit $50?🚨 TON Is Silently Prepping for a Massive Bull Run — Are You In Yet?
While the market chases memecoins, TON is building real stuff — with real money, real users, and now even AI integration.
Here’s why TON could be the next CRYPTOCAP:SOL -like sleeper 👇
▶️ $1.5 Billion Raised via Bonds
Telegram raised $1.5B at a 9% yield — no token dump, no equity sale.
Just old-school bonds — and institutional giants like BlackRock & Citadel bought in.
This gives TON huge runway to:
✅ Build Infra
✅ Expand Ecosystem
✅ Onboard Millions of Users
▶️ TON x xAI (Elon Musk's Grok) 🤝
The TON Foundation just announced a partnership with xAI (Grok) — bringing AI-powered search and interaction inside Telegram.
Imagine Grok integrated with TON wallet, payments, and apps — AI + Blockchain + 900M users = Game changer.
This is real utility, not just another hype partnership.
▶️ Ex-Visa Exec Joins TON as VP of Payments
Nikola Plecas, who helped shape Visa’s crypto strategy, is now leading TON’s payment mission.
The goal? Bring crypto payments to the heart of Telegram’s global userbase.
Solana Pay & Lightning — watch your back 👀
▶️ Telegram Premium Hits 15M Paid Users
This isn’t just “users” — this is a monetized audience, ready for TON-powered payments, tipping, and apps.
TON isn’t building a user base — Telegram already has it.
▶️ TON Technical Analysis (TA)
We called the TON move at $2.50 — and it’s already 50% up!
Now it’s forming:
✅ Bullish Market Structure
✅ Higher Highs + Higher Lows
✅ Strong Bounced From demand zone
Next target short term? $5–$6
Bull Market Potential? $50–$70 easy, especially when altseason fully ignites 🔥
Why TON Could Be the Next Crypto Titan:
▪️ Backed by Telegram
▪️ Integrated into daily chat & apps
▪️ 900M+ users in waiting
▪️ AI partnership with Grok
▪️ Institutional money flowing in
▪️ Strategic hires and solid infra
TON is the dark horse of this bull market.
It doesn't shout. It ships.
Once TON wallets go live for all Telegram users...
Game over for most L1s.
Follow CryptoPatel for more early alpha before the herd wakes up.
And tell me — what’s YOUR price target for CRYPTOCAP:TON in this cycle? 👇
Note: This is Not Financial Advice so DYOR before investing.
