XRPUSDT - EYEING A BREAKOUT ABOVE KEY RESISTANCESymbol - XRPUSDT
XRPUSDT is attempting to break through the upper boundary of its trading range amid a broader bullish recovery across the cryptocurrency market. A confirmed breakout may occur following a minor pullback.
The market continues to absorb the liquidation impact from last few days, with Bitcoin showing structural recovery, suggesting a potential resurgence of bullish sentiment. This development supports a more optimistic outlook for the overall crypto market.
XRPUSDT is currently testing resistance and entering a phase of consolidation. The key breakout trigger lies near 2.661 However, during consolidation, a retest of support levels remains possible as the market may seek liquidity before a potential upward continuation.
Resistance levels: 2.661, 2.739
Support levels: 2.587, 2.500
Since the start of the session, momentum has been notably strong, though a brief correction could materialize before the upward movement resumes. Within this corrective phase, XRPUSDT may retrace toward the 2.587 – 2.500 zone to gather liquidity before potential continuation.
Cryptocurrencies

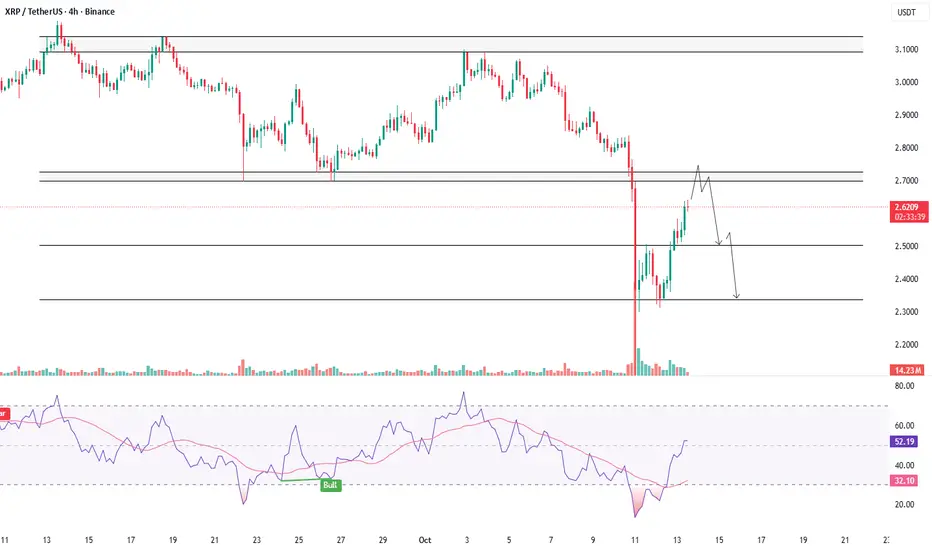
XRPUSDT - RETESTS RESISTANCE AFTER SELL-OFFSymbol - XRPUSDT
XRPUSDT is undergoing a corrective phase following a sharp sell-off. It remains premature to anticipate sustained growth without intermediate pullbacks, as the pair is approaching a major resistance zone.
The broader cryptocurrency market is showing signs of recovery after a period of heavy liquidations. Both BTCUSDT and XRPUSDT are nearing critical resistance levels, where a potential corrective movement could emerge.
From a technical perspective, after nearly two months of consolidation, the price broke below the established trading range, indicating a structural breakdown. As part of the current correction, XRPUSDT is retesting the liquidity zone between 2.7000 & 2.7266, which could serve as a trigger for renewed selling pressure.
Resistance levels: 2.7000 – 2.7266, 2.8286
Support level: 2.5050
A sharp advance without sufficient technical strength to surpass the 2.7000 resistance may lead to a false breakout, followed by a pullback toward the 2.5050 support zone.
ZECUSDT - HOLDING STRONG AMID MARKET WIDE LIQUIDATIONSSymbol - ZECUSDT
CMP - 267.18
ZECUSDT has demonstrated notable resilience amid the broader cryptocurrency market downturn, which triggered over $10 billion in long position liquidations. Even in such an environment, certain assets have managed to withstand the selling pressure.
The cryptocurrency market remains gripped by panic and widespread liquidations, with Bitcoin currently testing the 100K level under intense selling pressure. However, amidst this turmoil, a few altcoins have shown relative strength - ZECUSDT being one of them as it continues to climb and test key resistance zones.
ZEC experienced a sharp decline earlier but found strong demand near the high volume node around 145 - 155. The subsequent aggressive rebound indicates the presence of solid bullish interest at these levels.
Resistance levels: 280.30, 305.65
Support levels: 242.64, 208.76
Focus remains on the 280.20 trigger zone. If the current retest does not result in a deep pullback and price consolidates near resistance, the likelihood of a breakout increases substantially. A decisive close above 280.30 - 280.50 could open the path for a rally toward 305 - 345. That said, it remains a high-risk setup, and traders are advised to exercise caution and maintain tight stoploss.

ETHFIUSDT - BULLS ARE NOT DONE YET?Symbol - ETHFIUSDT
ETHFIUSDT is undergoing a corrective phase after updating its local high at 1.938 The breakout above the 1.677 zone appears to be an attempt to initiate a distribution phase following an extended period of consolidation. The key question now is whether the bulls can sustain control above this area.
Bitcoin is also in correction mode following a false breakout of its resistance level. In this context, the broader cryptocurrency market is experiencing a temporary decline. Nevertheless, the prevailing trend remains bullish, supported by a favorable fundamental outlook. Once the current correction concludes, market growth may resume.
On the daily timeframe, ETHFIUSDT is attempting to transition into a distribution phase after approximately five to six months of consolidation. The overall trend remains upward, and following the breakout of resistance, a corrective movement toward the liquidity zone at 1.677 is developing. A false breakdown, accompanied by a shift in market imbalance and subsequent consolidation above 1.678, could stimulate renewed buyer interest - potentially leading to further price appreciation.
Resistance levels: 1.898, 1.938
Support levels: 1.677, 1.534
The chart highlights two critical support zones - 1.677 and 1.534, Sustained bullish activity above the 1.677 level may result in a rebound and continued upward movement, confirming the ongoing distribution phase. Conversely, failure to maintain this level could prompt a retest of the zone at 1.534, where a liquidity sweep may subsequently trigger a new wave of buying pressure.

LTCUSDT - BULL TRAP IN MAKING?Symbol - LTCUSDT
CMP - 130.00
LTCUSDT is currently forming a distribution pattern following a period of local consolidation. The price is testing the resistance zone and exhibiting signs of a false breakout. However, it is important to note that the broader cryptocurrency market remains in a corrective phase.
At present, Bitcoin appears relatively weak, undergoing both a correction and short-term consolidation ahead of a potential continuation of the decline toward the 117K-116K range. Within this environment, the recent upward move in LTCUDST may be short lived and could transition into an aggressive decline if the price closes below the key resistance level.
This false breakout, or market manipulation relative to resistance, suggests that LTC’s current rally may represent a local bull trap, particularly amid broader market weakness. A breakdown could lead the pair toward the breakeven or liquidity zone between 124.10 & 115.30
Resistance levels: 132.00, 134.20
Support levels: 124.14, 115.36
A confirmed false breakout of the resistance zone, especially while the altcoin market continues to weaken, could indicate a liquidity grab prior to a deeper market alignment with Bitcoin’s broader correction. Consequently, confirmation of this pattern may serve as a signal for a potential downside move in LTCUSDT.

PENDLEUSDT - READY TO POP?Symbol - PENDLEUSDT
PENDLEUSDT appears to be transitioning from a phase of prolonged consolidation into a potential distribution phase. The coin is currently testing a significant resistance level, the breakout of which could initiate a renewed upward movement.
The price is exhibiting strength as it attempts to breach the upper boundary of the recent range. A sustained consolidation above the key level of 4.400 would suggest bullish continuation. Supportive macro conditions particularly the ongoing bullish momentum in Bitcoin are lending strength to the altcoin market. Should this trend persist, altcoins including PENDLEUSDT may follow suit, shifting from consolidation into broader distribution.
Key Resistance Levels: 4.320, 4.400
Key Support Levels: 4.024, 3.622
Should the price confirm a breakout by holding above the critical resistance level, this would likely signal the beginning of a more aggressive upward move. In such a scenario, a potential target lies near the 4.800 level.

BITCOIN - SYMMETRICAL TRIANGLE FORMING WITHIN A BULLISH TRENDSymbol - BTCUSDT
Bitcoin is consolidating. A symmetrical triangle pattern is forming within the context of a prevailing bullish trend. Based on the current technical setup, it is reasonable to interpret this consolidation as a preparatory phase for a continuation of the upward movement.
Fundamental nuances have gradually improved over recent weeks, contributing to a moderate revival in the cryptocurrency market. From a technical standpoint, the market structure on the daily chart appears constructive. Following a period of strong upward momentum, the price has entered a consolidation phase rather than showing signs of reversal. The overall market remains bullish. After approximately 2–3 weeks of consolidation, a bullish distribution pattern appears to be developing. This cycle has repeated on two previous occasions. On the daily timeframe, the presence of extended lower wicks during the consolidation phase suggests that large market participants (whales) are actively absorbing downward pressure, thereby preventing the price from entering risk zones. Accordingly, it is likely that the current consolidation could persist for a time, and there remains the possibility of a retest of the triangle’s lower boundary or even a deeper move to test the liquidity zones around 1,01,400 and 1,00,700 before resuming the upward trend.
Resistance levels: 1,03,600, 1,04,400, 1,05,000
Support levels: 1,02,500, 1,01,400, 1,00,600
A downside scenario may be considered if the price breaks through the triangle’s lower boundary and stabilizes around the 1,01,400 level, potentially forming a pre-breakdown consolidation-assuming no immediate rebound follows.
However, at present, intraday trading strategies can be considered within the range of the ongoing consolidation. A breakout to the upside and continuation of the bullish trend would likely be signaled by consolidation within the 1,03,500 to 1,05,000 range, accompanied by price compression toward the upper boundary.

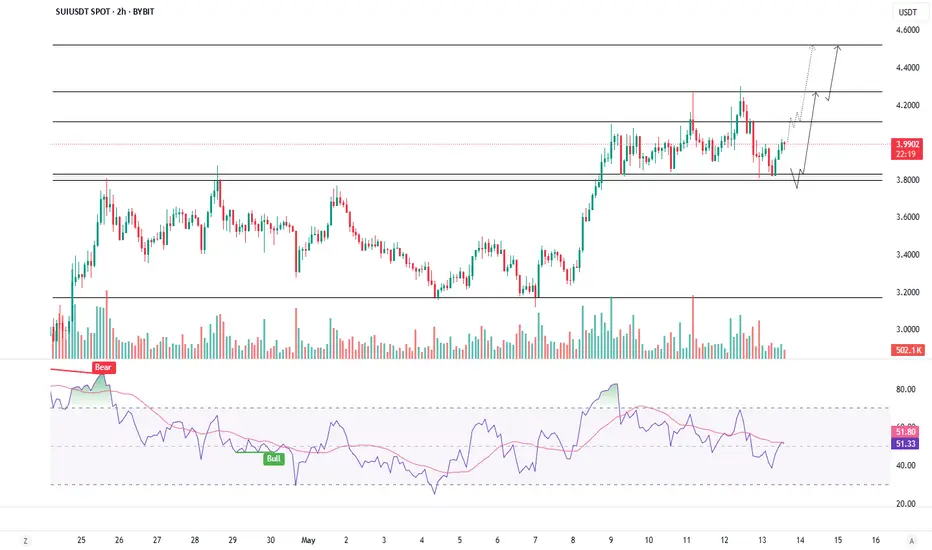
SUIUSDT HOLDING STEADY - BIG MOVE AHEAD?Symbol - SUIUDST
SUIUSDT has entered a consolidation phase within the broader context of an emerging bullish trend. Current price action highlights a zone of interest and a potential trigger area that merit close monitoring.
Market sentiment toward SUIUSDT remains constructive. The formation of a rising trend is being reinforced by Bitcoin's ongoing strength and a relatively supportive macro and fundamental backdrop.
From a technical perspective, SUIUSDT is consolidating within a range bounded by resistance at 4.1100 and support at 3.8110 Notably, a substantial liquidity pool exists below the 3.8110 support level, which has yet to be tested. This suggests a high likelihood of a false breakdown occurring before a potential continuation of the upward trend. However, should bullish momentum accelerate, buyers may defend current levels more aggressively, potentially leading to a breakout above the 4.1100-4.2750 resistance zone and subsequent price stabilization above those levels - indicating further upside potential.
Key Support Levels: 3.8110, 3.6670
Key Resistance Levels: 4.1100, 4.2750
The broader cryptocurrency market, led by Bitcoin, appears to be undergoing a liquidity gathering phase as part of a local correction within a bullish trend structure. While a brief wave of liquidations occurred yesterday, there is currently no substantive evidence of a broader market downturn. In an ideal technical scenario, SUIUSDT could retest support around 3.8110, form a false breakdown, and subsequently resume its upward trajectory.
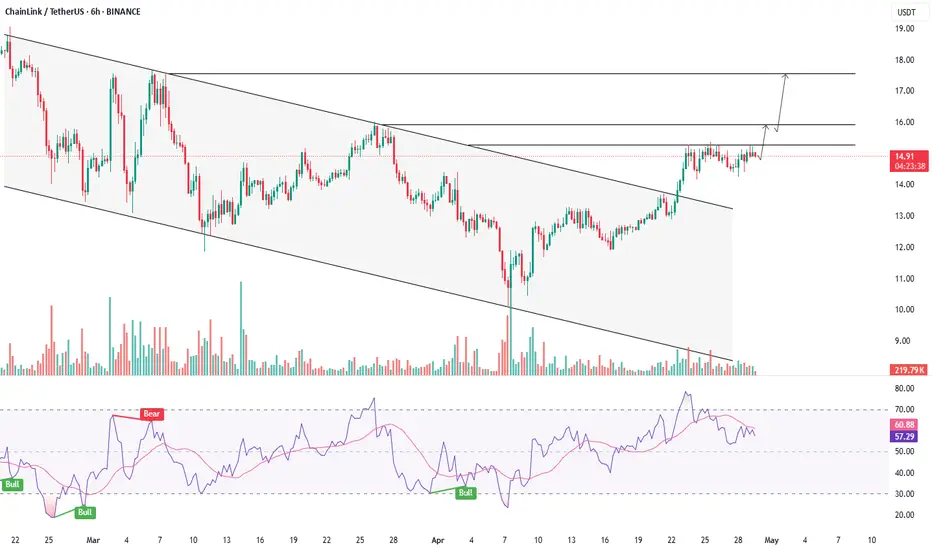
LINKUSDT - CONSOLIDATING NOW, BREAKOUT AHEAD?Symbol - LINKUSDT
CMP - 14.90
LINKUSDT has entered a consolidation phase following its breakout from a downward price channel. This development signals a positive outlook, as it suggests that buyers are accumulating momentum in anticipation of a potential breakout above key resistance levels.
The market has transitioned from a downward price channel to a consolidation phase, with key price levels ranging from 15.27 to 14.40, Bitcoin is exhibiting positive momentum, which, in turn, is supportive of altcoins. Should Bitcoin continue its upward trajectory, particularly after surpassing the 95K threshold, it is likely that the ongoing altcoin season will persist. A breakthrough in LINKUSDT’s resistance level at 15.27 could catalyze further upward movement.
Resistance Levels: 15.27, 15.94
Support Levels: 14.40, 14.26
At present, the performance of altcoins remains largely influenced by Bitcoin, which is benefitting from positive macroeconomic data in both the United States and the global economy. However, for specifically LINKUSDT, attention remains focused on its consolidation phase. If the resistance level at 15.27 is not breached on the first attempt, it is possible that a subsequent retest will yield a successful breakout. Prior to this, the price may test the consolidation support, potentially resulting in a false breakdown, which could create an imbalance favoring buyers. This imbalance, if it materializes, would enhance the likelihood of continued growth and a subsequent resistance breakout, contingent on the persistence of the broader bullish trend.
BITCOIN ON THE MOVE - BULLS IN CHARGE OR A TRAP AHEAD?Symbol - BTCUSD
CMP - 96000
BTCUSD has reached a new local high of 97900. The overall market structure remains constructive. However, its sustainability continues to be influenced by macroeconomic fundamentals and the performance of the S&P 500 index.
Recent gains have been supported by improvements in the US tariff landscape and the ongoing stabilization of US-China relations. Bitcoin's rally was further reinforced by the concurrent rise in the SPX 500, with which it maintains a relatively strong correlation. During the second half of this week, BTCUSD broke out of a two week consolidation phase, surpassing the resistance level at 95500 and establishing a new local high. A corrective movement is now developing within the confines of the existing upward channel.
The 95000 level represents a key liquidity and risk zone. If bullish momentum sustains above this threshold during a potential retest, the upward trend is likely to persist in the short to medium term. Conversely, a decisive break below 95000 may lead to a deeper decline toward the 92000–88000 range.
Resistance levels: 97425, 99475
Support levels: 95500, 92000
Market attention is focused on the 95500 support level, beneath which a significant liquidity pool has accumulated. Continued growth may result from a retest-induced rebound or a market imbalance favoring buyers. However, caution is warranted as upcoming economic data releases may significantly influence price action.
Important note: A return to the sell zone below 95000–95500, accompanied by an inability to sustain upward momentum, could lead to a broader correction and potential liquidation events.

VIRTUALUSDT SHOWDOWN - SUPPORT TESTED, BREAKDOWN AHEAD?Symbol - VIRTUALUSDT
CMP - 1.6620
VIRTUALUSDT is currently consolidating within the context of a broader uptrend, forming a defined trading range. However, emerging technical signals within this range suggest the potential for a trend reversal and subsequent decline.
Bitcoin, meanwhile, appears to be entering a corrective phase following its recent rally. This development is generally unfavorable for altcoins, which often struggle to gain momentum in the absence of strength from Bitcoin. VIRTUAL is exhibiting signs of consolidation, yet there is mounting pressure within the current structure, as evidenced by the clustering of resistance levels across the range. A key risk factor is the potential breakdown of market structure through a downward exit from the ascending channel, marked by a breach of trendline support.
A renewed test of the key support level at 1.5810 could serve as a catalyst for a breakdown, potentially leading to a sharper decline. Below this threshold, there is a relatively unimpeded path toward the next significant target around 1.1780
Key Resistance Levels: 1.7200, 1.8290
Key Support Levels: 1.5810, 1.4160, 1.1780
Market participants should closely monitor the current trading range between 1.5810 and 1.8290, Persistent pressure on the support level at 1.5810, particularly in the context of a broken uptrend, constitutes a bearish signal. A decisive breach and subsequent consolidation below this level may prompt liquidation events, accelerating a move toward the fair value gap (FVG) or liquidity zone near 1.1780

POLUSDT - GEARING UP OR GIVING UP?Symbol - POLUSDT
POLUSDT is currently trading within a defined range, exhibiting a counter-trend rally amidst a broader downward trend. A significant liquidity zone lies ahead, which may influence price action in the near term.
A distribution pattern has emerged following a period of consolidation within the 0.1929 - 0.1750 range. The potential realization phase of this distribution may encounter resistance and possibly halt between 0.2280 and 0.2438, This scenario would be supported by signs of price exhaustion or a false breakout within this zone.
Despite the recent local strength observed in Bitcoin, POLUSDT remains fundamentally weak. On the daily timeframe, the asset continues to trade within a broader selling zone, suggesting the market is currently accumulating liquidity in preparation for a potential continuation of the downward movement.
From a technical standpoint, the ongoing upward correction may conclude with a false breakout at the resistance levels of either 0.2284 or 0.2438, potentially triggering a retracement or reversal.
Key Resistance Levels: 0.2284, 0.2438, 0.2465
Key Support Levels: 0.2061, 0.1929
Should the price approach these resistance levels at the current pace, market momentum may diminish, potentially leading to a corrective phase or even a reversal, in alignment with the prevailing macro trend.

SOLUSDT - PRE BREAKOUT CONSOLIDATION - BREAKOUT ON THE HORIZON?Symbol - SOLUSDT
CMP - 134.70
SOLUSDT recently exhibited a false breakdown near the lower boundary of its established range. The market responded positively, with price action recovering and consolidating just below a key resistance level.
Bitcoin is also undergoing a consolidation phase. While both Bitcoin and SOL display similar movement patterns, Bitcoin has recently shown stronger correlation with equity markets and appears to be taking the lead.
Currently, SOLUSDT is consolidating below a significant resistance zone around 134.00-136.00, The initial test of this level could result in a minor pullback - potentially toward the 0.5 Fib retracement or continued consolidation near resistance. However, a confirmed breakout followed by sustained price action above this consolidation range would be a constructive signal, indicating potential for further upward movement. It is important to note that a broader trend reversal is not yet in play, the focus remains on short-term price targets at 140, 147, and 152.
Key Resistance levels: 147, 152
Key Support levels: 129, 123, 111
The overall macro trend remains bearish. Locally, the market is neutral, with price moving sideways within a defined range. The recent false breakdown beneath support may indicate a liquidity grab, suggesting the potential for price to move toward upper resistance zones between 147 and 152 in the short term.

NEIRO'S RESISTANCE RUN - IS A REVERSAL AROUND THE CORNER?Symbol - NEIROUSDT
Among the limited number of digital assets currently exhibiting upward momentum, NEIROUSDT stands out. However, its primary drawback lies in its position near the lower boundary of its trading range. This suggests the potential accumulation of liquidity ahead of a further decline.
NEIROUSDT is currently exhibiting signs of short-term strengthening, moving toward the upper resistance boundary of its consolidation range, while Bitcoin continues its corrective movement. A significant resistance and liquidity zone lies ahead at 0.000187, Any short-term gains could be undermined by a potential false breakout, followed by a reversal.
It is important to note that the presence of a coin near its bottom does not preclude the possibility of further downward movement. There is still room for additional decline. Presently, the price remains confined within a consolidation range amidst a broader downtrend, with no convincing signs of recovery. The last upward move was met with considerable selling pressure, leading to a sharp pullback.
Key Resistance Levels: 0.000187, 0.0002045
Key Support Levels: 0.000169, 0.000154
A false breakout above resistance, followed by a reversal toward the lower boundary of the range, is likely. Additionally, an extended consolidation near the resistance zone is not ruled out. During this phase, price may test the 0.00020 liquidity area before resuming its downward trend and potentially forming a new low.

ALCHUSDT'S CLIMB - PUMPING STRONG, RESISTANCE AHEAD!Symbol - ALCHUSDT
Despite the prevailing bearish sentiment across the cryptocurrency market, ALCHUSDT stands out as one of the few assets demonstrating relative strength. However, the sustainability of this momentum remains uncertain, particularly in the face of upcoming resistance levels.
Currently, a consolidation pattern is forming just below the breakdown threshold on the intraday timeframe, indicating a potential readiness for continued upward movement within the current distribution phase.
A confirmed breakout above the 0.1590 resistance level is expected to trigger further bullish momentum, with the next key target situated in the liquidity zone around 0.1770. However, due to the strength and significance of this intermediate resistance, a false breakout and subsequent pullback-potentially towards the 0.1590 level or the 0.5 Fibonacci retracement - should be anticipated.
Key Resistance Levels: 0.1590, 0.1770, 0.2300
Key Support Levels: 0.1516, 0.5 Fib retracement
The current distribution phase has already seen a 53% expansion since breaking above consolidation resistance. By the time price approaches the 0.1770 level, this could extend to approximately 77%. At that point, the market may have exhausted much of its bullish potential, increasing the likelihood of liquidity absorption above 0.1770 and a subsequent reversal or correction.

DOGEUSDT AT CROSSROADS - BULL TRAP OR BREAKOUT?Symbol - DOGEUSDT
DOGEUSDT is currently testing a key liquidity and resistance zone within the context of a prevailing downtrend, following a news-driven market rally. The critical question remains: Can this upward momentum be sustained, or will the market revert to a broader sell-off?
The overall downtrend persists. Recent market activity has been characterized by a corrective phase spurred by positive news flow, during which Bitcoin experienced a temporary strengthening, subsequently lifting altcoins such as DOGE. However, the sustainability of this upward movement is in question, as bearish sentiment remains dominant and no significant fundamental improvements have emerged to support long-term growth. Should Bitcoin resume its decline, DOGEUSDT is likely to follow suit.
From a technical perspective, the price is exhibiting signs of a potential false breakout above the resistance zone at 0.1570–0.1622, A consolidation below this range would suggest continued downside momentum, potentially driving the price toward the next key support area around 0.1364
Key Resistance Levels: 0.1570, 0.1622
Key Support Levels: 0.1364, 0.1277, 0.1154
A retest of the trend resistance remains possible. However, a sustained consolidation beneath the identified resistance zone would serve as a strong indication of seller dominance, increasing the likelihood of further declines. On the weekly timeframe, a critical trigger lies at 0.1421, breaching this level to the downside may open the path toward the support range between 0.1277 and 0.1025

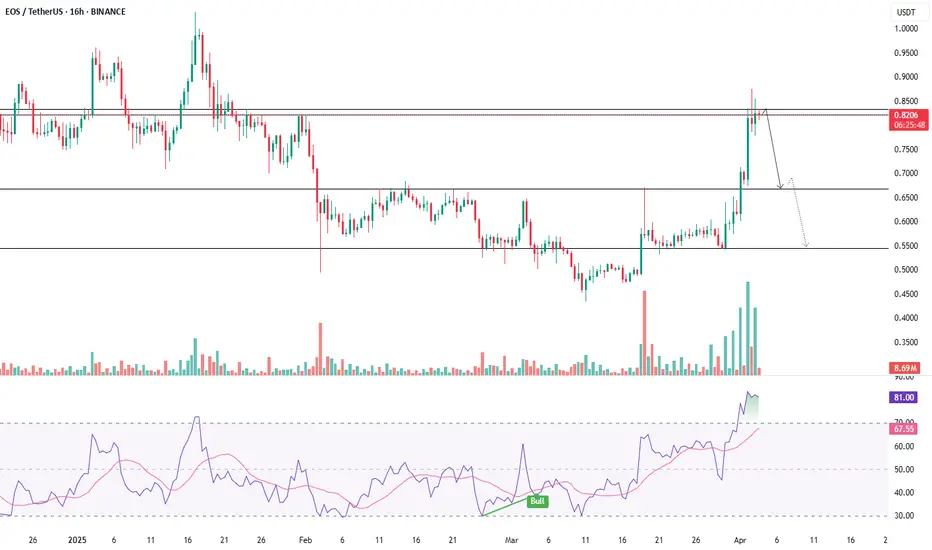
EOSUSDT - FACES RESISTANCE - IS A DOWNTURN ON THE HORIZON?Symbol - EOSUSDT
CMP - 0.820
EOSUSDT has reached key resistance within the consolidation range of 0.54 - 0.60, where it has formed a false breakdown, signaling a lack of potential for further upward movement. The broader cryptocurrency market is currently displaying signs of weakness, exacerbated by yesterday’s speech by President Trump and the subsequent approval of new tariffs, which have introduced additional risks and pressure on the market. Following a rally, Bitcoin has returned to a negative trend, while altcoins are continuing to seek new lows. EOSUSDT, however, has shown notable strength, suggesting that its recent price movement may be part of a countertrend accumulation strategy aimed at capturing liquidity within the 0.7 – 0.8 range. This distribution pattern is further characterized by a false breakout within the 0.82 – 0.86 range.
Key resistance levels: 0.820, 0.860
Key support levels: 0.793, 0.666
If bearish pressure manages to maintain resistance between 0.82 – 0.86 and the consolidation below this range culminates in a breakout at 0.793, followed by price consolidation in the selling zone, a potential reversal and decline towards key zones of interest - such as the FVG, 0.64, and 0.541 - could occur.
BITCOIN MAY DROP TO 74K - BEARISH STRUCTURE INTACTSymbol - BTCUSD
CMP - 84600
BTCUSD is undergoing a shift in market structure, transitioning into a bearish phase following the breakdown at 90K. A deeper correction is currently developing, which, in my view, represents a logical and technically sound progression for a healthy market. It is concerning when the market only experiences upward movement driven solely by buying pressure, such as in the case of large-scale injections of funds into high-yield investment programs (HYIPs).
A correction in Bitcoin’s price or even a trend reversal could inject vitality back into the market. From a fundamental perspective, traders have not seen the expected active support for cryptocurrencies from the US, which was previously suggested during Trump's election campaign. Additionally, issues such as crypto exchange hacks, fraudulent coins, and Bitcoin's dominance are exerting negative pressure on altcoins.
Bitcoin’s current downturn, with the possibility of a further drop to the 75K-73K range, could present an opportunity for fundamentally strong altcoins, assuming the declining Bitcoin dominance index also continues to trend downward. The simultaneous reallocation of funds from Bitcoin to altcoins, along with a rebound in Bitcoin from a strong support level, could rejuvenate the prospects for an altcoin season.
Resistance levels: 88150, 90700
Support levels: 75000, 73570, 66830
A modest retracement towards the 88100 to 90700 range is possible before the price begins its descent. While Bitcoin may attempt a deeper pullback, the current market imbalance, coupled with the absence of a clear driving force or supportive factors, suggests that the price may continue to fall in the medium term, potentially reaching the liquidity zone between 75K and 73K

BITCOIN - LIKELIHOOD OF A SHORT SQUEEZE BEFORE A DOWNWARD SLIDESymbol - BTCUSD
CMP - 84540
BTCUSD continues to exhibit a bearish trend after breaking the bullish structure on the weekly timeframe. There are no discernible bullish drivers at present, and from a technical standpoint, the price is poised to approach the imbalance zone between 75K and 73K.
Recent events, such as the crypto summit and discussions surrounding crypto asset support, have failed to provide substantial backing for the market. These events have historically been followed by further market declines.
From a technical perspective, the market remains in a downtrend, indicative of a global counter-trend. This suggests that the current price movement is contrary to broader market sentiment, which aligns with typical market behavior. On a general scale, key zones of interest include 75K, 73K, and the order block between 69K and 66K.
On a more specific level, attention should be given to the nearest liquidity zones at the higher levels, which may be tested prior to any further declines. These levels are located at 86,697 and 89,397
Key Resistance levels: 85135, 86678, 89397
Key Support levels: 79987, 78173, 73512
Following the false break of the 78K support level, there has been no significant market reaction. The market appears to be consolidating within the 84-85K range, which suggests a weakening of buying interest. Prior to any further downward movement, there may be a short squeeze within the identified liquidity zones, potentially leading to an additional decline.

XRPUSDT - FACES PRESSURE - WILL SUPPORT HOLD OR BREAK?Symbol - XRPUSDT
CMP - 2.1850
XRPUSDT remains under pressure despite the release of relatively positive news. The asset, currently in a downtrend, continues to test a critical support level, with the likelihood of a breakdown increasing.
XRP is consistently testing a robust support zone on the weekly timeframe. In the medium term, two potential scenarios could unfold, contingent on the overall market sentiment. Should the current market conditions persist, the probability of a downside breakdown and further decline becomes significantly higher.
At present, attention is centered on the key support level at 2.0637, where retests are occurring. However, the response to these retests is progressively weaker, which raises the likelihood of a continued decline towards the 1.90 - 1.63 range.
Resistance levels: 2.2650, 2.3650, 2.5090
Support levels: 2.0637, 1.9000
The broader cryptocurrency market is facing challenging conditions, including the ongoing tariff war, high inflation, declining stock markets, and a sense of disillusionment within the crypto community due to unmet expectations. Until these macroeconomic factors show signs of improvement, the technical outlook for XRP remains negative, and further declines may occur after a brief correction.

MEWUSDT - EYEING KEY LEVELS FOR A POTENTIAL DROP AHEADSymbol - MEWUSDT
MEWUSDT pair is currently in the distribution phase, testing a significant resistance and liquidity zone, where it has exhibited a false breakout. In light of the current market conditions, it is crucial to monitor several key levels, including both support and resistance.
A potential retest of the 0.00300 - 0.00312 range is likely, with the possibility of targeting another liquidity zone before MEWUSDT resumes its downward movement in alignment with the prevailing local and global market trends. These trends are characterized by a weakening Bitcoin and an overall sluggish cryptocurrency market.
Key Resistance Levels: 0.002793, 0.00300, 0.00312
Key Support Level: 0.002696
The primary support level at 0.002696 is critical, as it aims to prevent further market decline. Should the price fall below this level, there is a lack of significant support, potentially allowing for a strong move downward. A breakdown and sustained consolidation beneath the 0.002696 level could trigger a substantial impulse toward target zones around 0.00222 and 0.00200

LAYERUSDT - TIME FOR REVERSAL?Symbol - LAYERUSDT
CMP - 1.4200
LAYERUSDT is currently exhibiting a consolidation phase within an ongoing uptrend. The asset is outperforming the broader market; however, the initial reaction to the significant resistance at 1.4200 may result in a false breakout, followed by a retracement towards 1.275 or the 0.5 Fibonacci level.
Since the start of the session, LAYERUSDT has surpassed its daily Average True Range (ATR). However, upon encountering resistance, the coin may lack the momentum required for sustained upward movement. Liquidity in the vicinity of the 1.4200 level could serve to restrict price action, hindering the asset’s ability to break through this barrier on the first attempt.
At present, Bitcoin is testing its trend resistance, which could potentially lead to a reversal or continuation of its current downtrend, influencing altcoin prices accordingly.
Resistance levels: 1.4200, 1.4900
Support levels: 1.2932, 1.2747
The outcome hinges on the price's response at the 1.400 level. A sharp and distributive approach, with a high probability, is expected to result in a false breakout and a correction towards the aforementioned support levels. However, should LAYERUSDT show signs of slowing down and consolidating near 1.4000, there could be an attempt at a breakout, with further price movement dependent on the outcome of that attempt.

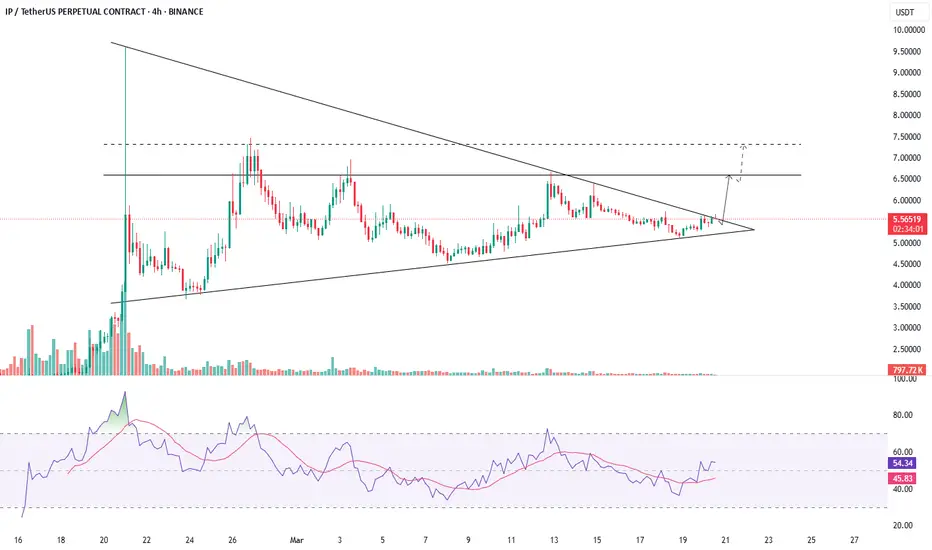
IPUSDT - POISED FOR A BREAKOUTSymbol - IPUSDT
CMP - 5.5500
IPUSDT is currently establishing favorable conditions for potential growth. Bitcoin has provided a modest boost to the market following positive developments regarding the SEC and XRP, a factor that has not gone unnoticed within the crypto community.
The IPUSDT coin has experienced an extended period of consolidation, forming a symmetrical triangle pattern. The upward trend in lows, coupled with the consolidation phase and the subsequent breakout above the triangle's resistance, signals positive indications of a potential distribution phase (the culmination of the consolidation). The key resistance level at 5.6297 remains a crucial barrier, separating the market from a more liberated zone.
Resistance levels: 5.6297, 6.6310
Support levels: 5.1160, 4.7830
Over the past few days, the price has consistently approached the triangle resistance and is building momentum for a potential breakout. Multiple intraday retests of this region demonstrate market interest in surpassing this boundary. A successful breakout above the 5.6297 resistance level, followed by consolidation above the triangle, would serve as a strong signal of readiness for upward movement.