OPUSDT - BULLISH BIAS & POTENTIAL TREND REVERSALSymbol - OPUSDT
CMP - 1.175
OPUSDT is exhibiting positive momentum relative to Bitcoin's performance over the past two days. The asset is currently in a phase of consolidation, testing trend resistance.
The primary factor hindering the onset of an altcoin season is Bitcoin's dominant presence in the cryptocurrency market. A decline in BTC, potentially opening a channel to the 75K range, followed by further upward movement after an intermediate bottom forms within the 75K-80K zone, could reduce Bitcoin's dominance. This, in turn, would present an opportunity for the altcoin market, which has been struggling in recent times.
I find OPUSDT appealing as it has not mirrored Bitcoin's decline but instead remains in a consolidating phase, offering clear boundaries for strategic planning. The key resistance level to focus on is 1.212
Resistance Level: 1.212
Support Levels: 1.044, 0.983
A breakout above the 1.212 resistance level could initiate a rally and signal a potential trend reversal. This could occur after a correction to the 0.5 Fibonacci level or following the formation of a pre-breakout consolidation on the H1-H4 timeframes.
The setup would be invalidated if the price breaks below the 1.044-0.983 support range.
Cryptocurrencies

OMUSDT - BULLISH MOMENTUM MAY PERSISTSymbol - OMUDST
CMP - 7.2828
OMUSDT remains an attractive asset, with consolidation forming in a flag pattern within the prevailing bullish trend. OMUSDT continues to form consolidation within the uptrend, and growth may follow if the resistance at the local channel is broken. The price structure appears robust, especially in contrast to the generally weak performance of the altcoin market.
Following Trump's speech yesterday, Bitcoin managed to surpass local resistance and entered the buying zone. If the price maintains a position above the 96.5K - 97K range and sustains its upward movement, certain altcoins may experience bullish momentum, which could propel them higher, including the already strong OMUSDT.
From a technical standpoint, the focus is on the local descending flag channel, with two critical support levels at 7.324 - 7.213. A false breakdown at these levels could trigger a continuation of the upward movement.
Key resistance: 7.755
Key support levels: 7.324, 7.213
The catalyst for continued growth lies in breaking through the channel boundary and the resistance at 7.755. Currently, the price is still distant from this zone and is approaching the support levels. A retest of the liquidity zone may culminate in a bullish impulse.

CAKEUSDT - BULLISH REVERSAL OR TRAP? - EXPECTING SELL OFFSymbol - CAKEUSDT
CMP - 2.570
CAKEUSDT is currently experiencing a false breakdown of critical resistance levels, indicative of a bullish rally. The potential further decline in altcoins may be influenced by Bitcoin's ongoing weakness. Technically, the movement in CAKE appears to be a counter-trend strategy, aiming to accumulate liquidity before a possible decline. The altcoin market remains fragile, with most coins still searching for a bottom, while Bitcoin is consolidating but shows signs of a potential decline toward the 91K-90K range.
CAKEUSDT is currently focused on the 2.614 - 2.728 range. If the bears maintain control and keep the price below these levels, the coin may experience a downward trend in the short to medium term.
Resistance levels: 2.614, 2.728
Support levels: 2.420, 2.063
Statistical analysis suggests that a false breakdown often leads to significant market movements, potentially even trend reversals. In this instance, the current movement is a counter-trend maneuver, and if the price experiences a local reversal, the coin will likely be subjected to downward pressure from the prevailing trend. A sustained price drop below 2.614 could intensify the decline, targeting 2.420, 2.060, and 1.040 levels.

POPCATUSDT - TESTING RESISTANCE AMID BEARISH STRCTURESymbol - POPCATUSDT
CMP - 0.3290
POPCATUSDT is currently testing trend resistance on the 4-hour timeframe. A rapid approach toward the upper boundary of the channel, accompanied by a false breakout, could lead to a correction or a continuation of the downward movement.
The broader market trend remains bearish, and the short-term trend aligns with this overall downtrend. Bitcoin has yet to serve as a bullish catalyst for altcoins. Additionally, yesterday’s CPI & economic data exerted a negative influence on the market. The cryptocurrency community had high expectations for Trump, but his stance has shifted, leaving cryptocurrencies lower on his agenda.
From a technical perspective, POPCAT is testing the resistance of the channel with a potential false breakout within the context of a prevailing downtrend. A sustained price consolidation below the 0.3220 level could signal further selling pressure.
Key resistance levels: 0.3220 (sell trigger)
Key support levels: 0.2386, 0.1596
While there remains a possibility of a retest of the correction channel resistance, bearish market conditions and the overall weak market sentiment suggest that the downtrend may continue.

OMUSDT - TRIANGLE BREAKOUTSymbol - OMUSDT
OMUSDT is a noteworthy asset in the current market context, as it stands out as one of the few coins exhibiting bullish momentum while many altcoins are experiencing successive declines. The situation may be partially influenced by BTCUSD, should Bitcoin undergo a more significant downturn, this could impact the broader market, as no asset would be immune. However, locally, Bitcoin appears to be forming a resistance breakout. If the bullish trend persists, OMUSDT could find a catalyst to support its upward movement.
At present, attention is focused on the resistance level of the triangle pattern and the base of the 5.6755 structure. Two potential bullish scenarios should be considered: growth following a breakout above resistance or a rebound after a false breakdown of support.
Resistance levels: 5.9822, 6.3000
Support levels: 5.7500, 5.6755
Currently, the price is consolidating within the bounds of the triangle. However, once the resistance is broken, the market may enter a realization phase, with a potential sharp upward impulse. Beyond the 6.3000 level, there are no significant resistance levels to be encountered.

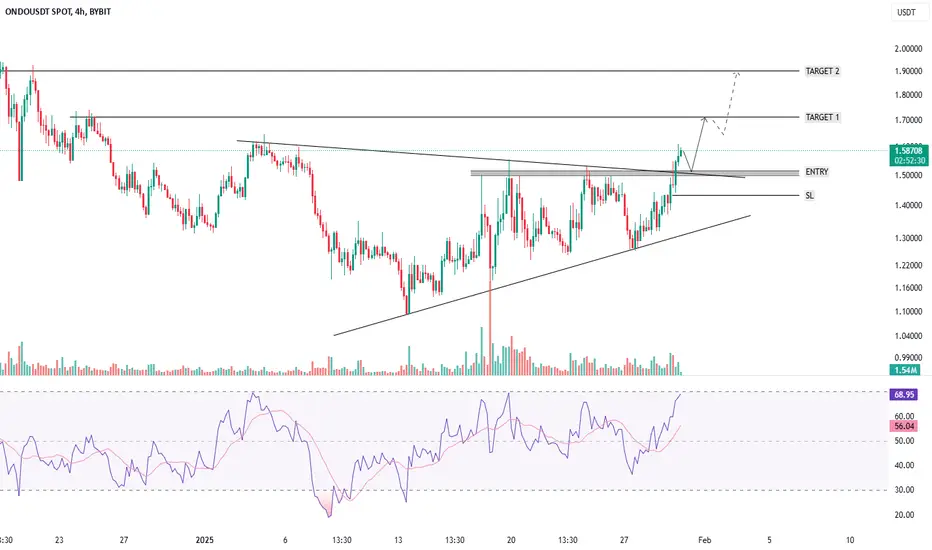
ONDOUSDT - TRIANGLE PATTERN BREAKOUT - BULLISH OUTLOOKSymbol - ONDOUSDT
ONDOUSDT continues to demonstrate an upward trend, with periodic cyclical counter-trend corrections. The chart is currently indicating a potential conclusion of the correction phase, suggesting a readiness for further upward movement. A significant consolidation pattern has developed within the context of the prevailing uptrend. In this regard, the price is attempting to break above the consolidation resistance (triangle) and surpass the next key resistance level at 1.538. This level is of particular importance. Should the bulls successfully maintain support above 1.538, ONDO may experience a recovery towards the 1.7–1.9–2.15 range in the short to medium term.
Support levels: 1.538, 1.44
Resistance levels: 1.7344, 1.90
A minor pullback to support, followed by a false breakdown, remains a possibility. However, sustained price consolidation above this level would confirm readiness for upward movement. Entry, SL & Target levels are indicated on the chart.
XRP longEither we bounce here or we bounce from the range lows (marked as RL). Will divide the position size in two for two entries. If we bounce here and stay strong above mid range then will add second entry there.

Bitcoin Poised for $94K: High Bullish Momentum AheadBitcoin is currently forming an ascending pattern, signaling a potential bullish market. Additionally, the RSI has formed a bullish divergence, and the decreasing selling volume supports this outlook. If the breakout occurs successfully, we could see Bitcoin reach $94,000.
#Bitcoin #Crypto #BullMarket #BTC #RSI #CryptoTrading #TechnicalAnalysis #CryptoBullRun

#AVAX Ready to Skyrocket: Massive Gains Ahead!Hi everyone! Today, I'd like to highlight another top altcoin: AVAX. It has found strong support at the anchored VWAP and is currently retesting a previous high area. Recently, $AVALANCHE surged to retest the previous support level from 2021, around the $65 zone, which acted as resistance. Now, it's finding support from previous highs.
The VWAP is a highly regarded indicator, often used by institutional investors. Given this, it might be an excellent time to buy AVAX, as it appears ready to soar from its current range of $20 to $22. If it retests its all-time high of $148, we could potentially see returns of up to 500% from this point.

BITCOIN ANALYSIS : UPTREND DONE OR REVERSAL ? DISCLAMIER : THIS IS FOR EDUCATIONAL PURPOSE ONLY, NOT A FINANCIAL INVESTMENT ADVICE, TRADE AT YOUR OWN RISK.
Bitcoin is going strong continuing an uptrend and has hit the weekly zone now with 1D chart's RSI being overbought but it doesn't necessarily means that a true reversal is coming. If we look at this chart then we can see that there has been a BOS and if price makes a corrective pullback with low volumes filling the FVG then you can take you can go long in Bitcoin.

USDT Trade Idea - USDT Dominance works inversely with the Crypto Market
- USDT has been following my path and I firmly believe this wave could lead to every alt jump soon.
- The narratives are obviously going to be there playing out in a different way but make sure you follow this closely
- Once you see this approaching it's previous lows try cutting down your size in Alts and crypto so that when USDT bounces you are mostly sitting cash or FIAT.
- This will help you in accumulating more cash

Audious Short tradeThis is my audious short setup,
Also i should tell you guys about my luck that any idea i publish, the market goes against that idea
Be careful bros

ETHUSD BULLISH IDEAETH managed to trade above the resistance and had recently broken our falling resistance, the next target for buy buyers will be 1258 as it's the closest resistance.
Note:
All ideas forecasts are my personal views on the market, I share these ideas for free, and you're free to share my profile link with your friends, please do not use my Idea without credit.
I post and share for educational purposes hence no idea we publish should be considered an investment advice.
I mostly share ideas with more than normal conviction, meaning I mostly share ideas with High conviction.
You can check all my work, you can understand my style of analyzing market, please if you like my work do help me earn reputation and like, comment on my ideas, we can discuss more here.

Bitcoin/BtcBitcoin has broken important resistance and also a pattern breakout has happened.
bullish on btc and crypto

Trading Signal For LUNCBUSD Terra ClassicTrading Setup:
A Trading Signal is seen in the LUNCBUSD Terra Classic.
Traders can open their Buy Trades NOW
⬆️Buy now or Buy on 0.00023129
⭕️SL @ 0.00022146
🔵TP1 @ 0.00025614
🔵TP2 @ 0.00028330
🔵TP3 @ 0.00032188
What are these signals based on?
Classical Technical Analysis
Price Action Candlesticks Fibonacci
RSI, Moving Average , Ichimoku , Bollinger Bands
If you liked our ideas, please support us with your likes 👍 and comments .


Weekly Analyze of Crypto Investing in July, 2022This week, the popularity of the crypto market has increased, and the market has broken through with the trend, and the trend is expected to remain.
BTC’s daily breakout and step back verification trend extended to the weekly line, and finally it successfully stopped falling and completed another breakthrough. The daily line returns to the upward trend, and there is a certain resistance on the upper edge of the upward channel constructed. The support range is 22000-22500, and the pressure range is 26000-26500.
ETH has a positive weekly line and is currently in the process of repairing the second big Yin column in the previous downtrend. If the potential resistance of MA120 is superimposed, the pressure range is 1900-2000. The daily line showed a pull-up, and the consolidation broke through the higher pattern again, and the trend was still strong. Trend defensive range 1500-1600.
Vtrading is a crypto trading platform providing smart coin trading strategies for every trader. If you are using Vtrading smart crypto trading bots, the Grid and Martin strategy are suggested for spot market, and the SMT strategy for futures market.

KCS shall bounce from here!!This is based on fundamental analysis.
Since $BTC has shown a 10% up on a weekly candle, I'm bearish about bitcoin. And this time bitcoin shall crash below 16,000 $USDT as $KCS will follow somewhere near $8. Don't open any leverage trade based on this analysis, just open a spot order between these rates.

$BTC Daily update$BTC $19,894 support tested as expected😎😂😂, Last 4H close looking bullish could move sideways above $19,894 towards $20,338 resistance. 1D close of yesterday was follow thru of the bearish engulfing from the last weekend. Continue watching given S/R areas.

$BTC Daily update$BTC #BTC Broke $21,299 with reattempt at $21,791 which resisted and held strong. 2 Attempts in last 6 days to break $21,791, 1W time-frame seems to be settling down slowly from the bearish turn. Continue watching $20,812 support which remains key for now.

Update: BTC broke $ 20000, what' next?so BTC followed the projected path! there seems to be one more small push down before some relief is seen.
the relief could be a wave (iv) in blue or alternatively a bigger bounce (which remains to be seen that its a bullish reversal or a wave 2 rally only to fail and continue the decline down later).
Trade safe!

OP/USDT #CRYPTOCURRENCIESHigh Risk OP Long Opportunity imo.
Previously made 300% + profits in it..
Another successful trade is expected.
#DYOR
High RISK

TRX/USDT #CRYPTOCURRENCIES HIGH RISK TRX Long Idea.
DYOR, however TRX has been highly bullish over last few weeks, as total locked value crossed 6 billion.
Expecting a successful quick scalp.
