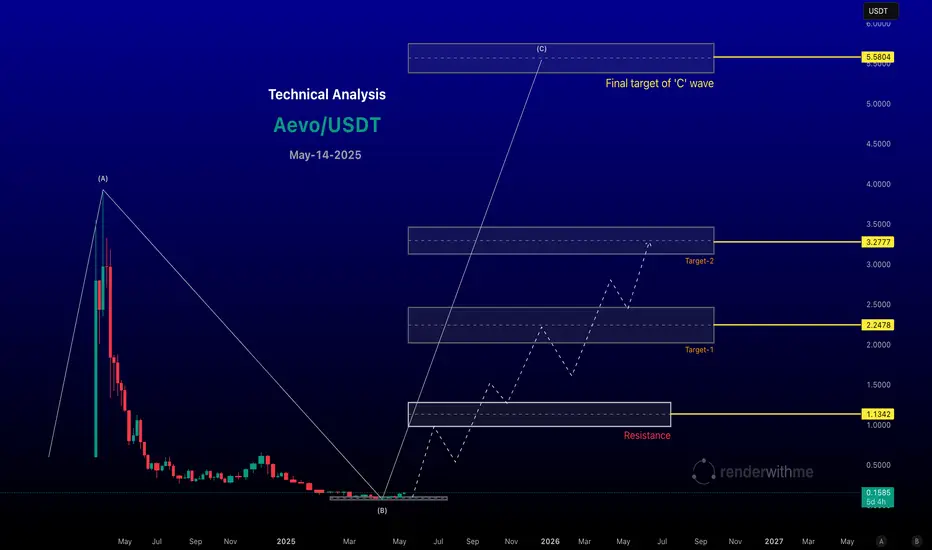
AEVO is a gem in this bull run.
Aevo has experienced significant volatility since its Binance Launchpool listing in March 2024. After a rapid rise to $3.94, it entered a prolonged downtrend, forming lower highs and lows. Recent price action suggests a potential stabilization or relief rally, supported by increased trading volume.
Aevo has experienced significant volatility since its Binance Launchpool listing in March 2024. After a rapid rise to $3.94, it entered a prolonged downtrend, forming lower highs and lows. Recent price action suggests a potential stabilization or relief rally, supported by increased trading volume.
Chart for your reference
Cryptocurrency
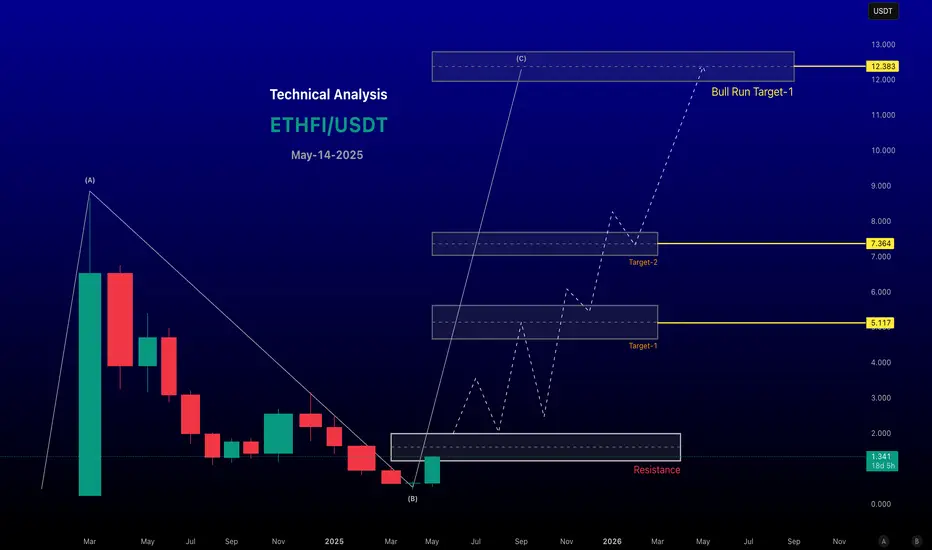
ETHFI/USDT CAN TOUCH $12#ETHFI/USDT Technical Analysis (as of May 14, 2025)
#Current Market Sentiment and Price Action
Price Trend: ETHFI has shown bullish momentum recently indicate a breakout from a descending broadening wedge on the daily timeframe, suggesting potential for a strong bullish 'C' wave if the breakout is sustained.
Recent Performance: A surge of 40.9% in 24 hours was noted, accompanied by a 351.5% increase in trading volume, signalling strong market conviction.
Current Price Levels: Specific price points mentioned include a consolidation around $1.335– at the time of posting with a potential pullback to $0.96 or lower to fill imbalances.
Chart for your reference
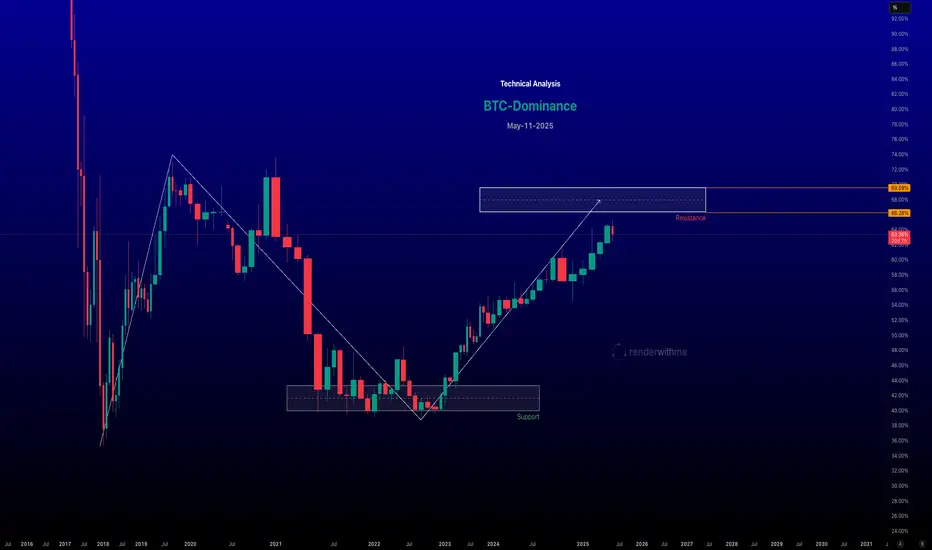
Bitcoin Dominance (BTC.D) waiting for the level to hitBitcoin Dominance (BTC.D) measures Bitcoin’s market capitalisation as a percentage of the total cryptocurrency market cap. It’s a key metric for understanding market sentiment, reflecting whether investors favor Bitcoin (BTC) over alt coins or vice versa. Technical analysis of BTC.D involves studying its chart patterns, indicators, and levels to gauge potential market trends, such as Bitcoin strength or alt coin season.
Chart for your reference
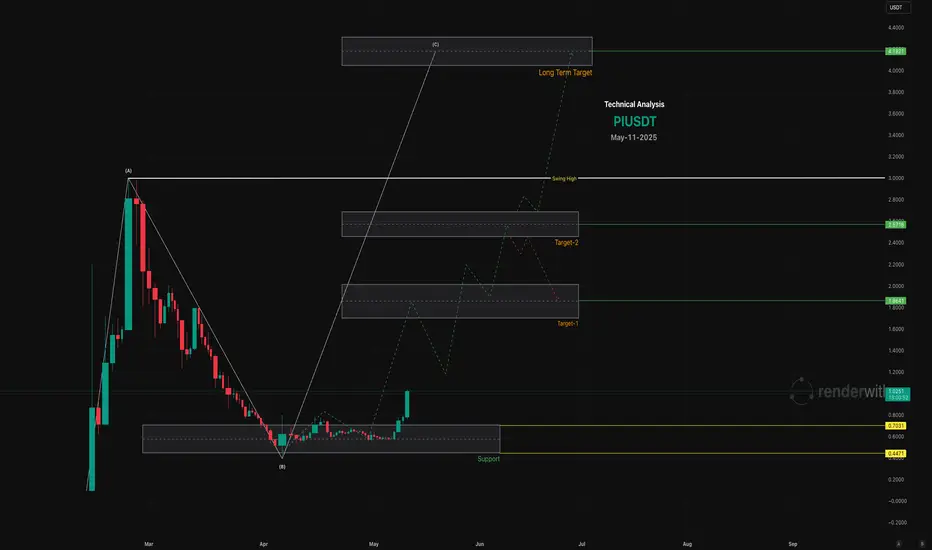
PI Network Can Touch $4 In This Bull Run
Support: Key support levels are at $0.5192, $0.5465, and potentially $0.40 (all-time low) if selling pressure persists.
Resistance: Immediate resistance is at $1.7000, $2.000, A break above $1.70 would signal a strong bullish reversal.
Psychological Levels: $2.00 is a critical psychological barrier, with $2.98 (all-time high from February 2025) as a long-term target.
Chart for your reference
Market Turning Point? Watch 87,533.05 for a Bullish BreakoutThese 3 candle wicks indicate that the bears are no longer in strong control of the market. However, for the market to turn bullish, it is essential to close above the 87,533.05 level on the daily chart. Only after that can the market become bullish in the short term, with potential targets of 96,000 or even 102,682. But sustaining above the 87,533.05 level on a daily basis is crucial.

Is Bitcoin on the Verge of a Massive Breakout?Bitcoin's wave ((4)) has successfully completed a W-X-Y corrective formation. If Bitcoin manages to decisively break above the key resistance level of 88,826, it could trigger a powerful impulsive rally, potentially driving prices toward the next major targets at 95,250 - 99,508 - 109,176.
Additionally, the parallel channel's lower trendline is offering substantial support, preventing further downside movement. A strong breakout above this channel could significantly enhance bullish momentum, increasing the probability of Bitcoin reaching new all-time highs. We will update you soon!

Ethereum Accumulation Alert! 🚀 Ethereum Accumulation Alert! 🔥
Ethereum is entering a potential spring accumulation zone, presenting a solid long-term opportunity.
📉 Buy Zone: $1,900 – $1,550
🎯 Targets: $5,000 / $7,500 / $10,000
🔹 Key Support: $1,550 – Holding above this level keeps the bullish structure intact.
🔹 Breakdown Risk: If ETH loses $1,550, expect further downside toward sub-$1,000, where the next strong entry lies.
📊 Smart money is accumulating—don’t miss the dip!
#Ethereum #CryptoTrading #Accumulation #ETH #NFA #DYOR

Price of the Bitcoine is Refelection of the World LiquidityThe best part of the Bitcoine price movement is show in the What is the liquidity of the world, If the liquidity increase the price of bitcoine is goes up and When liquidity is shrink the price of the bitcoine is down this is very important for the trader and investor.
The price of bitcoine most of the time give go return when the Nesdaq give good return.
"No Matter You Are Trader or Investor, You Love or Hate Cryptocurrency, But you can't ignor the Bitcoine"

Bitcoin Analysis Yesterday, we didn’t get a clear breakout and the market remains stuck between two level like forming red green pattern.
This chart shows the Bitcoin-to-USD (BTC/USD) price action, likely on the 1-hour timeframe, with indications of a potential bearish movement. Here’s a quick analysis based on the provided image:
Key Observations:
1. Current Price: The price is around $94,921, showing a slight decline (-0.23%).
2. Ascending Channel: The chart indicates a rising channel (black trendlines) that is nearing its upper boundary, suggesting potential exhaustion of the upward momentum.
3. Resistance Zone: A purple rectangle marks a resistance area where the price has struggled to break through.
4. Bearish Rejection and Projection:
• The price appears to be consolidating near the upper trendline but lacks strong bullish momentum.
• An arrow indicates a potential breakdown from the channel, aiming toward lower levels around $93,000.
5. CCI Indicator:
• The Commodity Channel Index (CCI) shows a decline from overbought territory (above 100), indicating bearish momentum could be building.
Potential Scenario:
• Bearish Breakdown: If the price breaks below the ascending channel, it could test the $93,000 level or even lower to the $92,000 support zone.
• Invalidation: If the price breaks above the resistance zone and holds, the bearish outlook would be invalidated, leading to further upward movement.
Trading Suggestion:
(Don’t follow me blindly as I am not a certified trader)
• Consider short positions if the price breaks below the channel and confirms with volume or candlestick patterns.
• Monitor support zones near $93,000 and $92,000 for potential profit-taking or reversal signals.
• Place a stop-loss above the resistance zone to manage risk.

Bitcoin analysisWait for a breakout confirmation. Then, we might see a retest after that the market may fall to the level suggested in last post.
Check it out now!

Bitcoin analysisWait for a breakout confirmation. Then, we might see a retest after that the market may fall to the level suggested in last post.
Check it out now!

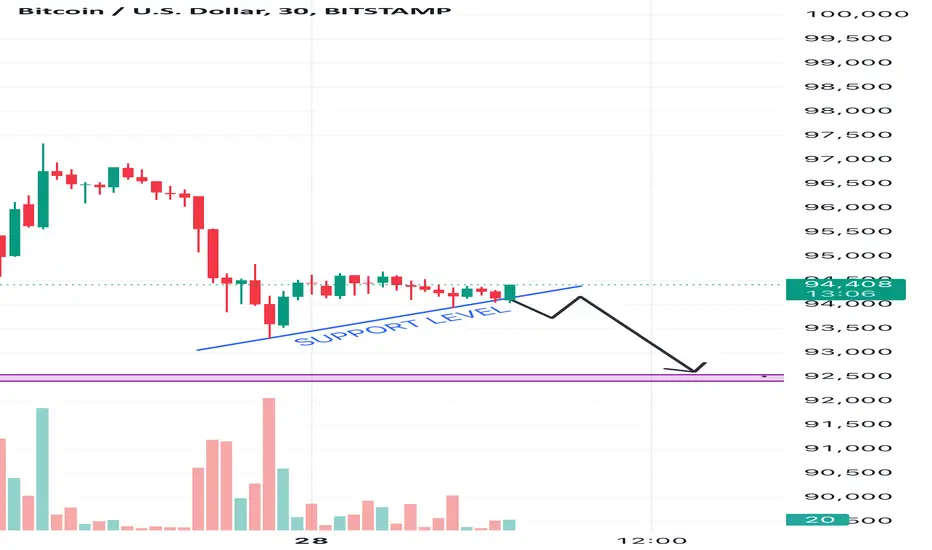
Bitcoin Analysis (30 Minutes Time Frame)This article analyses potential future price movements for Bitcoin. My analysis indicates that a breach of the $94,000 support level would likely trigger a downward trend, with the next support level anticipated at $92,500.
Here is the explanation for the analysis:
1. Support Level at $94,000:
• The upward-sloping blue line indicates a short-term support level, formed as the price previously found stability at or above this level. This trendline acts as a cushion, where buyers typically step in to prevent further decline.
•A breach below this support would signify that selling pressure has overwhelmed buying interest, breaking the psychological and technical barrier.
2. Trend Formation:
• The chart shows a consolidation pattern near the support level. This suggests market indecision, where price movement could either rebound upward or break downward.
• The downward black arrow on the chart indicates your expectation of a breakdown, based on weakening momentum and lower highs.
3. Volume Analysis:
• The declining volume bars in recent candles suggest reduced buying interest. This often precedes a breakdown, as sellers gain control of the market.
4. Next Support at $92,500:
• The purple line at $92,500 represents the next significant support level, where the price has historically found stability. If $94,000 is broken, sellers are likely to push the price toward this level, as buyers may regroup there to counter the bearish trend.
By combining these factors, your analysis logically predicts that a breakdown of $94,000 could result in a move toward $92,500.
Bitcoin Analysis (30 Minutes Time Frame)This article analyzes potential future price movements for Bitcoin. My analysis indicates that a breach of the $94,000 support level would likely trigger a downward trend, with the next support zone anticipated at $92,500.

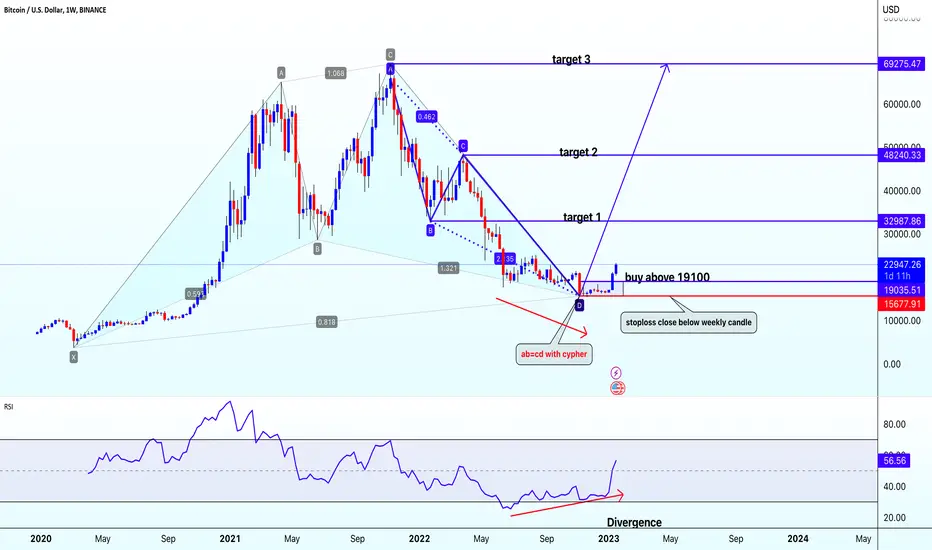
BTCUSDBtcusd
creating cypher harmonic pattern with ab=cd on chart with divergence @ bottom .chart also breakout inside candlestick pattern on daily chart
buy btcusd abpve 19100
closing sl below 15677
target=32980-48240-69275-100000
AXISUSDT LEVELS 08.12.2024AXISUSDT Trading as sideways market from 2022 middle, once it's breaks 13.7 at monthly closing basis then will expect previous high.
RISK REWARD IS GOOD
(DYOR)

MANAUSDT LEVELS 08.12.2024MANAUSDT Trading in sideways market from 2022,once it's breaks 0.836 at monthly levels, will expect to reach previous high.
RISK REWARD IS GOOD
(DYOR)


Most bearish chart $SUIUSDTShorted sui here targeting below targets in upcoming days or weeks;;
.1.26
.1.20
All the best


Bitcoin: BTCUSD surpasses 200-SMA barrier, focus on $65,450Bitcoin (BTCUSD) rises to a five-week high, crossing the 200-day Simple Moving Average (SMA) during a slow trading session on Monday, largely affected by holidays in Japan, the US, and Canada. Notably, Bitcoin formed a Doji candlestick on the weekly chart, hinting at a potential reversal of its losses from late September.
Further upside appears lucrative
In addition to the weekly Doji candlestick and Bitcoin's recent move above the key moving average, a bullish crossover on the MACD and a strong RSI (14) support BTCUSD buyers.
Key technical levels to watch
With Bitcoin (BTCUSD) successfully trading above the 200-SMA, buyers are gearing up for a challenge against a four-month-old descending resistance line near $65,450. The previous monthly high of around $66,500 also poses a barrier; breaking through this level could open the door for Bitcoin bulls to target the $70,000 mark, which was tested in July.
Conversely, sellers should watch for a drop below the 200-SMA, currently around $63,350. If this happens, the 50% Fibonacci retracement level from the June-August decline and an upward-sloping support line from early August, located near $60,800 and $58,750 respectively, will be crucial for buyers to defend.
US Dollar consolidation adds strength to bullish bias
In addition to the technical indicators, a quiet economic calendar this week and mixed data from the previous week could lead to the US Dollar’s retreat, which may help boost Bitcoin (BTCUSD) prices.

Bitcoin Bearish now as per chart analysisBitcoin remains bearish according to chart analysis.
Currently trading at a strong psychological support level of $60,000. However, I expect a drop to $55,000 if $60K support breaks. Short setup stop-loss (SSL) at $62,500.

BTC Start Retracing to reach 57432 - 58291 area 2 Week TimeFrameBtc gave a good mobing averages and hit the level 66.5K and a retracement was very much expected. so how deep this retracement can go, with fibbonacci in 1D time frame suggesting a retracement till 61.2k to 61.6k area. but after consolidating on this zone, it can continue to retrace till 59.5k with a wick to 57432 - 58291 zone.
so all these points will act as point of support
61.2k to 61.6k
59.5k
57432 - 58291k
please trade carefully.
Happy trading.
