LONG BTCUSD...High Probability SetupBTCUSD
Cmp - 43361
Stop - 39500
Expectation -
T1 - 50000
T2 - 58000, Review at 50000
Expected Holding Period - 3 months or earlier for T1, 5 months or earlier for T2
View:- Swing/Investment
Cryptocurrency

ETHUSDSymmetrical Triangle pattern formation on ETHUSD on a 1hr timeframe !
🚫Disclaimer:
I'm not an financial analyst! I'm sharing this with public! It just learning purpose only! If u find anything wrong with this post ! U can tell me ⬇️ comments!
Thank you!!!
😊😊😊

BTCUSDBTCUSD on a 15min timeframe ! Target should be around 4400$ !
🚫Disclaimer:
I'm not an financial analyst! I'm sharing this with public! It just learning purpose only! If u find anything wrong with this post ! U can tell me ⬇️ comments!
Thank you!!!
😊😊😊
BLong

ETHUSDChannel pattern formation on ETHUSD on a 1hr timeframe ! Target should be around 3450$ ! Sl-3260 !
🚫Disclaimer:
I'm not an financial analyst! I'm sharing this with public! It just learning purpose only! If u find anything wrong with this post ! U can tell me ⬇️ comments!
Thank you!!!
😊😊😊

Bullish on WazirX for upcoming daysTook support at the particular point 3 times previously and has again took support at the same level
WLong

Head and Sholder chart patternbtc-usd following good ha=ead and sholder pattern i hink that there should be a small uptrend and if it follows head and sholder pattern then it may came down .till now it is at the great support.

BITCOIN/US DOLLAR (Neowave)COINBASE:BTCUSD
Hi Traders
This is an short term view for BTC/USD.
39600 is working as a support level for btcusd for temporary uptrend. Although short term count is bearish for it.
Major support for BTC/usd is 28800.
I will update if anything in count changes.

avax trading setup and planavax has created nice distribution and accumulation zone
and the price has breakout from recent consolidation
wait for the price retest 92.30 lvl to enter the trade
first target will be 103
second target will be 120
with the sl of 88
happy trading ....

BTCUSD look like cup&handle !Cup and handle pattern formation on BTCUSD on a 4hr timeframe ! Target should be around 46000$ ! Sl-41000$ !
🚫Disclaimer:
I'm not an financial analyst! I'm sharing this with public! It just learning purpose only! If u find anything wrong with this post ! U can tell me ⬇️ comments!
Thank you!!!
😊😊😊

Bitcoin 4H Daily Short-Term Update (Bullish)Bitcoin is looking good short-term across multiple timeframes...
The 1H timeframe is looking good as mentioned in our previous trade idea, we have a rising channel with higher highs.
Now, the 4H timeframe is also looking good.
As BTCUSD is trading above EMA10, EMA21 and EMA50, we see a bullish breakout happening now.
The cup pattern is now in full display signaling that our low/bottom is already in.
The MACD looks good above zero/bullish.
The RSI is super strong.
Slow and steady and we believe it will start to speed up.
Conditions for change
We remain bullish above the 10-Jan. low at $39558.
Any trading above this level we are bullish.
If prices move below $39.5K we start to consider the bearish scenario.
We are bullish now.
Enjoy.
Namaste.

Bitcoin 1H Daily Short-Term Update (Bullish)Good morning my fellow cryptocurrency traders, how is Bitcoin looking up today?
We have the short-term chart, 1H timeframe, with a positive outlook.
- We have been seeing higher lows within an ascending channel.
- BTCUSD 1H managed to break and close above the MA200 black line.
- We have a strong RSI and bullish MACD.
- Prices remain safely trading above EMA10/EMA21.
The bulls stay ahead.
We continue aiming at higher prices, slow and steady so far.
The dashed blue line and spaces marked on the chart are for support.
Namaste.


BTC IS RISK ON! 40K STRONG SUPPORT* 40000$ strong support for bitcoin, previous swing low
* 2.618 ABCD pattern
* 1.13 XABCD pattern on 4 hr
* bullish pin bar pattern on daily chart
* closing stoploss below 40800$
* price consolidating on 1hr and forming price action zone for accumulation
* price is above all MA's except for 200 HMA
* double bottom clearly visible on line chart
* bollinger squeezed on 4hr and 1hr
* pin bar bollinger buy signal

Bitcoin 4h Short-Term Update + Bullish Target ($48K & Beyond)Slowly but surely Bitcoin (BTCUSD) is starting to recover.
Here we are looking at the short-term chart, 4h timeframe.
We can notice the classic cup pattern starting to form, this is very common when a bottom/low takes place.
After the cup pattern a bullish jump tends to follow.
We have bears and bulls fighting with EMA50 being the next immediate resistance at $43,195.
This is our last barrier short-term, if EMA50 can be taken out we can look forward to $48,000 and beyond.
Additional details on the chart.
Check the related trade ideas below for previous articles .
Thanks a lot for your support.
Namaste.

WAVEUSD BINANCESomething huge is coming!!!
Well a interesting scenario is happening in WAVEUSD. High frequency trade is unfolding in upcoming sessions. Consolidating since Nov 21 while remaining in down slope channel.
Having last support at 10$, below it, can reach to 2$.
Trade - Buy beakout of 16$ price level for Target -20$, above 20$ it should reach 26-27$. Buy again if breakout above 28-29$ for life time high in WAVEUSD.
Sell below 10$ for only one target 2$. If seller trapping happens at level of 10-11$, then only Buy with 1$ as Stoploss...
W


The Last Drop | Bitcoin Will Resume Growing January 2022Bitcoin last drop is very likely in and we are about to move up... Let's go into details.
Bitcoin has been dropping since the 10 of November with no relief rally/bounce, nothing at all, basically we have been going straight down.
That's 60 days in the red.
The RSI has been ranging near the oversold/weak line for a while now. Normally, Bitcoin tends to recover strong once the daily RSI goes oversold.
We had a recent attempt by the bears to push prices lower which ended up in a rejection, this can be appreciated in the lower timeframes.
Bitcoin's last drop!
Here are the two main bullish scenarios that we look forward to this month.
1) The drop is already over. We will see the green arrow materialize next.
2) One final drop/wick. There is a the possibility of one final wick, a long wick, before a relief rally can take place. This scenario also has good potential and will only extend the correction for a few more days, maximum a week or two...
Conclusion
Bitcoin will go green by the 15th of this month.
What's your take?
Do you agree with this analysis?
Feel free to hit LIKE and leave a comment with your targets.
Thanks a lot for your continued support.
Namaste.

Time To Buy Bitcoin? Volatility Kicks In!We have a very long lower wick on today's candle after some volatility kicked in.
The Fear & Greed Index for Bitcoin is now at "Extreme Fear"... What happens next?
Looking at the 1H timeframe, we can see a candle wick going as low as $39558 but closing at $40809.
The the following candle pushed prices back above EMA10 on high volume.
See the chart:
This recent low coincides with September 2021, opening the doors for a double bottom.
The blue arrow show the potential bullish path.
(Potential is now opening for a bullish bounce).
If the bulls fail to push prices above EMA10 this week, we can expect a test of lower support.
This is not financial advice.
Remember to do your own research before trading.
Namaste.

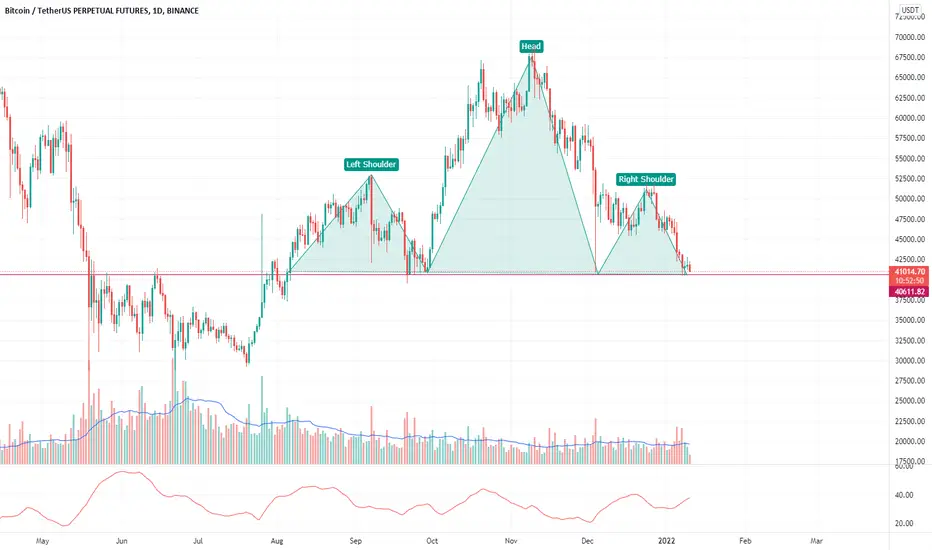
BTCUSDTPerp showing Head and Shoulder patternCryptos have been dumping pretty hard and it seems BTC is still not out from the bearish grasp
Possible reversal in BNBUSDTBNBUSDT on crucial support if it breaks we might witness a long fall on the other hand this can also act as a support and price can be bullish, waiting for a W pattern to form before taking any trades.

Signal & analysis For Bitcoin Trading Signal:
A Trading Signal is seen in the Bitcoin BTCUSDT
Traders can open their Buy Trades NOW
Rank : ⭐️⭐️
⬆️Buy now or Buy on 40000.0
⭕️SL: 38724.0 or SL on Uptrend breakout
🔵TP1 @ 43570.0
🔵TP2 @ 45555.0
🔵TP3 @ 51300.0
If you liked our ideas, please support us with your likes 👍 and comments .

20% Profit on 15min $ETH ChartEverything should be pretty clear from the image but I waited for the trendline to break and the chart used the previous support as the new resistance. The chart also formed a bearish engulfing pattern on the chart which was the second confirmation. The third confirmation was the downtrend momentum on the RSI which was below 50 and that was enough for me to enter the trade.
