2 Possible Scenarios Hello Fellow Traders, We are currently witnessing/participating in historic times BTC is currently trading at new levels of support trading around 50K USD, i personally don’t believe we are in a Bear season even though The US Dollar is being Printed more than ever. Right now the Crypto Fear & Greed Index is at extreme Fear as people are scared to buy when it's time to be Greedy!!! I Personally believe that when we enter the first quarter of next year BTC will hit levels around 80K which is a 60% increase which will mean incredible gains for Altcoins. Alt Season May be here soon than anticipated!
Cryptocurrency

BITCOIN Analysis (W)Long BTC above 52K If Broke with an engulfing Candle.
Stop Loss below Candle Low . . . I think it will make a new high If momentum sustains..
Thanks ! Do follow me for more Analysis.
BINANCE:BTCUSDT

BTCUSD
1hr OB respected
break of structure on medium term trend
area of imbalance to be mitigated
Expected tp @ $48k region

Bitcoin Straight Up? Short-Term AnalysisWe have multiple signals telling us that Bitcoin can move straight up.
Looking at the 2h timeframe for BTCUSD, we can see prices trading above EMA10 and all other EMAs.
The trading volume is still low but we are seeing steady growth, the bulls pushing higher.
We have a very strong RSI to support additional growth.
The next resistance is set at $52,000 followed by $54,000, short-term.
Support is set at $48,650 to $50,000.
I say we go up this weekend... What do you say?
Leave us a comment.
Namaste.


Bitcoin Moves Ahead!After testing MA200 as support and holding Bitcoin is starting to recover.
At first it was hard for some to see that a recovery was about to take place, but it is looking much better now.
We have the same signals as before but stronger, these are not "early" signals anymore.
See the previous trade idea below for the data... (Dec. 20)
Can Bitcoin Recover Now? End Of Year Rally Early Signals!
Wishing you a lovely Christmas and happy holidays.
Namaste.

Shiba Inu about to Explode One of the trending Meme Coin is Ready to Explode.
SHIBA INU . We can clearly see a Reversal and has given a Breakout of the Bearish Trend after Bouncing from a Strong Support Zone.
It has also broken above 100 Day Moving Average.
We can probably see it retest the Breakout zone and that would the best time to enter this trade.
Note that a Massive Burn of Shiba coin is scheduled on Dec 26th
Not a Financial Advice #DYOR

ULTRACEMCO : entry & exit is very important
: try to manage money management
: know your stop loss
: find the chart pattern / analysis the chart before you enter
: TO KNOW MORE DETAIL ABOUT MONEY MANAGING STRATEGY
: gainprofit066

BTC 📈↗️🌝Moving average is a widely used Technical indicator . As of now BTC made a bullish candle after taking support from 200 SMA .Can rally to 54600 as it is a Fibonacci level and 100 SMA is near by.

Can Bitcoin Recover Now? End Of Year Rally Early Signals!It is true that the bears have been shinning and Bitcoin took a timeout from any additional growth.
We've seen red and red...
Aren't you tired?
We want a bullish Bitcoin... Yes or no?
No need to hit LIKE now or FOLLOW... Let's read first and if you enjoy the analysis...
Bitcoin (BTCUSD) Daily Timeframe Chart Analysis | Early Bullish Signals
Bitcoin peaked 10-Nov. 2021 at $69,000.
It crashed by a massive 39% and this correction has been going for 40 days strong.
Bitcoin is the eternal bull.
Bitcoin is always bullish...
Even if we are to get lower prices;
Nothing moves in a straight line, we have to see a bounce and that's exactly what is likely going on.
Let's get technical.
The first "early signal" is the RSI, it hit its lowest level since May 2021 over 6 months ago.
Once Bitcoin hits oversold it normally tends to move up.
The RSI hit these levels and has been in accumulation mode, after accumulation a bullish breakout is the norm.
If you look at the MACD, still on the bearish side but we are early... See it below:
We have the classic bullish cross after a higher low.
Last time we had this signal, with the histogram going green, prices moved up.
Last but not the least is the EMA50 and EMA100 bearish cross.
This is a mid-term bearish signal but when it comes up an imminent bounce can take places as the green arrows show.
It is not only the chart...
I got this feeling telling me that Bitcoin is going up!
Do you agree?
Feel free to hit LIKE now and FOLLOW!
Thanks a lot for the continued support.
Namaste.

Bitcoin Weekly Close Analysis | Is There Any Hope or Crash AheadForget about hitting like & follow. Let's read!
Bitcoin weekly is still trading above a very important level and that is EMA50 ($44720).
This is a critical support.
Last time EMA50 was tested as support between May and July. The level held and prices moved up.
So far EMA50 weekly was hit only on the 29-Nov. week. This and the previous week prices have been trading above this level on low volume.
Staying above support can lead to a pullback but, if EMA50 breaks prepare for another strong, long, fast lower-wick as we saw in early December ( see here ).
We have additional signals on this timeframe like the MACD bearish cross and bearish divergence but we already looked at those in a previous article ( see here ).
On the daily timeframe, BTCUSD is trading below EMA10 and MA200. This is bad news.
Closing below MA200 specifically today would signal that the bears are not done yet short-term.
If Bitcoin is to recover it needs to happen fast or else we will see another strong crash in a matter of days...
Now you can hit LIKE and FOLLOW.
Thanks a lot for your continued support.
Namaste.

BTC - BitcoinBtc has broken it's 4hr support. It is currently retesting it to go sub 45k in short term. Should wait for a candle close below the green box before taking any short position.

Ethereum On The Weekly | Tips To Make Money Trading!I was looking at Ethereum (ETHUSDT) daily and was having a hard time deciding which way to go, what to look for, what is happening now and what is likely to happen next.
I set the timeframe to weekly (W) and multiple signals showed up right away.
Ethereum Chart Analysis by Alan Santana
Looking at this chart, ETHUSDT has been correcting since November.
Prices have been dropping since.
This week ETHUSDT goes below EMA10 for the first time since September where it lasted only a few days.
Before prices would always trade above EMA10 since July.
Going below EMA10 would definitely favor the bears but here is the thing... Closing below it now can signal multiple months or more of bear market, there is so much room for lower.
Now, above EMA10 or $4070 the short-term bullish potential is reignited; Currently, the bears (red) are in control.
Ethereum vs Tether (ETHUSD) Additional Chart Signals
We have a bearish cross on the MACD. Full blown.
We have bearish divergence with the MACD and RSI, very strong as well. This divergence has been present since May.
MACD histogram is going red while the RSI is trending lower.
I sold around mid-Nov...
I am wondering if I sold enough?
Anyways, I am ready for multiple months...
When prices go really low, we call it a "buyers" market and that's when the time comes to load up.
The market moves in cycles, it just goes up and down, up and down, down and up...
To be successful in this game plan long-term.
Never consider a drop in your capital as a loss.
You only lose if you sell below your buy price.
Don't need to consider an increase in your capital as a win.
You only win if you sell above your buy price...
You see how that works?
The markets will always fluctuate...
It will be always going up and down, down and up.
Being successful or not will depend on your trading plan, your strategy and mainly your goals.
If your goal is to generate just a few $ks per month with a good capital, you don't need to trade much.
If you are trying to get rich quick, make money fast, then you are very likely to end up losing it all.
If you can make money fast;
You can make money slow.
If you cannot make money in 10 years or 5 years, you won't be able to make it in 3 days or 3 weeks.
So, try and see how much money you can make in 1 year (maybe 3 months) trading and if you are successful you can try and make money faster but keep in mind that most people will end up losing if they are trading without a plan, in the long-run.
Instead of focusing on quick/fast money, focus on sound, well thoughtout, planned, long-term, long-lasting, stable, beautiful money.
:D
Thanks a lot for your support.
Namaste.

$AVAX to 190! Rising Wedge & Hidden Bullish DivergenceHave a glance at the above chart. We see AVAX has been following a rising wedge kinda pattern and according to fibonacci retracements & Fib Time we have 190 on the table. Also pay attention to the bounce that might happen according to the rising wedge, we also see a hidden bullish divergence Hold your bags!
DYOR 💎🤝

Inverse Head And Shoulder - FOR EDUCATION PURPOSE ENS/USDT might form ih&s on 12 hr time frame. If bitcoin remain stable the it will break upward. ENS is also WEB 3.0 project and seeing current Web 3.0 trend, possibility of breaking ih&s in upward direction increases.


C

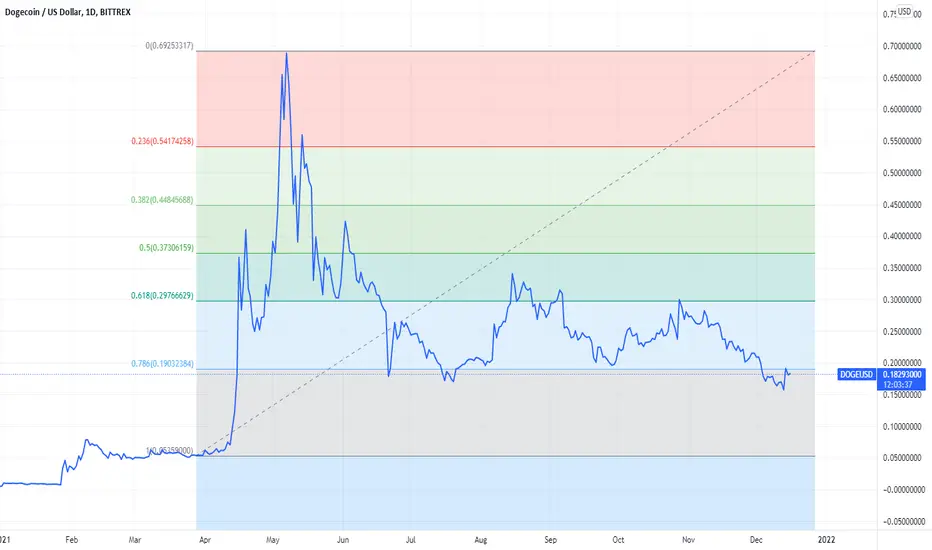
Fibonacci Retracement 61.8%DOGE Coin -- Readying itself for next move after a long base around 61.8% Fib levels and previous support around the same levels.
DIsclaimer: View for Education Purpose, not a trading advice.
Fibonacci Retracement 61.8%Shib should form its base around these levels to begin the next upmove
Disclaimer: View for Education purpose only, not to be taken as trading advice.

Bitcoin Bearish Correction Still On!Hello my fellow trader, how are you feeling today?
The Bitcoin correction we looked at recently is still on, we are aiming for lower prices.
The black line stands for MA200 ($46,910).
Below this level the next bearish impulse can happen.
Above MA200 we are on support.
Current critical support range $44,700 - $47,000.
For additional details read the previous trade ideas below:
Bitcoin Monthly Full Chart Analysis (4-Dec.)
Bitcoin Weekly Support Levels Past History | EMA300/MA200 at $18K (4-Dec.)
Warning! How Far Down Will Bitcoin Go? $44K, $30K, $20K & More (3-Dec.)
Thank you for reading.
Namaste.

Rounding Bottom Pattern on Weekly TFRounding Bottom Pattern on Weekly TF
ETHERUM to outperform Bitcoin in upcoming times as the price action tells.
Disclaimer: view for educational purpose only, not to be taken as trading advice.

Are boom-bust cycles over? Is Bitcoin going up forever?Bitcoin has had 2 primary bear markets (two years each time), first 2014-2015 and then 2018-2019. We assume this pattern is going to continue but we may be overlooking the fact that Bitcoin's macro role has changed.
This is no longer a fringe asset. It may still be perceived as somewhat speculative but it's a trillion-dollar market. What if Bitcoin has sufficiently matured that we no longer see prolonged bear spells? While it may lapse into brief spells of corrections, the primary trend is retained and it keeps going up forever.
Just something to consider.
