Bearish Continuation Setup After Dead-Cat Bounce (1H)
What the chart is saying:
Clear bearish trend: Price has been making lower highs and lower lows. The broader structure is decisively bearish.
Range breakdown: The blue box shows a consolidation range that broke to the downside, confirming continuation rather than accumulation.
Strong sell-off into demand: Price aggressively dropped into the red support zone (~62k–64k), where buyers stepped in hard, creating a sharp bounce.
Relief rally, not reversal: The current move up is a retracement, not a trend change. Momentum looks corrective, not impulsive.
Key resistance zone (~71k–72k):
This green area is previous support turned resistance
It aligns with the breakdown level → classic short opportunity
Planned trade idea (as drawn):
Entry: Into resistance (green zone)
Invalidation: Clean acceptance above resistance
Target: Prior support / liquidity pool around 63k
R:R: Favorable if rejection confirms
Bias:
📉 Bearish below resistance
Only a strong breakout + hold above 72k would weaken the short thesis
What to watch next:
Rejection wicks, bearish engulfing, or momentum divergence at resistance
Volume drying up on the push into the green zone
Failure to reclaim broken structure
⚠️ This setup assumes trend continuation, not a bottom. Until structure flips, rallies are sell-the-rip candidates.
Cryptolevels

Cryptocurrency Trading: Bitcoin, Ethereum, and Altcoins1. Understanding Cryptocurrencies
At its core, a cryptocurrency is a digital or virtual asset that uses cryptography for security. These assets are decentralized, meaning they are generally not controlled by a central authority like a government or bank.
Bitcoin (BTC): Launched in 2009 by the pseudonymous Satoshi Nakamoto, Bitcoin is the first and most widely recognized cryptocurrency. It operates on a decentralized ledger called the blockchain and is often considered a “digital gold” due to its scarcity and store-of-value characteristics. Bitcoin’s price is highly sensitive to macroeconomic factors, investor sentiment, and adoption trends.
Ethereum (ETH): Created in 2015 by Vitalik Buterin, Ethereum introduced programmable smart contracts, enabling decentralized applications (dApps) to run on its blockchain. Ethereum’s ecosystem supports DeFi (Decentralized Finance), NFTs (Non-Fungible Tokens), and other innovations. ETH’s price movements are influenced not only by market speculation but also by the adoption of its network and upgrades, such as the transition to Ethereum 2.0.
Altcoins: Any cryptocurrency other than Bitcoin and Ethereum is considered an altcoin. Examples include Ripple (XRP), Cardano (ADA), Solana (SOL), and Dogecoin (DOGE). Each altcoin may have unique use cases, consensus mechanisms, and communities. Traders often target altcoins for higher short-term gains due to their volatility, but they also carry higher risk and lower liquidity compared to BTC or ETH.
2. Types of Cryptocurrency Trading
Cryptocurrency trading can be categorized based on the duration and style of trading:
Spot Trading: This involves buying and selling actual cryptocurrencies on an exchange. Traders profit from price fluctuations without leveraging positions. Spot trading is straightforward and is ideal for beginners.
Margin Trading: Traders borrow funds to amplify their positions. For example, a 5x leverage allows you to trade five times your capital. While margin trading increases profit potential, it also magnifies losses, and liquidation risks are high during volatile market swings.
Futures and Derivatives Trading: Futures contracts allow traders to speculate on the price of cryptocurrencies without owning the underlying asset. Derivatives include perpetual contracts, options, and swaps. These instruments provide opportunities for hedging, arbitrage, and speculative trading but require strong risk management skills.
Algorithmic Trading: Some traders use bots and algorithms to execute trades automatically based on technical indicators, price patterns, or arbitrage opportunities. Algorithmic trading requires coding knowledge or access to trading platforms with prebuilt bots.
3. Key Trading Strategies
Successful cryptocurrency trading is a combination of research, strategy, and discipline. Some commonly used strategies include:
Day Trading: Traders open and close positions within the same day to profit from intraday price movements. This strategy requires constant monitoring of the market, quick decision-making, and a solid understanding of technical analysis.
Swing Trading: Swing traders hold positions for several days to weeks to capitalize on medium-term price trends. This strategy relies heavily on trend analysis, support and resistance levels, and chart patterns.
Scalping: Scalpers aim to make small profits from frequent trades, often holding positions for minutes or hours. Scalping demands high-speed execution, low transaction costs, and precise market timing.
HODLing: Derived from “hold,” HODLing involves buying and holding cryptocurrencies for the long term, believing in their future value appreciation. Bitcoin and Ethereum are popular choices for HODLers.
Arbitrage: Traders exploit price differences between exchanges by buying on one platform and selling on another. While theoretically low-risk, arbitrage opportunities are often short-lived and require fast execution and low fees.
4. Technical and Fundamental Analysis
Trading decisions are often informed by two primary approaches:
Technical Analysis (TA): TA involves studying price charts, volume, and market indicators to forecast future price movements. Common tools include moving averages, RSI (Relative Strength Index), MACD (Moving Average Convergence Divergence), Fibonacci retracements, and candlestick patterns. TA is crucial for short-term traders and day traders.
Fundamental Analysis (FA): FA focuses on the underlying value of a cryptocurrency. This includes network activity, adoption rates, developer activity, partnerships, regulatory news, and macroeconomic factors. For instance, Ethereum’s price is influenced by the growth of DeFi applications and the ETH 2.0 upgrade.
5. Risks in Cryptocurrency Trading
Cryptocurrency trading is inherently risky due to its volatility and lack of regulation in some jurisdictions. Key risks include:
Price Volatility: Cryptocurrencies can swing 10–20% in a single day. Sudden news events, market sentiment shifts, or regulatory announcements can trigger massive price movements.
Regulatory Risk: Governments may introduce regulations that impact trading, taxation, or even the legality of cryptocurrencies in certain regions.
Security Risk: Exchanges and wallets are targets for hackers. Using hardware wallets, enabling two-factor authentication, and avoiding unregulated platforms can reduce exposure.
Liquidity Risk: Low-volume altcoins may be difficult to buy or sell at desired prices, leading to slippage or losses.
Psychological Risk: Emotional trading can result in impulsive decisions, chasing losses, or FOMO-driven buying. Maintaining discipline is essential for long-term profitability.
6. Choosing the Right Exchange
Selecting a cryptocurrency exchange is critical. Traders should consider:
Security: Look for exchanges with strong security protocols, insurance funds, and a track record of handling breaches.
Liquidity: Higher liquidity ensures better execution of trades with minimal slippage.
Fees: Trading, withdrawal, and deposit fees can significantly impact profits, especially for frequent traders.
Features: Advanced charting tools, leverage options, staking, and futures trading can influence your trading style.
Regulation and Reputation: Exchanges registered in reputable jurisdictions with clear KYC/AML policies offer better reliability.
7. Portfolio Management and Diversification
Even in cryptocurrency trading, diversification is key. Allocating funds across multiple coins, including Bitcoin, Ethereum, and promising altcoins, can reduce risk. Position sizing, stop-loss orders, and taking profits at predefined levels help manage volatility and protect capital.
8. Trends Shaping Cryptocurrency Trading
Several trends are transforming cryptocurrency trading:
Decentralized Exchanges (DEXs): Platforms like Uniswap and PancakeSwap allow peer-to-peer trading without intermediaries, promoting decentralized finance.
Stablecoins: Cryptocurrencies pegged to fiat currencies, such as USDT and USDC, offer traders a safe haven during market downturns.
NFTs and DeFi: Non-fungible tokens and decentralized finance applications are creating new trading opportunities beyond conventional crypto assets.
Institutional Adoption: Increasing interest from hedge funds, banks, and corporations provides greater liquidity and legitimacy to the market.
9. Regulatory Considerations
Regulations vary by country. In India, cryptocurrencies are legal but heavily monitored, and taxation applies to gains. Traders must stay updated on government policies, tax obligations, and exchange compliance requirements to avoid legal pitfalls.
10. Conclusion
Cryptocurrency trading is a blend of art and science, combining technical skills, fundamental research, risk management, and emotional discipline. While Bitcoin and Ethereum dominate the market due to their liquidity and established networks, altcoins provide opportunities for higher returns—and higher risk.
Traders should approach this market with caution, continuous learning, and a well-defined strategy. Whether engaging in short-term trades or long-term HODLing, understanding market dynamics, technology trends, and risk management practices is essential to navigate the volatile and exciting world of cryptocurrency trading.
In summary, cryptocurrency trading is not just about chasing profits but about understanding the technology, analyzing market behavior, and making informed decisions in an ever-evolving financial landscape.

Cryptocurrency & Digital Asset MarketsIntroduction
The rise of cryptocurrencies and digital assets represents one of the most significant innovations in financial markets over the last decade. Originating with Bitcoin in 2009, cryptocurrencies have evolved from a niche technology experiment into a multi-trillion-dollar ecosystem encompassing thousands of digital assets, decentralized finance (DeFi) protocols, non-fungible tokens (NFTs), stablecoins, and blockchain-based applications. These markets challenge traditional financial structures by providing decentralized, borderless, and programmable forms of money and value transfer. Understanding the structure, dynamics, and risks of cryptocurrency markets is crucial for investors, traders, and policymakers alike.
Cryptocurrency and Digital Asset Basics
Cryptocurrencies are digital or virtual currencies that use cryptography for security, making them resistant to counterfeiting. Unlike fiat currencies, cryptocurrencies operate on decentralized networks, primarily using blockchain technology—a distributed ledger that records all transactions transparently and immutably.
Bitcoin (BTC): The first and most widely recognized cryptocurrency, designed as a decentralized digital alternative to traditional currency.
Altcoins: Other cryptocurrencies such as Ethereum (ETH), Cardano (ADA), Solana (SOL), and Ripple (XRP) with specific use cases beyond payment, including smart contracts, decentralized applications (dApps), and finance.
Stablecoins: Cryptocurrencies pegged to traditional currencies like USD (e.g., USDT, USDC) to minimize volatility and serve as a medium of exchange in digital markets.
Tokens: Digital assets built on existing blockchains, representing assets, access rights, or utilities within ecosystems.
Digital assets encompass a broader category beyond cryptocurrencies. They include NFTs, tokenized securities, and digital representations of real-world assets. Digital assets are programmable, tradable, and often interoperable across blockchain networks.
Market Structure
Cryptocurrency markets differ from traditional financial markets in several key aspects:
Decentralization: Unlike stock or bond markets, many cryptocurrency markets operate without a central exchange or authority. Peer-to-peer trading, decentralized exchanges (DEXs), and blockchain protocols allow transactions without intermediaries.
24/7 Trading: Cryptocurrency markets never close. Trading occurs continuously, globally, providing high liquidity opportunities but also exposing participants to constant market risk.
Market Participants: Participants include retail investors, institutional investors, miners, validators, and algorithmic trading bots. Institutional adoption has grown in recent years, introducing products like cryptocurrency ETFs, futures, and custody services.
Exchanges: Cryptocurrencies trade on centralized exchanges (CEXs) like Binance, Coinbase, and Kraken, which provide liquidity, custody, and compliance. Decentralized exchanges like Uniswap and Sushiswap operate without intermediaries, using smart contracts to facilitate trades.
Price Determinants
Cryptocurrency prices are influenced by multiple factors:
Supply and Demand: Fixed supply (e.g., Bitcoin’s 21 million cap) versus demand from investors, institutions, and retail users.
Market Sentiment: News, social media, and macroeconomic events can significantly impact crypto prices due to market psychology and herd behavior.
Regulation: Legal frameworks in different countries affect adoption and trading. Positive regulation encourages investment, while bans or restrictions can trigger sell-offs.
Technological Developments: Upgrades to blockchain protocols, new network features, or innovations in scalability and security can drive price appreciation.
Macro Factors: Inflation, interest rates, and currency depreciation indirectly influence crypto adoption as an alternative store of value.
Key Market Segments
Spot Market: The direct buying and selling of cryptocurrencies at current prices. Spot trading is the foundation of crypto markets.
Derivatives Market: Includes futures, options, and perpetual contracts allowing traders to hedge, speculate, or leverage positions. Derivatives markets add liquidity but increase systemic risk.
Decentralized Finance (DeFi): A rapidly growing sector offering lending, borrowing, yield farming, and automated market-making without traditional banks. DeFi uses smart contracts to automate financial services.
NFT Market: Non-fungible tokens represent unique digital assets such as art, collectibles, or virtual real estate. NFTs are changing the way ownership and creativity are monetized.
Tokenized Assets: Traditional assets like real estate, commodities, or stocks are increasingly tokenized to enable fractional ownership, faster settlements, and cross-border liquidity.
Trading and Investment Strategies
Cryptocurrency markets offer diverse opportunities, but they are highly volatile and risky. Common strategies include:
HODLing: Long-term holding of cryptocurrencies based on belief in their future adoption and value appreciation.
Day Trading: Short-term trading to exploit price volatility within intraday movements.
Swing Trading: Capturing medium-term price trends over days or weeks.
Arbitrage: Exploiting price differences between exchanges or markets.
Staking and Yield Farming: Earning rewards by locking cryptocurrencies in networks or DeFi protocols.
Market Risks and Challenges
Cryptocurrency and digital asset markets are exposed to several unique risks:
Volatility: Price swings of 10–20% in a single day are common. Extreme volatility can lead to significant gains or catastrophic losses.
Security Risks: Hacks, scams, phishing, and vulnerabilities in smart contracts or exchanges have historically caused large financial losses.
Regulatory Uncertainty: Governments worldwide are still defining legal frameworks. Sudden regulations can restrict access or impact asset values.
Liquidity Risk: Smaller cryptocurrencies may have low trading volume, making it difficult to enter or exit positions at desired prices.
Technological Risk: Blockchain bugs, network forks, and software vulnerabilities can disrupt trading and asset functionality.
Market Manipulation: Low liquidity and lack of regulation in some areas make cryptocurrencies susceptible to pump-and-dump schemes and price manipulation.
Adoption and Institutional Participation
Institutional adoption has accelerated the growth of cryptocurrency markets:
Major financial institutions now offer crypto custody, trading, and investment products.
Hedge funds, pension funds, and insurance companies are allocating portions of their portfolios to digital assets.
Payment companies like PayPal and Mastercard facilitate crypto transactions.
Central banks are exploring Central Bank Digital Currencies (CBDCs), potentially integrating digital assets with traditional monetary systems.
Regulatory Landscape
Regulation remains a defining factor in the future of crypto markets:
Countries like the United States and the European Union are working on clear regulatory frameworks covering taxation, anti-money laundering (AML), and investor protection.
Some nations, such as El Salvador, have adopted cryptocurrencies as legal tender.
Others, like China, have banned crypto trading and mining, illustrating the wide divergence in global policies.
Regulatory clarity is expected to increase market legitimacy, attract institutional capital, and reduce systemic risks.
Future Trends
DeFi Expansion: Decentralized finance is expected to grow, providing more sophisticated financial services without intermediaries.
Web3 Integration: Blockchain technology will underpin digital identity, social networks, and decentralized applications, creating new ecosystems for value exchange.
Layer-2 Scaling: Solutions like Ethereum’s layer-2 protocols aim to reduce transaction costs and increase network speed.
Interoperability: Cross-chain solutions will enable seamless asset transfers between blockchain networks.
Sustainable Practices: Energy-efficient consensus mechanisms like Proof-of-Stake (PoS) will gain traction over energy-intensive Proof-of-Work (PoW) models.
Conclusion
Cryptocurrency and digital asset markets represent a paradigm shift in how value is created, transferred, and stored. They combine technological innovation with financial markets, providing opportunities for speculation, investment, and new financial services. However, these markets remain highly volatile, technologically complex, and subject to regulatory uncertainty. Successful participation requires a strong understanding of blockchain fundamentals, market dynamics, risk management, and strategic foresight. As adoption grows and regulation matures, digital assets are likely to become a mainstream component of global finance, reshaping economies, investment strategies, and the financial system itself.

BTCUSD 45-Min Chart — Support Reclaim Setup After Sharp Breakdow
Chart Analysis:
Market Structure:
Clear bearish break from the prior range near 87k resistance, followed by a strong impulsive sell-off → confirms a bearish market shift.
Support Zone (Key Area):
Price is reacting around 80,600–81,000, a marked demand/support zone. This is the first meaningful base after the dump.
Current Price Action:
BTC is testing support after a lower high, suggesting sellers are losing momentum. Wicks into support show buying interest, but confirmation is still needed.
Entry Logic:
The marked entry near 80.6k assumes:
Support holds
A bounce + reclaim of minor structure (above ~82k)
Targets:
TP1: ~83.2k (range midpoint / liquidity)
TP2: ~83.7k (previous consolidation)
Final Target: ~87.1k resistance (major supply zone + breakdown origin)
Bias Summary:
Short-term: Tactical long from support
Invalidation: Clean break and close below 80.6k
Overall trend: Still bearish until 87k is reclaimed
Takeaway:
This is a counter-trend long setup — high reward, but only valid if support holds and momentum flips. Conservative traders should wait for a confirmed reclaim above 82–83k before committing.

Introduction to Cryptocurrency and Digital AssetsBlockchain Technology: The Backbone
At the heart of cryptocurrencies is blockchain technology, a distributed ledger system that records all transactions across a network of computers. A blockchain consists of a chain of blocks, each containing transaction data, timestamp, and a cryptographic hash of the previous block. This design ensures:
Transparency: All transactions are visible to network participants.
Security: Cryptographic algorithms protect against fraud and unauthorized alterations.
Decentralization: No single entity controls the ledger, reducing the risk of manipulation.
Immutability: Once recorded, transactions cannot be changed or deleted.
Beyond just financial transactions, blockchain enables smart contracts—self-executing agreements coded into the blockchain—which expand the utility of digital assets into areas like decentralized finance (DeFi), supply chain management, and digital identity verification.
Types of Cryptocurrencies and Digital Assets
1. Cryptocurrencies:
Cryptocurrencies are digital currencies designed to work as a medium of exchange. They include:
Bitcoin (BTC): The first and most well-known cryptocurrency, used as a store of value and medium of exchange.
Ethereum (ETH): A platform cryptocurrency that enables smart contracts and decentralized applications (dApps).
Stablecoins: Cryptocurrencies pegged to fiat currencies like USD (e.g., USDT, USDC), designed to reduce volatility.
Altcoins: Alternative cryptocurrencies with varied purposes, such as Ripple (XRP) for cross-border payments or Cardano (ADA) for sustainable blockchain operations.
2. Digital Tokens:
These are blockchain-based units that can represent a variety of assets:
Utility Tokens: Provide access to a platform or service, like Binance Coin (BNB) for exchange fee reductions.
Security Tokens: Represent ownership of real-world assets such as shares, bonds, or real estate, regulated under securities laws.
Non-Fungible Tokens (NFTs): Unique tokens representing ownership of digital or physical items like art, music, or collectibles.
3. Tokenized Assets:
Blockchain allows real-world assets—stocks, real estate, commodities—to be converted into digital form, making them easier to trade, fractionalize, and secure.
Use Cases of Cryptocurrencies and Digital Assets
Financial Transactions and Remittances:
Cryptocurrencies enable peer-to-peer payments without intermediaries, reducing fees and transaction times for international transfers.
Decentralized Finance (DeFi):
DeFi platforms use smart contracts to offer banking services like lending, borrowing, and yield farming without traditional banks.
Digital Ownership and NFTs:
NFTs revolutionize digital ownership, allowing artists, gamers, and content creators to monetize their digital creations and maintain provable ownership.
Investment and Speculation:
Cryptocurrencies and digital assets are increasingly seen as investment vehicles, attracting both retail and institutional investors seeking diversification and high returns.
Cross-Border Payments and Financial Inclusion:
Cryptocurrencies provide access to financial systems for unbanked populations, offering secure and cost-effective cross-border transactions.
Supply Chain and Identity Verification:
Blockchain’s transparency ensures traceability of goods, anti-counterfeiting measures, and secure digital identities.
Advantages of Cryptocurrencies and Digital Assets
Decentralization reduces reliance on central banks and financial institutions.
Transparency and security make financial operations more trustworthy.
Efficiency in cross-border transactions and settlements.
Innovation potential with smart contracts and tokenization.
Financial inclusion, particularly in regions with limited access to banking.
Challenges and Risks
Despite their promise, cryptocurrencies and digital assets face significant challenges:
Volatility: Prices can fluctuate wildly, making them risky for investors and unstable as currencies.
Regulatory Uncertainty: Governments vary in their approach to regulation, ranging from outright bans to active adoption.
Security Concerns: Hacks, scams, and loss of private keys pose risks to users.
Scalability Issues: Popular networks like Ethereum have faced congestion and high transaction fees.
Environmental Impact: Proof-of-work-based cryptocurrencies, such as Bitcoin, consume enormous amounts of energy.
Adoption Barriers: Limited understanding, technological literacy, and infrastructure issues slow mainstream adoption.
Regulation and Legal Landscape
Governments worldwide are exploring how to regulate cryptocurrencies and digital assets to prevent fraud, money laundering, and market manipulation while enabling innovation. Regulatory approaches include:
Licensing cryptocurrency exchanges.
Taxation on transactions and holdings.
Oversight of stablecoins and digital banking platforms.
Creating central bank digital currencies (CBDCs) as regulated alternatives.
Countries like Japan and Switzerland have embraced crypto-friendly regulations, whereas others like China have restricted trading and mining activities.
Future of Cryptocurrencies and Digital Assets
The future of digital assets is promising but uncertain. Key trends include:
Integration with traditional finance: Banks and financial institutions are increasingly exploring crypto custody, trading, and payment systems.
Expansion of DeFi: More financial services may migrate to decentralized networks.
Tokenization of assets: Ownership of real-world assets will become more flexible, liquid, and transparent.
CBDCs and hybrid models: Central banks are exploring digital currencies that combine regulation with blockchain efficiency.
Greater mainstream adoption: Merchants, consumers, and enterprises may increasingly accept cryptocurrencies for payments and investments.
The evolution of cryptocurrency and digital assets could redefine how value is stored, transferred, and created globally, challenging traditional financial systems while opening new opportunities for innovation, inclusion, and efficiency.
Conclusion
Cryptocurrencies and digital assets represent a revolutionary shift in the way people perceive and interact with money, ownership, and digital ecosystems. While they bring enormous opportunities for financial innovation, inclusion, and efficiency, they also carry inherent risks related to volatility, security, and regulation. The continued development of blockchain technology, smart contracts, tokenization, and decentralized finance is likely to shape the future of global finance, making it more transparent, accessible, and efficient. As adoption grows, understanding the fundamentals, potential, and pitfalls of cryptocurrencies and digital assets is essential for investors, policymakers, and the general public alike.
#ETH ON THE EDGE DELTAIN:ETHUSD.P
ETH is on the edge of the cliff. If it breaks below this level, we can see a significant downward move to $2200 easily and worst case of $1500 & $1400.
Long term investors can accumulate on the supports. Follow me for more.
This indicator is provided for educational and informational purposes only.
It does not constitute financial advice, investment recommendations, or trade signals.
The creator and Systematic Traders Club are not responsible for any financial losses resulting from the use of this indicator.
Trading and investing involve risk. Always do your own analysis and use proper risk management.

Bitcoin and Major Cryptocurrency Trends1. Bitcoin (BTC) Trends
Price Volatility: Bitcoin remains highly volatile, with rapid short-term swings influenced by macroeconomic events, regulation, and institutional adoption.
Institutional Adoption: Increasing interest from hedge funds, banks, and corporate treasuries drives long-term bullish sentiment.
Store of Value Narrative: Often called “digital gold,” Bitcoin is increasingly seen as a hedge against inflation, especially in uncertain economic periods.
On-chain Activity: Metrics like active addresses, transaction volume, and miner activity influence price trends and market sentiment.
Regulatory Impact: Changes in government regulations, especially in the U.S., Europe, and Asia, significantly affect price movements.
Correlation with Traditional Markets: Bitcoin sometimes moves in correlation with tech stocks and risk-on assets, but also shows periods of decoupling.
2. Ethereum (ETH) Trends
Smart Contract Growth: Ethereum dominates DeFi, NFTs, and dApp development, driving demand for ETH.
Transition to Proof-of-Stake (PoS): Ethereum’s shift from PoW to PoS reduces energy consumption and may improve scalability, impacting price sentiment.
DeFi & Layer-2 Solutions: Ethereum layer-2 networks like Arbitrum and Optimism enhance transaction speed and lower fees, increasing network adoption.
EIP Upgrades: Ethereum Improvement Proposals (EIPs), especially those reducing supply (like EIP-1559), impact ETH scarcity and valuation.
3. Binance Coin (BNB) Trends
Exchange Utility: BNB remains strongly linked to Binance exchange growth, offering discounted trading fees and token burns.
Expansion in Binance Smart Chain (BSC): Growth of BSC ecosystem and DeFi projects boosts BNB demand.
4. Cardano (ADA) Trends
Focus on Scalability & Sustainability: Cardano emphasizes peer-reviewed research and energy-efficient PoS validation.
Smart Contract Ecosystem: Adoption of smart contracts and DeFi projects on Cardano gradually increases network utility.
5. Solana (SOL) Trends
High-Speed Transactions: Solana offers high throughput and low fees, making it attractive for NFTs and DeFi projects.
Network Stability Concerns: Occasional network outages affect confidence but do not entirely diminish adoption.
6. Ripple (XRP) Trends
Banking & Payment Use Case: XRP remains focused on cross-border payments and partnerships with financial institutions.
Regulatory Developments: Legal outcomes, especially in the U.S., heavily influence XRP price and adoption.
7. Stablecoins Trends
USD-Pegged Coins (USDT, USDC): Stablecoins facilitate crypto trading, DeFi lending, and hedging against volatility.
Regulatory Scrutiny: Central banks and governments are increasingly monitoring stablecoin issuance and reserves.
8. General Cryptocurrency Trends
DeFi Expansion: Decentralized finance continues to grow, creating new yield opportunities and borrowing/lending mechanisms.
NFT Market Evolution: NFTs are diversifying beyond art into gaming, music, and real-world asset representation.
Institutional & Retail Interest: Adoption grows across both retail and institutional investors, boosting market liquidity.
Regulatory Focus: Global authorities are increasingly framing cryptocurrency regulation, impacting taxation, exchanges, and investor protection.
Layer-2 & Scaling Solutions: Technologies like Lightning Network (Bitcoin) and Ethereum L2s reduce transaction costs and improve scalability.
AI and Blockchain Integration: Emerging trend where AI analytics and blockchain-based data management intersect, creating innovative investment and utility models.

#ETH one final hope?
One last hope for a bounce back.
If the price fails to break and hold above $3050, then we may see a downside move. The direction is still not clear.
Disclaimer:
This idea is provided for educational and informational purposes only.
It does not constitute financial advice, investment recommendations, or trade signals.
The creator and Systematic Traders Club are not responsible for any financial losses resulting from the use of this indicator.
Trading and investing involve risk. Always do your own analysis and use proper risk management.

BTCUSD – 1H | Liquidity Run → Distribution →Mean Reversion ScenePrice delivered an impulsive expansion into premium after sweeping internal liquidity from the range lows. That move was displacement, not acceptance.
We are now stalling at a prior H1 supply / EQH zone near the range high. Structure here is weak: wicks, overlap, and loss of momentum hint at distribution rather than continuation.
Narrative
Liquidity taken above recent highs
Price taps premium supply
Expect a lower high / range failure
Smart money likely reallocating shorts
Execution Bias
Shorts favored below the blue level
Invalidation only on clean H1 acceptance above supply
Downside Targets
Range mid → internal liquidity
Range lows
External sell-side resting near deep discount zone
Until price shows acceptance above supply, this remains a sell-the-rally environment.
Expansion up was the trap. Mean reversion is the play.

BTC 1H: Rejection at Supply, Bearish Continuation RiskChart Analysis (1H BTC/USD):
Major Supply Zone (~90,000–90,200):
Price was strongly rejected from this area, confirming it as a key overhead resistance. Sellers remain active here.
Fair Value Gap (FVG) / Mid Resistance (~89,000–89,500):
The red FVG zone above current price acts as a likely pullback target, but also a strong sell zone if revisited.
Current Structure:
After the rejection, BTC broke down and is consolidating below short-term EMAs, indicating bearish momentum on the 1H timeframe.
Key Support Zones:
Near-term demand: ~86,700
Major downside target: ~84,600
Loss of the 86.7k support increases probability of a deeper move toward 84.6k.
Projected Path:
The dotted projection suggests a possible pullback into resistance (87.8k–89k) followed by continuation lower, unless price reclaims and holds above the FVG.
Bias:
Below 89k: Bearish / sell rallies
Above 90.2k: Bearish bias invalidated, trend may shift bullish

ETH 1H Outlook: Key Support Retest With Potential Downside RiskKey observations:
1. Support Level Under Pressure
ETH is retesting this support multiple times.
The annotation suggests: “SUPPORT IF BREAKS THEN WE CAN SEE MORE DOWNWORD” — meaning a breakdown could trigger further selling.
2. Downside Targets
If the current support fails, the next liquidity zones highlighted are:
FVG (Fair Value Gap) around $2,950–$2,900
Extreme POI zone around $2,880–$2,850
Major support at $2,787 (marked as “next support”).
3. Upside Scenario
If support holds, ETH could bounce toward:
$3,078
$3,134
High resistance around $3,225
4. Market Structure
Several CHoCH and BOS labels indicate mixed structure, showing recent weakness but with potential for rebound if buyers defend support strongly.

Major Cycle in Crypto Market (Attention Hedge Funds)Cycle-1: Bitcoin’s First Major Boom–Bust Structure (2013–2015)
(Screenshot-1 Breakdown)
Understanding Bitcoin’s historical behaviour is essential for forecasting macro-cycles in the crypto market. This post is the first of a 4-part series, where each screenshot highlights a repeating structural pattern in BTC’s long-term market psychology. After all four cycles are explained, I will present the combined Buy, Sell or Hold conclusion for long-term investors and institutional desks.
🟦 Cycle-1 Overview (April 2013 – January 2015)
In the first major structural cycle of Bitcoin, a very clear macro behaviour emerged — a pattern that continues to repeat across all future cycles.
🔵 Step 1 — ATH (A) Formed (April 2013)
Bitcoin printed a strong All-Time High (A) in April 2013, marking the top of its first major momentum wave.
🟢 Step 2 — Breakout Above ATH (A) → New ATH (B) (Nov 2013)
Once BTC broke above Point A, it entered an aggressive parabolic rally, setting a new ATH (B) in November 2013.
This breakout phase triggered:
FOMO-driven retail participation
Sharp acceleration in volatility
Rapid expansion in price multiples
🔴 Step 3 — Post-Breakout Collapse: -75% to -80% Drawdown
After forming ATH (B), Bitcoin failed to sustain the parabolic breakout.
A deep correction followed:
–75% to –80% decline
Capitulation phase
Panic selling and liquidity contraction
This phase marks the beginning of the macro mean-reversion cycle, a consistent signature in BTC’s long-term structure.
🟣 Step 4 — Price Returns to Previous ATH (A)
The most important element of Cycle-1:
After making a new ATH (B), Bitcoin retraced back to the previous ATH (A)
Time taken: 15–17 months
This behaviour is extremely rare in traditional markets but has repeated consistently in Bitcoin’s long-term structure.
📌 Why This Cycle Matters
Cycle-1 establishes the foundation for a powerful historical pattern:
BTC tends to fall back to its previous ATH after forming a new ATH.
This phenomenon repeats due to:
Leverage washouts
Liquidity resets
Miner capitulation
Long-term holder profit-taking
Macro monetary tightening phases
This is Cycle-1.
In the next screenshots, we will see how Cycle-2, Cycle-3, and Cycle-4 follow the same structural behaviour.
⏭️ Coming Next (Screenshot-2):
“Post-2017 Cycle — New ATH → 83% Crash → Return to Previous ATH.”
Cycle-2: 2017 Parabolic Expansion → 2018–2019 Reset (Screenshot-2 Breakdown)
This is the second chart in the ongoing 4-part series highlighting Bitcoin’s macro boom-and-bust rhythm—a structural pattern that repeats regardless of market participants, liquidity cycles, or macroeconomic conditions.
Cycle-2 again confirms that Bitcoin follows a highly predictable long-term retracement behaviour after every breakout to a new All-Time High.
🟦 Cycle-2 Overview (2017–2019)
This cycle mirrors the exact structure of Cycle-1:
Break previous ATH
Establish new ATH
Drop –75% to –80%
Return to previous cycle’s ATH
Time duration: 15–17 months
Let’s break down the chart step-by-step.
🔵 Step 1 — BTC Breaks Previous ATH on May–June 2017 (Point E)
In early 2017, Bitcoin broke the previous cycle’s ATH (from 2013–2014).
This breakout point is marked as:
Point E (May–June 2017)
Acts as the new cycle support
Represents the start of the parabolic expansion leg
This breakout confirms institutional liquidity entry and the beginning of a classic crypto macro-cycle.
🟢 Step 2 — Massive Rally to New ATH (Point F) — Dec 2017
After the breakout at E, Bitcoin entered its most aggressive historical rally:
BTC exploded into a full parabolic top
New ATH formed at Point F (Dec 2017)
Extreme retail inflow and speculative leverage
ICO mania peak
This is similar to the 2013 pattern—breakout → acceleration → parabolic top.
🔴 Step 3 — Reversal and Deep Crash: –75% to –82%
Post-ATH, Bitcoin collapsed sharply:
Total Drawdown: –75% to –82%
Duration: 455 days (≈15 months)
Angle of correction: Steep capitulation slope (as shown in your chart)
ICO bubble burst + liquidity draining
Dominance reset + long-term distribution
The depth and duration match Cycle-1 almost exactly.
🟣 Step 4 — Price Re-tests Previous ATH Zone (Point G — Mar 2019)
Just like Cycle-1, Bitcoin returned precisely to the previous breakout area:
Cycle Support (E) → Retest at G
Time Duration: ≈15–17 months
Price forms a demand zone around the previous ATH
Bottoming structure completes at G (March 2019)
This confirms again:
Bitcoin always re-tests its previous ATH after forming a new ATH — within a fixed time band of ~15–17 months.
Cycle-2 perfectly aligns with the behavioural signature of Cycle-1.
📌 Why Cycle-2 Matters to Institutions
This cycle reveals Bitcoin’s predictable macro liquidity reset pattern:
Break previous ATH → Excess speculation → Parabolic top
Systemic deleveraging → –80% correction
Return to previous cycle’s ATH support
Fresh long-term accumulation
This behaviour is structurally identical across multiple halving cycles.
Cycle-3: 2020 Breakout → 2021 Mania → 2022–2023 Reset (Screenshot-3 Analysis)
This third chart demonstrates the strongest confirmation of Bitcoin’s repeating macro-cycle structure.
Despite greater institutional involvement, derivatives expansion, and global liquidity changes, Bitcoin still respected the same 75–80% retracement and 15–17-month correction window.
Cycle-3 proves the pattern is structural, not accidental.
🟦 Cycle-3 Overview (2020–2023)
Like previous cycles:
BTC breaks previous ATH
Creates a new ATH
Drops –75% to –80%
Comes back to retest the previous ATH
Same time duration: ~15–17 months
Let’s decode the chart.
🔵 Step 1 — BTC Breaks Previous ATH in Nov–Dec 2020 (Point H)
Bitcoin broke the 2017 ATH during late 2020:
Breakout Point H (Nov 2020)
This previous ATH (Point F = Point H) becomes the new major cycle support zone
Triggered institutional FOMO: MicroStrategy, Tesla, hedge funds
This breakout ignited the strongest bull run in Bitcoin’s history.
🟢 Step 2 — Bitcoin Forms a New ATH in Nov 2021 (Point I)
Following the breakout at H:
BTC surged to a macro ATH at Point I (Nov 2021)
Fueled by:
Unlimited liquidity (pandemic QE)
Institutional buyers
ETF expectations
Retail mania & leverage
This top perfectly mirrors the parabolic peaks from 2013 and 2017.
🔴 Step 3 — Deep Macro Crash: –75% to –80%
After the November 2021 top:
BTC entered a systemic deleveraging phase
Complete 2022 crypto meltdown:
Luna collapse
Celsius, Voyager, BlockFi
FTX implosion
Price fell 77% from the ATH
Duration: 485 days (~16 months)
Exactly the same timing window as the previous two cycles.
🟣 Step 4 — Retest of Previous ATH Support (Point J — Mar 2023)
Just like Cycle-1 (2013 → 2015)
and Cycle-2 (2017 → 2019):
Bitcoin again returned exactly to its previous ATH zone:
Support Retest Point J (Mar 2023)
Perfect touch of the 2020 breakout zone
Massive demand entered the market
Cycle bottom completed right on schedule
This completes the third full repeat of BTC’s long-term structural cycle.
📌 Institutional Takeaway
Cycle-3 confirms:
Bitcoin’s macro behaviour is identical across 2013, 2017, and 2021 cycles — regardless of market maturity.
Every time Bitcoin breaks its previous ATH:
It creates a new parabolic peak
Then crashes 75–80%
Then returns to retest the previous ATH level
All within a consistent 15–17 month window
This makes Bitcoin the most predictable high-beta asset on the planet at a macro timescale.
Cycle-4: Oct-2024 Breakout → Oct-2025 ATH → Mar-2027 Retest of Legacy Support
After analyzing the previous three Bitcoin macro cycles (2013–2015, 2017–2019, 2021–2023), the new chart strongly suggests that Bitcoin is following the exact same structural behaviour for the 4th time.
This idea explains why BTC may enter a 15–17 month decline starting from the Oct-2025 macro top, and why the next major demand zone sits around 30,000 USD in Mar-2027.
🟥 1. Break of Previous ATH (I = K) — Oct 2024
Bitcoin broke above its previous ATH zone in Oct 2024, exactly like in all earlier cycles:
2013 ATH break → 2013 bull run
2017 ATH break → 2020–2021 bull run
2021 ATH break → 2024 surge
2024 ATH break → current cycle
This breakout (I = K level) becomes the new structural support for the cycle bottom later.
🟩 2. BTC Forms New Macro ATH (Point L) — Oct 2025
One year later, Bitcoin printed a new ATH around Oct 2025, marking the peak of Cycle-4.
Previous cycles also peaked approx. 11–14 months after breaking the last ATH, which strengthens this model.
🔻 3. Post-ATH Crash Begins — Same Pattern, Same Angle, Same Duration
All 3 previous cycles share:
• 75%–80% decline
• Duration: 15–17 months
• Final target: previous ATH or the ATH-1 level
Your chart highlights the same decline angle and same time window (Oct-2025 → Mar-2027).
This is exactly what Bitcoin has done before:
Cycle ATH → Bottom Duration Drop Retest Level
2013 → 2015 15 months –86% Previous ATH
2017 → 2019 17 months –84% Previous ATH
2021 → 2023 16 months –77% Previous ATH
2025 → 2027 (Prediction) 15–17 months –75% to –80% Previous ATH
Nothing in the 2024–2025 structure breaks this long-term behaviour.
🟦 4. Current Price Near “N” = Retesting Breakout Support
BTC is currently trading back near the Oct-2024 breakout level, marked as:
N = Previous ATH Support Zone
Historically, this level is not the final bottom.
It is only the first macro support touch before the full 75–80% correction completes.
Because the full 15–17 month window has not yet played out, a deeper decline remains statistically likely.
🟡 5. Final Prediction — BTC Bottom Around 30,000 USD (Mar-2027)
Following cycle symmetry:
Top: Oct-2025
Drop duration: 15–17 months
Bottom: Mar-2027 (same month as previous major bottom in Mar-2023)
Target zone: $30,000 ≈ last-to-last ATH (2020 level)
This fits perfectly with all 4 historical cycles.
This means BTC may revisit the deep demand zone before the next major bull cycle begins.
📌 Final Outlook (Important for Long-Term Investors)
If Bitcoin truly repeats its macro cycle:
The best long-term buying opportunity would occur in Mar 2027
Price reading: $28K–$32K
After that, BTC begins Cycle-5 (likely targeting $180K–$250K)
This idea is not short-term trading advice; it is a macro-cycle pattern that has consistently repeated for 12+ years.
🟡 BUY / SELL / HOLD — Clear Conclusion
SELL / REDUCE RISK
If you are a trader or short-term investor, Bitcoin is in the post-ATH declining phase, which historically produces 15–17 months of lower prices.
HOLD (Long-Term Only)
Long-term holders can remain calm but should expect deep volatility, not straight-up movement.
BUY (Smart Accumulation Window)
The next high-conviction buying zone will be:
🔥 $28K–$32K
🔥 Timeline: Mar 2027
That will be the start of the next Bitcoin mega cycle (Cycle-5).
📢 Final Message
This research is not about fear or hype—it is about Bitcoin’s consistent repeating macro behaviour.
Every single major crash and rally of the last decade followed the same timing, structure, and depth.
Bitcoin is not random.
Bitcoin is cyclical.
And the cycle says:
**The real bottom is not here yet.
The real opportunity comes in 2027.**

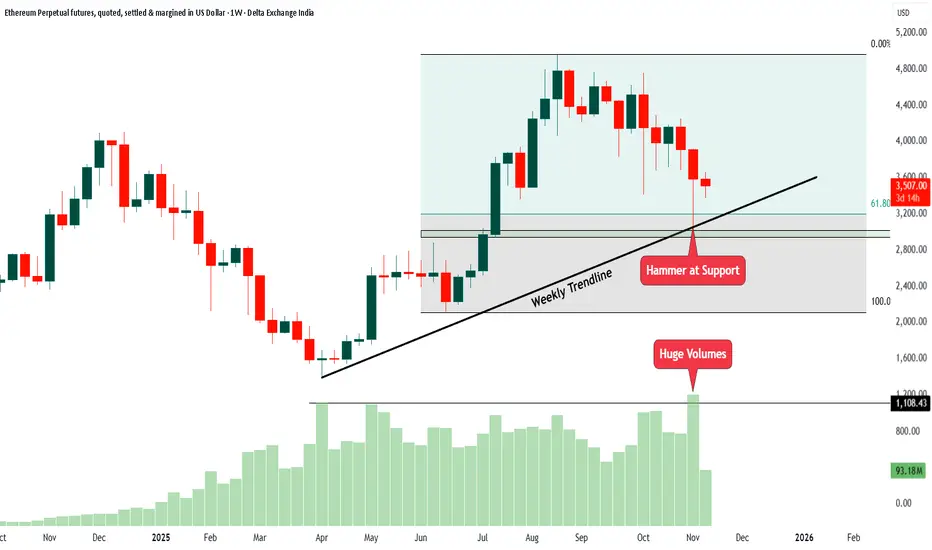
ETH Weekly Chart Analysis1. The price has been respecting a weekly trendline for many months. This trendline acts like a support line where buyers usually come in.
2. Recently, the price fell towards this same trendline and created a hammer candle. A hammer at support often shows that sellers pushed the price down, but buyers stepped in strongly and pulled it back up. This is usually a sign of buying interest.
3. The hammer candle formed exactly near the support zone and the Fibonacci 61.8 percent area. This area often works as a strong reversal point.
4. When the hammer candle formed, the volume was very high. Huge volume at support means big players were actively buying at lower levels.
5. The price is still inside a wide range between recent highs and lows. It has not broken out yet, but the support reaction is positive.
In simple words, the chart is showing a strong bounce setup from support with a hammer candle and high volume. This is a sign that buyers may try to take control again as long as the price stays above the trendline and support area.
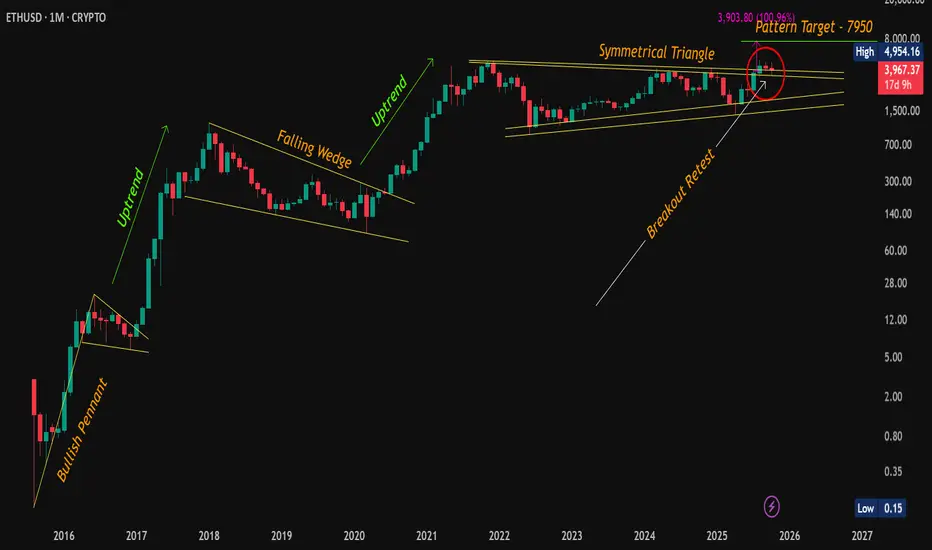
ETH Retest Confirmed – Bullish Momentum Intact!CMP: $3,968
Ethereum is holding strong above the symmetrical triangle breakout zone after a textbook breakout + retest . Despite the recent consolidation, the structure remains bullish , and the bigger pattern is still in play.
🔶 Technical Highlights:
✅ Symmetrical Triangle Breakout: ETH successfully broke out and retested the upper trendline (see red circle). This retest confirms the breakout validity.
✅ Consolidation Above Resistance: ETH is consolidating in a tight range above previous resistance , forming a potential bull flag .
✅ Pattern Targets Remain Active:
📍 Symmetrical Triangle Target: ~$7,950
📍 Bull Flag Target (if breakout confirms): ~$7,365+
📈 Market Structure:
📍 Previous breakouts (Bullish Pennant in 2016, Falling Wedge in 2019) led to strong uptrends .
📍 Current consolidation mirrors historical patterns that preceded major rallies.
🟢 Key Level to Watch:
📍 A monthly close above $4,954.16 (previous ATH) would mark the next major confirmation, likely attracting breakout traders and institutions.
💡 ETH is showing maturity in structure – breakouts, retests, and consolidations are happening on higher timeframes with clear technical precision. The longer this base holds, the stronger the eventual move could be.
📌 Disclaimer: This analysis is shared for educational purposes only. It is not a buy/sell recommendation. Please do your own research before making any trading decisions.
#ETH | #Ethereum | #Crypto | #Breakout | #ChartPatterns | #SymmetricalTriangle | #BullFlag | #PriceAction
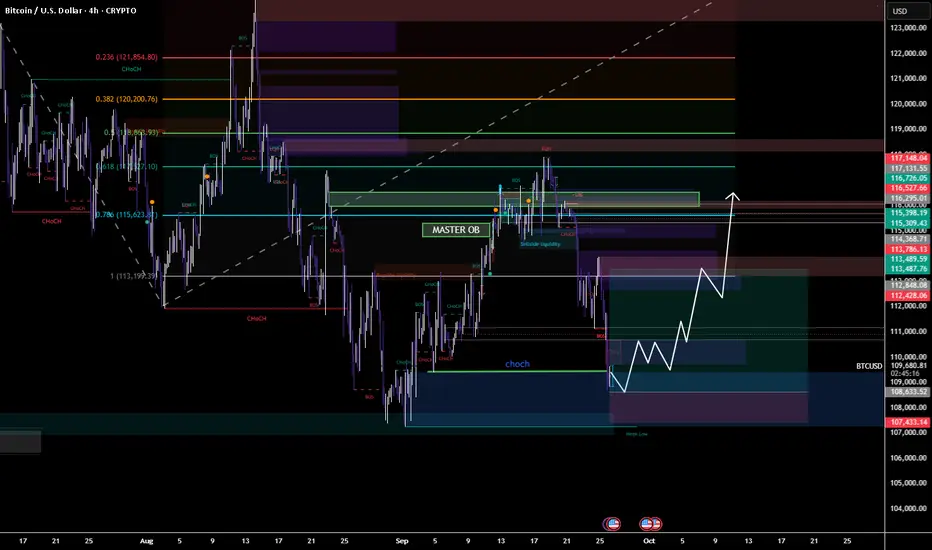
BTC - Long1. The colored horizontal areas show Fibonacci retracement levels, which traders use to spot possible support and resistance zones where the price might reverse or continue its move.
2. The 0% level is at the top (115,943) and the 100% level is at the bottom (109,523).
3. The price is currently near 113,207 and close to the 50% (112,732) and 61.8% (111,975) retracement levels.
4. Volume bars at the bottom show how much Bitcoin is being traded at each time.
5. If price bounces from the 50% or 61.8% levels (these are green and blue zones), traders can consider buying (long entry), hoping the price will go up. Always watch for a reversal candle or increased volume at these levels before entering.
6. Place your stop-loss just below the 61.8% level. For example, below 111,975.
7. Set your first target near the 38.2% level (113,490) and second target near the 23.6% level (114,428).
8. If price breaks below the 61.8% level with strong volume, avoid buying and look for a sell setup instead.
9. This setup uses common trading concepts like Fibonacci, support and resistance, and volume confirmation. Remember to wait for confirmation signals and manage risk with stop-loss orders.

XAUUSD (Gold) Trading Ideathis is for educational purpose only
it clearly explains how to handle 2-point stop-loss and retry logic (max 3–4 times) for automation or manual trading
Wait for a green candle close above the 4088 level before entering.
Confirm the breakout with strong volume support.
The green line acts as your entry trigger zone.
Entry Level: 4088 (Green Line)
Exit Level: 4151 (Red Line)
Stop-Loss: 2 points
Max Attempts: 3–4 times per setup
The red line (4151) is the final exit target.
Keep a tight 2-point stop loss for controlled risk.
Rejection may happen 2–3 times near the entry zone — stay patient.
Avoid early entries before confirmation.
Watch for volume expansion during breakout candles.
Use 30-minute time frame for accuracy and clarity.
Once confirmed, ride the move toward the 100% level at 4117.
Partial profit booking is advised near 4117 zone.
Move SL to cost after price closes above 4100.
Avoid trading if candle closes below 4088 again.
The momentum remains bullish as long as price stays above 4088.
Red candle rejection below entry zone means wait again for setup.
Don’t chase enter only after a confirmed breakout.
Keep your chart clean and focus on price + volume behavior.
Plan your trade before execution , no impulsive entries.
Respect SL — discipline ensures long-term success.
Always analyze candle behavior near major levels before deciding.
Enter on candle close above 4088 with volume confirmation.
SL: 2 points below entry.
Targets: 4117 (first), 4151 (final).
Expect 2–3 rejections — wait for confirmation.

BTC Bulls Eyeing a Reversal From Liquidity SweepBTC Bulls Eyeing a Reversal from Liquidity Sweep”
📌 Description:
Bitcoin swept downside liquidity near 108k, tapping into a demand zone. If this level holds, expect a strong recovery toward the 113.5k–116.5k supply zones, with the Master OB acting as a key magnet for price.
📈 Trade Plan (4H BTCUSD)
🔹 Entry Zone (Long):
108.0k – 109.0k (liquidity sweep + demand zone).
🔹 Stop Loss (SL):
Below 107.0k (weak low / invalidation).
🔹 Take Profit (TP):
TP1: 112.4k (minor FVG close)
TP2: 113.8k – 114k (OB retest zone)
TP3: 115.5k – 116.2k (major supply / Master OB)
🎯 Risk-to-Reward (approx):
Entry: 108.5k
SL: 107k (≈ -1.5k / -1.3%)
TP1: 112.4k (≈ +3.9k / +3.6%) → RR ≈ 1:2.7
TP2: 114k (≈ +5.5k / +5%) → RR ≈ 1:3.8
TP3: 116.2k (≈ +7.7k / +7.1%) → RR ≈ 1:5.2
⚡ Clean long setup: liquidity sweep → bullish CHoCH → push into OB/supply above.
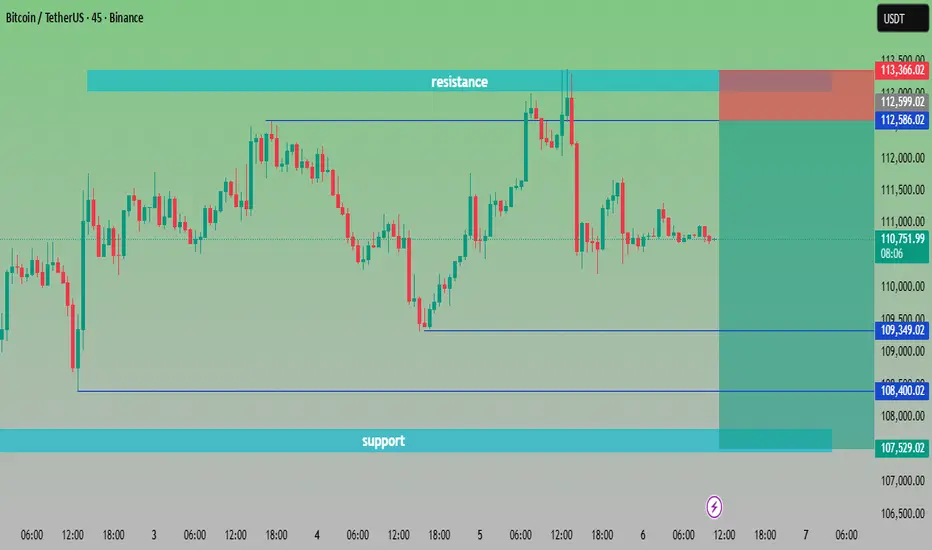
“BTC/USDT at Crossroads | Key Levels to Watch🔎 Chart Analysis – BTC/USDT (45m)
Resistance Zone: Around 112,586 – 113,200 USDT. Price has tested this area multiple times but failed to break out, confirming strong selling pressure.
Support Zone: Around 107,529 – 108,400 USDT. Buyers have consistently defended this zone, making it a key demand area.
Current Price: 110,720 USDT, sitting in the middle of support and resistance.
📌 Scenarios:
Bullish Case 🟢🚀 – If BTC breaks above 112,586 USDT, momentum could push toward 113,500+ USDT.
Bearish Case 🔴📉 – If BTC fails to hold 109,349 USDT, price may retest the deeper support around 107,500 USDT.
⚖️ Trading Plan Idea:
Long Entry: Above 112,600 breakout ✅
Short Entry: Below 109,300 breakdown ❌
Target Zones:
Upside 🎯 → 113,500+
Downside 🎯 → 107,500
Bullish Trade Setup for XRP/USD - Pattern CompletionThis is a bullish setup based on a harmonic pattern completing, with the price approaching a key resistance zone. Our entry, stop-loss (SL), and take-profit (TP) levels are clearly marked on the chart.
Entry: 3.0628
The entry point is marked when the price reaches the ideal level for the pattern completion.
Take Profit (TP): 3.1832
This is the target area where the price is expected to move towards, as per the harmonic pattern and previous price action.
Stop Loss (SL): 2.9627
The stop-loss is placed below the low of the last structure to protect from unexpected price movement.
Technical Analysis:
Pattern Identification:
A clear bullish harmonic pattern is visible, with points X, A, B, C, and D forming a potential Bat or Gartley pattern. This type of setup has historically shown a high probability of reversal or continuation at point D.
Price Action Confirmation:
The price has already shown some signs of reversal at point C, with increasing buying volume at the current levels.
The market sentiment is strong, and we are entering at a point where the pattern completion aligns with the overall bullish market structure.
Volume:
There is a noticeable increase in volume as the price approaches the resistance zone (point X), supporting the idea of a bullish breakout.
Risk-to-Reward (RRR):
The setup offers a 1:2.56 RRR, which is well within an acceptable range, ensuring that the potential reward outweighs the risk taken on the trade.
Why This Trade Makes Sense:
Pattern Confirmation: The harmonic pattern is completing, and price action aligns with the expectations of a move higher.
Key Resistance Break: If the price breaks above the marked resistance, this could signify a strong continuation of the bullish trend.
Solid Risk Management: With a well-placed stop loss, the trade is risk-managed while giving the price room to move.
This setup provides a good risk-to-reward ratio and a high probability of success, based on the technical confluence of the harmonic pattern and price action.

"Bitcoin Eyes $100K Re-Entry: Retest, Support Zone, Then Push ?Chart Analysis
1. Price Structure & Trendlines
The chart displays a former upward trendline that has been broken, leading to a corrective pullback.
Following that, price is perched within a “retest zone” (the red-shaded rectangle), which aligns with both historical horizontal resistance—now turning into support—and an area of previous consolidation. This is a classic setup: price often retests key breakout levels before resuming its move.
2. Support Levels
The main support is clearly drawn around the $100K zone, highlighted by a grey bar below the retest zone. This is a psychological and structural area to watch for potential strong buying.
Immediate support appears near $110K–$112K, as noted by the lower edge of the red retest area—this zone has shown to catch corrections before in technical analysis and news reports
AInvest
Mudrex
Barron's
.
3. Resistance & Upside Targets
If the retest holds, the chart charts a potential bounce toward the upper rising trendline and beyond, potentially aiming for the $126K–$130K region, as marked by Fibonacci retracement levels.
This aligns with several external forecasts suggesting resistance or target zones in that range
AInvest
Mudrex
Barron's
.
4. Potential Price Path & Scenarios (Denoted by Red Arrows)
Bearish Scenario: Price may dip down into the retest zone, test support, and—if the breakdown occurs—continue lower toward $100K—a key area of interest.
Bullish Scenario: The support holds, leading to a V-shaped recovery that propels price back above $115K, potentially triggering a rally toward $122K–$130K.
Summary Table
Key Zone / Level Significance & Note
$110K–$112K Critical near-term support; breakdown risks move toward $100K
AInvest
Mudrex
Retest Zone (~$114K–$115K) Area combining horizontal support and trendline; serves as pivot for next move
Mudrex
AInvest
$120K–$123K Major resistance where a breakout could fuel continuation toward $127K–$130K
Mudrex
Barron's
Broader Context & Market Sentiment
Bitcoin is currently consolidating after setting new highs near $124K
MarketWatch
The Economic Times
Barron's
Cointribune
.
Analysts observe that sustaining above the $110K–$112K band is essential to the bullish case; falling below it could invite deeper downside
Barron's
Cointribune
AInvest
.
Conversely, a decisive move above $120K–$123K could validate continuation toward $127K–$130K, and even higher—some forecasts extend to $135K and beyond
Mudrex
Indiatimes
Barron's
CoinCodex
.
Final Thoughts
Your chart beautifully illustrates the classic “retest after breakout” dynamic:
Hold above the retest zone? Look for a rebound toward $120K+, with the potential for a full bullish revival aiming for $130K.
Break below $110K–$112K? Watch for a possible move toward $100K—a critical support level.
Stay alert to macro catalysts too—like Federal Reserve interest rate signals, institutional inflows (ETFs), and regulatory developments—which could steer the next leg substantially

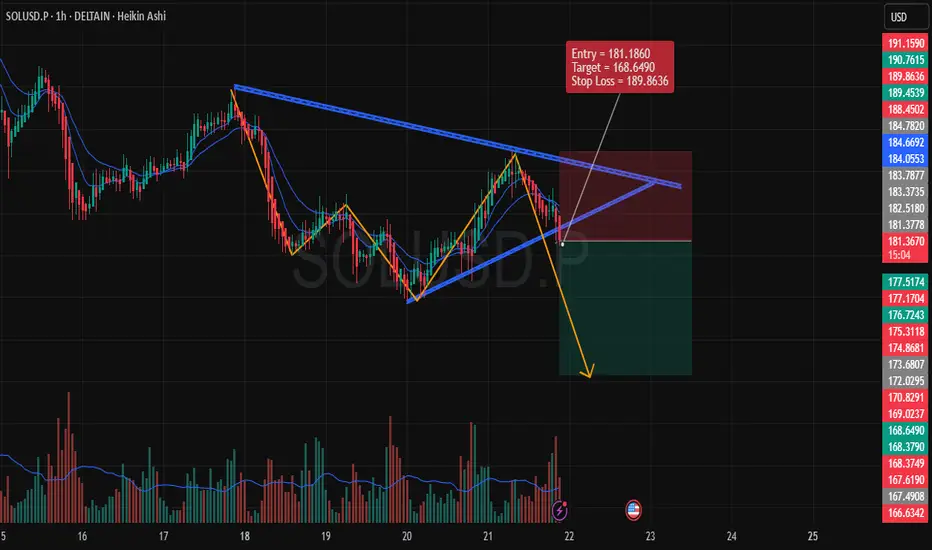
Bearish Setup on SOLUSD (1-Hour Time Frame)Entry Price: 181.1860
Target: 168.6490
Stop Loss (SL): 189.8636
1. Chart Analysis
We are observing a descending triangle pattern formation, which generally signals a bearish continuation once the price breaks downward.
The price action has already shown signs of rejection at the upper boundary of the pattern, reinforcing the possibility of a breakout to the downside.
2. Indicators & Confirmation
Volume Analysis: Noticeable spike in volume during the recent downward movement, which indicates strong selling pressure. This is crucial for confirming the potential bearish trend.
EMA Confluence: The price is below the 9 and 20 EMAs, which are crucial indicators of the current market trend. The EMAs are acting as dynamic resistance, further supporting the bearish scenario.
3. Risk Management
The stop loss is placed above the most recent significant high at 189.8636. This placement ensures that we protect against any false breakouts or short-term price reversals.
The target at 168.6490 is derived based on previous support levels and a measured move from the triangle pattern. This target is realistic given the market structure.
4. Price Action
The price action shows lower highs and lower lows, a typical characteristic of a downtrend. If this pattern holds, the next logical price move is to break downward through the support of the triangle.
5. Conclusion
Overall, this setup provides a solid bearish opportunity, backed by technical patterns and strong momentum indicators. The risk-to-reward ratio is favorable, making it a well-structured trade.
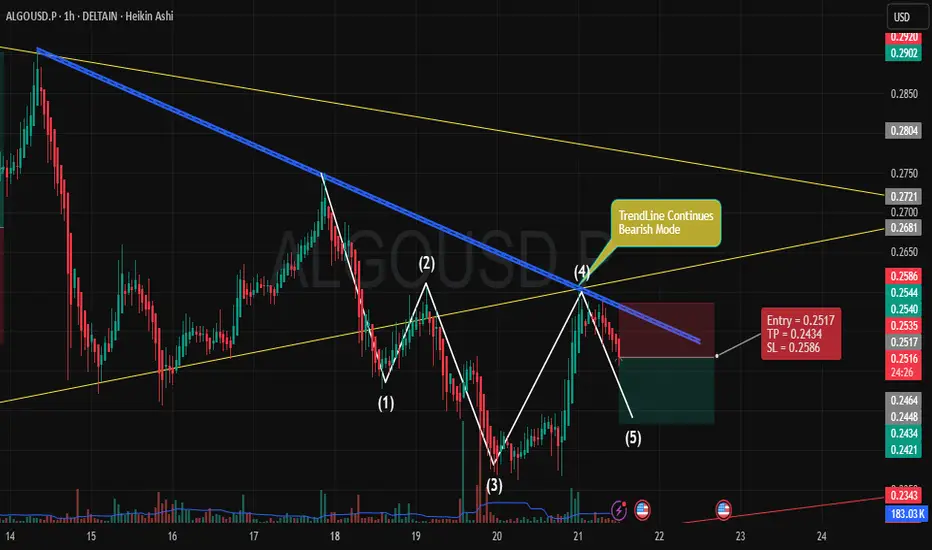
Bearish Continuation for ALGOUSD** IF you like my observation, please boost and follow for more content."
Trade Overview:
Entry: 0.2517
Stop Loss (SL): 0.2586
Take Profit (TP): 0.2434
Key Points:
Trend Analysis:
The price is currently under a bearish trend as indicated by the downward sloping blue trendline. This trendline shows consistent resistance, rejecting price rallies and continuing the bearish bias.
The yellow trendlines represent key support and resistance zones, highlighting the consolidation range where the price has been fluctuating within a defined pattern.
Market Structure:
Price has formed a lower high (marked as point 4), followed by a lower low (point 5), confirming the continuation of the downtrend. This suggests that the market is likely to keep pushing lower towards the target.
The price has retraced upwards but has failed to break the bearish trendline, reinforcing the idea of further downside potential.
Entry Strategy:
Entry Point: We are entering at 0.2517, just below the recent resistance, anticipating the price to continue downward after failing to breach the trendline.
The price action at point (4) suggests weakness in the upward movement, making this a prime opportunity to capitalize on further downside movement.
Risk-Reward Setup:
The Stop Loss is set at 0.2586, just above the last swing high, giving room for minor retracements while protecting against a breakout above the trendline.
The Take Profit is set at 0.2434, targeting the next level of support where the price could potentially find buying interest. This gives a favorable Risk-Reward Ratio of about 2:1.
Volume Confirmation:
Notice the increase in volume during the downward movement, suggesting that sellers are in control. A drop in volume during price retracements further validates the weak bullish momentum and confirms the expected continuation to the downside.
Why This Setup?
The bearish trend, price action, and trendline rejection all align with a continuation trade setup.
The risk-reward is favorable, with a clear structure to exit the trade if the price moves against the position.
The broader market context is also in line with a bearish outlook, making this a high-probability trade setup for the next few hours.
XRP/USD Trade Setup: Bearish Position on Technical AnalysisTimeframe: 1 Hour
Entry Price: 3.0229
Take Profit (TP): 2.8769
Stop Loss (SL): 3.1199
1. Market Overview
XRP is currently in a bearish phase, and the price action indicates that a downward continuation is likely. The market has been rejecting higher levels, with strong resistance at the 3.1777 zone, and now the price appears to be moving lower.
2. Entry Criteria:
The entry point is set at 3.0229, just below the current price level, where we anticipate the market to continue its downward movement after facing resistance at higher levels.
The recent price action shows a clear rejection from the upside, and we are expecting further downside once the price breaks below the immediate support near the entry.
3. Technical Indicators:
Heikin Ashi Candles: The chart uses Heikin Ashi candles, which help smooth the price action. The red candles indicate a bearish sentiment, confirming the continuation of downward pressure.
Volume Analysis: The increase in volume during the recent selling phase is confirming that the bears are in control and the trend may continue to the downside.
4. Support & Resistance Levels:
Resistance: The price is facing resistance around 3.1777, which has proven to be a significant level of rejection.
Support: The main support zone is located near the 2.8769 level, which coincides with our take profit (TP). This is a logical target as it aligns with previous lower levels and current trend structure.
5. Risk-Reward Ratio:
The Stop Loss is placed at 3.1199, just above the recent swing highs and resistance level, ensuring we limit risk in case of a market reversal.
The Take Profit is set at 2.8769, offering a solid risk-reward ratio of 1:1.5. This level is where we expect the price to find support and potentially reverse after hitting the target.
6. Trade Management:
Monitor Resistance Level: If the price fails to break below the entry and starts moving upward, consider adjusting the stop loss or exiting the position to limit losses.
Trailing Stop: Once the price starts moving in your favor, consider implementing a trailing stop to lock in profits as the price moves lower.
7. Potential Risks:
False Breakdown: A false breakdown is always a risk, where the price could temporarily dip below the support and reverse, hitting the stop loss before continuing lower.
Market Volatility: Be mindful of the inherent volatility in the crypto market, which can lead to sudden reversals due to news or other external factors.
8. Conclusion:
This trade setup is based on a bearish market structure, where price is showing clear resistance and the potential for further downward movement. The setup is logical with a strong risk-reward ratio and a clear target for profits. As always, risk management is crucial, and it's important to monitor price action closely for any signs of reversal.
Good luck, and trade carefully!
