Compression Before Expansion: Market Awaits Its Next MoveBTCUSD – Compression Before Expansion: Market Awaits Its Next Move
Bitcoin is trading within a compressed structure after rejecting key resistance and retesting support. While the overall sentiment remains cautious, the technical setup is beginning to show signs of strength — if buyers can reclaim control.
🧭 Macro Check-In: Calm Before the Crypto Storm?
No rate cut from the Fed yet, but markets are starting to price in the possibility of a pause in Q3 or Q4.
ETF inflows slowing, but institutional positions are not closing — suggesting long-term conviction remains.
Political momentum in the US is shifting towards crypto adoption, with Bitcoin emerging as a talking point in election debates.
Dollar index (DXY) continues to chop, giving crypto room to breathe if inflation data remains mild.
In short: liquidity is building, but the trigger hasn’t fired — yet.
📊 Chart Structure (H1–H4): Levels That Matter
BTC is holding just above 103,100, a key level where previous demand stepped in.
The mid-range resistance lies at 104,184 — this needs to break for bulls to gain short-term control.
Above that, eyes are on 106,047, then 107,586 (top of the descending channel).
EMA alignment is still bearish → wait for structure shift, not FOMO.
📌 Trade Map
🔵 Buy Setup
Zone: 103,100 – 103,300
Condition: Bullish reaction + rejection wick / engulfing
SL: 102,600
TP: 104,184 → 106,047 → 107,586
🔴 Sell Setup (Only if trap triggers)
Zone: 107,500 – 107,800
Condition: Rejection + volume fade
SL: 108,200
TP: 106,000 → 104,500
🧠 Trader Insight
“When the chart compresses, smart money positions early.”
Bitcoin is not trending — it's accumulating or distributing. Retail is waiting for breakout. Smart traders are preparing for both scenarios.
Watch the reaction, not the prediction.
Stay objective. Let levels lead the logic.
Cryptomarket

Institutions Option Database Trading Part-5 Risk Management in Option Trading
Even with data, risk control is key:
Max 2% capital risk per trade.
Hedge with opposite option.
Avoid low liquidity options.
Always track IV, PCR, OI live.
Building a Custom Option Scanner
With databases and logic, you can create a personal scanner for:
High IV options
OI breakout zones
PCR + Max Pain alert
Theta-rich expiry trades

Institutions Option Database Trading Part-4Advanced traders use machine learning to forecast:
Option price movement
Volatility changes
IV spikes before events
Popular Models:
Random Forest → Trend direction.
LSTM (Deep Learning) → Predict future IV.
Logistic Regression → Probability of ITM expiry.
These are trained on millions of past trades using structured databases.

Institutions Option Database Trading Part-6Deep Dive into Options Basics (For Data Traders)
Options are contracts giving the right but not the obligation to buy or sell an asset at a certain price before a set date. They are used for hedging, speculation, and generating income.
🛠️ Two Types:
Call Option: Right to buy an asset.
Put Option: Right to sell an asset.
Backtesting means testing a strategy using past data to check performance. Key for data-driven option trading.
Example:
Load 1-year option chain data for BANKNIFTY.
Apply rules: Buy Call when IV drops by 10% & PCR < 0.8.
Check PnL for each trade.
Filter for success rate > 65%.

Long Term Database TradingHow Institutions Use Option Databases
🔍 Institutional Insights:
Banks & HFTs (High-Frequency Traders) run option strategies over petabytes of data.
Real-time arbitrage opportunities are found using option databases.
They model Vega, Theta & IV impact per stock and expiry.
Example Institutional Workflow:
Pull 10 years of NIFTY options.
Train ML model to predict next-day IV.
Execute based on high-probability straddles/strangles.
Exit before expiry using trailing delta hedge.

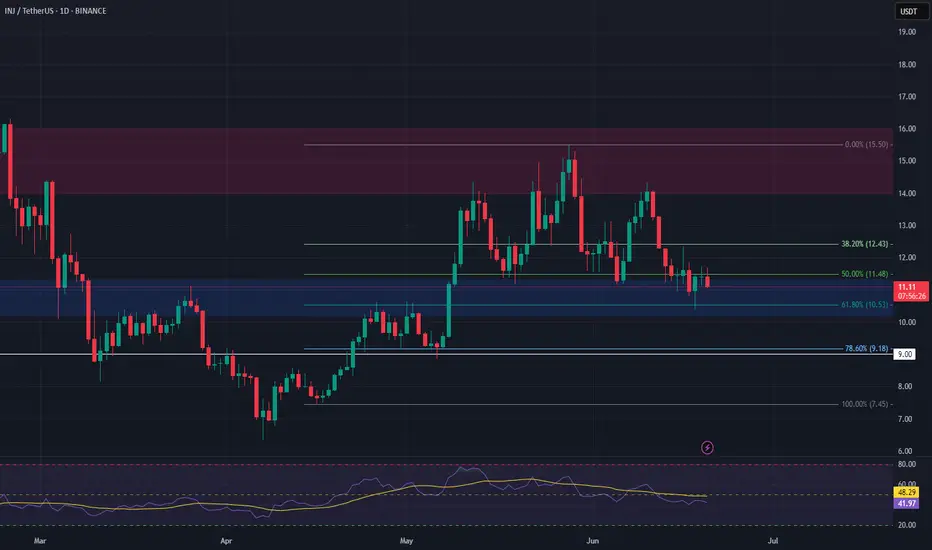
INJ Long Swing Setup – Approaching Fibonacci & Major SupportInjective (INJ) is nearing a key support zone that aligns with the 61.8% Fibonacci retracement level. This confluence area around $10.20–$11.30 offers a strong setup for a potential long swing trade.
📌 Trade Setup:
• Entry Zone: $10.20 – $11.30
• Take Profit Targets:
o 🥇 $14.00 – $16.00
o 🥈 $20.00 – $23.00
• Stop Loss: Daily close below $9.00
Learn Institution Trading Part -6Introduction to Institutional Option Trading
Institutional option trading refers to the sophisticated strategies used by hedge funds, mutual funds, insurance companies, proprietary trading firms, and foreign institutional investors (FIIs) to manage portfolios, hedge risks, and generate consistent alpha from the derivatives market. Unlike retail traders, institutions operate with large capital, access to advanced technology, and deep market insights, allowing them to structure complex trades.
2. Why Institutions Trade Options
Institutions don’t usually trade options for quick profits. Their trades are designed to meet broader objectives:
Hedging Equity Portfolios
Volatility Trading
Generating Yield on Holdings
Market Making and Arbitrage
Directional or Non-directional Speculation
3. Core Institutional Option Strategies
Let’s explore the most popular strategies that institutions use with real-world logic behind them.
A. Covered Call (Buy-Write)
Use: Income generation from long-term stock holdings
Structure: Buy stock + Sell Call Option (OTM or ATM)
Institutional Use Case:
A mutual fund holding Reliance shares might sell monthly call options against its holdings to generate monthly income (premium), enhancing total returns.

Learn Institution Trading What is Institutional Option Trading?
It refers to large-scale option strategies used by hedge funds, banks, and FIIs to manage risk, hedge portfolios, or create directional bets with high precision.
🔹 Key Institutional Strategies:
Buy-Write (Covered Call):
Holding stocks and selling calls to earn premium.
Protective Put:
Buying puts as insurance to hedge stock positions.
Multi-leg Spreads (Iron Condor, Butterfly):
Neutral strategies to profit from range-bound markets.
Put-Call Ratio Analysis (PCR):
Gauging market sentiment from institutional flow.

Advanced Divergence Trading What is Divergence?
Divergence happens when the price moves in the opposite direction of an indicator (like RSI, MACD, or Momentum). It signals a possible trend reversal or trend weakening.
🔹 Types of Divergence:
Regular Divergence (Trend Reversal):
Bullish: Price makes lower lows, but indicator makes higher lows → Reversal up
Bearish: Price makes higher highs, but indicator makes lower highs → Reversal down
Hidden Divergence (Trend Continuation):
Bullish: Price makes higher lows, indicator makes lower lows → Trend continuation up
Bearish: Price makes lower highs, indicator makes higher highs → Trend continuation down
🔹 Advanced Tips:
Use on higher timeframes for accuracy
Confirm with volume, trendlines, or price action
Combine with support/resistance or Fibonacci zones
🔹 Pro Tools to Use:
RSI (Relative Strength Index)
MACD (Moving Average Convergence Divergence)
Stochastic Oscillator
OBV (On Balance Volume)

Support and Resistance ExplainedWhat is Support?
Support is a price level where a stock tends to stop falling due to increased buying interest. Traders view it as a demand zone where bulls often enter the market.
Example: If Reliance repeatedly bounces from ₹2,700, that level is acting as support.
🔹 What is Resistance?
Resistance is a level where a stock tends to stop rising due to selling pressure. It's a supply zone where bears usually take control.
Example: If Nifty keeps failing to cross 23,500, it's a resistance level.
🔹 Why They Matter:
Help in identifying entry and exit points
Show where trend reversals may occur
Aid in setting stop-loss and targets
🔹 How to Spot Them:
Look for price bounces or rejections
Use tools: horizontal lines, moving averages, Fibonacci retracements
Confirm with volume spikes
🔹 Key Strategy:
Buy near support (low risk)
Sell near resistance (high probability)
Trade breakouts or reversals with confirmation

Support and Resistance Support Level:
A price level where demand is strong enough to prevent the price from falling further. It's like a floor—buyers enter here expecting prices to rise.
Example: If Nifty falls to 22,000 repeatedly and bounces back, 22,000 becomes a support level.
🔹 Resistance Level:
A price level where selling pressure overcomes buying, preventing prices from rising. It's like a ceiling—sellers dominate at this level.
Example: If Bank Nifty rises to 50,000 but fails to move above, 50,000 is resistance.
📊 How to Identify Them:
Historical price charts
Trendlines
Moving averages
Fibonacci levels
Volume analysis
📈 Use in Trading:
Buy near support
Sell near resistance
Use breakout strategy when price breaches either level

XRP Still in Buy Zone – Eyes on $2.50+our chart clearly marks that XRP has bounced off a strong buy zone (around the $2.10–$2.15 range), aligning well with a classic setup: price hitting support, creating a small base, and starting an upward rotation. 👇
Support area respected – The highlighted circle shows XRP revisiting the demand zone and quickly rebounding, very bullish behavior.
Lower wicks & volume spike – Indicate absorption of selling pressure and possible institutional interest.
Green arrow projection – Suggests a break above the immediate resistance (~$2.17 EMA/Ichimoku levels) could trigger a rally toward the next resistances around $2.22, $2.47, and potentially $2.63.
“Still in buy zone” annotation – Absolutely valid: as long as XRP stays above that key base ($≈$2.10), the bullish case holds.
🔍 Market Context
Range consolidation between ~$2.10–$2.30 has been the dominant theme, awaiting a breakout catalyst (e.g., ETF approvals or legal clarity)
thecryptobasic.com
+14
fxempire.com
+14
crypto.news
+14
.
Analysts highlight a falling wedge and support zone between $2.00–$2.20—if price holds, a move toward $3–$4 is plausible .
A range-bound weekly outlook anticipates a push toward $2.50 resistance before exploring higher targets .
✔️ Summary
Buy zone holding: Bullish pattern confirmed with rebound from support.
Key resistance levels: Watch for a breakout above $2.17/EMA and then $2.22–$2.30/$2.50.
Ideal strategy: Maintain position above support; add on breakout, targeting $2.50–$3.00.
Risk points: A drop below $2.10 could test $2.00 or even $1.85 support.

Advanced Institutions Option Trading - Part 8Institutional Option Trading Strategies
Let’s dive deeper into how big players operate:
🔶 Volatility Arbitrage:
Take advantage of IV mispricing across strikes/months.
Long low IV, short high IV – Net neutral delta.
🔶 Dispersion Trading:
Buy individual stock options, short index options.
Profit from correlation divergence.
🔶 Box Spread (Synthetic Arbitrage):
Arbitrage between synthetic long/short positions.
Very low risk, used by HFT desks.
Institutions use algorithms to run thousands of such strategies in real time.

Advanced Institutions Option Trading - Part 7Time Decay (Theta) Strategies
Options lose value over time due to Theta Decay.
Strategies to Take Advantage of Theta:
Selling options (Covered Calls, Naked Puts)
Calendar Spreads
Iron Butterflies
Caution:
Theta decay accelerates as expiry nears. Option sellers must hedge their deltas to stay safe.
Risk Management in Options
Institutions and pro traders always focus on capital protection.
🔐 Techniques:
Position sizing (no more than 2-3% risk per trade)
Hedging with opposite legs or underlying
Stop-loss on premium or delta exposure
Use of Greeks for real-time adjustment
Risk management > Strategy in the long run.

Advanced Institutions Option Trading - Part 6 Volatility Tools in Options
Understanding volatility is central to success in option trading:
🌀 Types of Volatility:
Historical Volatility (HV): Based on past prices
Implied Volatility (IV): Market’s expectation of future movement
📊 Volatility-Based Strategies:
High IV: Sell premium – strategies like Iron Condor, Credit Spreads
Low IV: Buy premium – strategies like Long Straddle, Long Call/Put
Tools like IV Rank and IV Percentile help traders choose the right strategy based on volatility regime.

Advanced Institutions Option Trading - Part 5Institutional Tools & Platforms
Bloomberg Terminal / Reuters Eikon: Institutional-grade data
FIX Protocols: For high-frequency option order routing
Quant Models: Statistical arbitrage using Python/R
Option Analytics Engines: Measure IV Skew, Smile, Surface modeling
Institutions don’t just trade options—they engineer risk-managed portfolios using AI and predictive analytics.
Option Chain Analysis for Traders
Option Chain provides a list of all available option contracts for a stock/index.
Key Elements:
Strike Prices
Call & Put Prices
Open Interest (OI)
Volume
Implied Volatility (IV)
Change in OI
Interpretation:
High OI + Rising Price = Strong Trend
IV Surge = High Volatility Expectation
PCR (Put-Call Ratio) = Market Sentiment Indicator
PCR > 1: Bearish sentiment
PCR < 1: Bullish sentiment

Advanced Institutions Option Trading - Part 4 Technical and Fundamental Analysis in Option Trading
Fundamental Analysis: Evaluate company value, earnings, sector performance
Technical Analysis: Price action, patterns, indicators like RSI, MACD
IV & HV Tools: Helps in choosing optimal strike prices based on volatility
Understanding market structure is essential for timing entries/exits in options.
Advanced Institutional Options Trading
Institutions like hedge funds, banks, and proprietary desks use options for complex strategies:
Delta Hedging: Maintain a neutral position
Portfolio Insurance: Using puts during economic downturns
Volatility Arbitrage: Capitalizing on volatility mispricing
Structured Products: Combine options with bonds or equities for customized payoff
These strategies require deep understanding of volatility surfaces, risk models, and massive capital.

Advanced Institutions Option Trading - Part 3Why Trade Options?
Hedging against portfolio loss
Leverage with limited capital
Income generation through strategies like covered calls
Directional trading using strategies like long calls or puts
Investment Strategy using Options
LEAPS (Long-Term Equity Anticipation Securities): Investing in long-term call options
Covered Calls: Generate income while holding stocks
Cash-Secured Puts: Earn premium while waiting to buy a stock at lower price
These are often used by investors to add flexibility and income to portfolios.

Advanced Institutions Option TradingFinancial Market is a marketplace where assets such as stocks, bonds, commodities, and derivatives (like options) are bought and sold.
Key components:
Equity Markets – Shares of companies
Debt Markets – Government or corporate bonds
Derivatives Market – Futures, Options
Currency and Commodity Markets
Options are financial contracts giving the buyer the right (not obligation) to buy/sell an asset at a set price before a specific date.
✅ Types of Options:
Call Option: Right to Buy
Put Option: Right to Sell
✅ Key Terminologies:
Strike Price: Agreed price to buy/sell
Premium: Cost of the option
Expiration Date: Validity of the contract
ITM/ATM/OTM: In-the-money / At-the-money / Out-of-the-money

TRX Long Swing Setup – Waiting for Pullback After Bullish RallyTRX has seen a strong rally over the past few days, and we’re now watching for a retracement into support. The $0.260–$0.262 zone offers a potential long spot entry as price cools off.
📌 Trade Setup:
• Entry Zone: $0.260 – $0.262
• Take Profit Targets:
o 🥇 $0.278
o 🥈 $0.292
• Stop Loss: Daily close below $0.249

Option Trading Master class Part -6What is Option Trading?
Definition:
Options are derivative contracts that give the holder the right, but not the obligation, to buy or sell an asset at a pre-decided price within a specific timeframe.
Types of Options:
Call Option: Right to buy
Put Option: Right to sell
Option Participants:
Buyers (Holders): Limited risk, unlimited reward
Sellers (Writers): Limited reward, unlimited risk
How Options Work (With Example)
Imagine Reliance stock is trading at ₹2,500.
Call Buyer: Buys a ₹2,500 Call Option by paying ₹50 premium
Scenario A (Stock goes to ₹2,600):
Intrinsic value = ₹100
Profit = ₹100 – ₹50 = ₹50 per share
Scenario B (Stock goes to ₹2,400):
Option expires worthless
Loss = ₹50 (premium paid)

Option Trading Master class Part -7Fundamentals of Stock Investing
Types of Investors:
Value Investors: Focus on undervalued companies
Growth Investors: Target high-growth potential stocks
Dividend Investors: Prefer regular income from dividends
Research Parameters:
Earnings per Share (EPS)
Price-to-Earnings Ratio (P/E)
Return on Equity (ROE)
Debt-to-Equity Ratio
Industry Trends
Tools for Investing:
Demat and Trading Account
Research Platforms (e.g., TradingView, Screener.in)
Portfolio Tracker (e.g., Zerodha Console)

Option Trading Master classIntroduction to Investing and Option Trading
Investing and option trading are two pillars of wealth creation and risk management in modern finance. Investing focuses on long-term growth by acquiring assets that appreciate over time, while option trading involves strategic bets on price movements within a defined period using derivative contracts. Together, they offer investors a combination of growth, income, and hedging capabilities.
What is Investing?
Definition:
Investing is the process of allocating money into financial instruments (like stocks, bonds, ETFs, or real estate) with the expectation of generating a return over time.
Key Objectives:
Wealth accumulation
Passive income generation
Capital preservation
Beating inflation
Common Asset Classes:
Equity (Stocks): Ownership in companies
Fixed Income (Bonds): Lending capital to earn interest
Real Estate: Physical properties generating rental income
Mutual Funds/ETFs: Pooled investments
Commodities and Gold: Inflation hedges
