GRASS–Long Swing Trade Setup After 80% Rally GRASS has seen a strong +80% move recently, and is now pulling back into a key support zone. This type of price action—post-rally consolidation at support—often precedes another leg higher, particularly if structure holds and momentum resumes.
🔹 Entry Zone:
$2.16 – $2.77 (support area & previous breakout zone)
🎯 Take Profit Targets:
🥇 $2.80 (recent high / range reclaim)
🥈 $3.50 (next major resistance zone)
🛑 Stop Loss:
$2.00 (just below structural invalidation level)
📌 Strategy Notes:
Volume surge confirms strong interest; this pullback could be accumulation.
Monitor for bullish engulfing or higher low confirmation on lower timeframes.
Maintain discipline with tight invalidation under $2.00.
If support holds and a reversal candlestick confirms, this could be a high-probability continuation setup. Let me know if you'd like a risk-reward breakdown or chart overlay!
Cryptomarket

Forecast for Long Term for INJUSDT -- Current Market Overview --
Price (as of May 28, 2025): INJ/USDT is trading at approximately $15.01, with a 24-hour increase of 4.93–10.79% and a weekly gain of 23.1–24.94%.
# Market Sentiment: Recent Wave indicate bullish sentiment, with analysts noting a breakout from a monthly demand zone and support at a weekly fair value gap (iFVG). The price has broken a higher-time-frame (HTF) downtrend, suggesting potential for further upside.
Market Cap and Volume: INJ has a market cap of $1.5B and a 24-hour trading volume of $218.9M, reflecting strong liquidity and interest.
-- Technical Analysis --
Price Action and Key Levels
# Support: The price recently found support at the $9.32–$10.00 demand zone, with a low of $6.5 in the past six months. The weekly iFVG and monthly demand zone around $10–$11 have held, acting as strong support.
Resistance: Key resistance levels are at $16.13 (short-term), $20–$25 (weekly target), and $33 (top of a multi-year descending wedge). A break above $16.13 could signal a mid-term swing toward $48.
Price Structure: INJ is in a bullish phase, having broken out from a descending wedge on the weekly chart and reclaiming the 21-day EMA. The price is trading above the 50-day SMA ($10.02) and 200-day SMA ($14.03 projected for June), indicating bullish momentum.
-- Disclaimer --
This analysis is based on recent technical data and market sentiment from web sources. It is for informational purposes only and not financial advice. Trading involves high risks, and past performance does not guarantee future results. Always conduct your own research or consult a SEBI-registered advisor before trading.
Boost and comment will be highly appreciated

BTC Bull Run Ending Soon?"September could mark the climax of Bitcoin’s bull rally, triggering a correction phase as smart money begins profit-taking — key levels like $74,457 and $48,888 may become attractive accumulation zones in the upcoming bear market."
Disclaimer : This content is for informational and educational purposes only and should not be considered financial or investment advice. Cryptocurrency trading involves significant risk and may not be suitable for all investors. Always do your own research (DYOR) and consult with a qualified financial advisor before making any trading decisions.

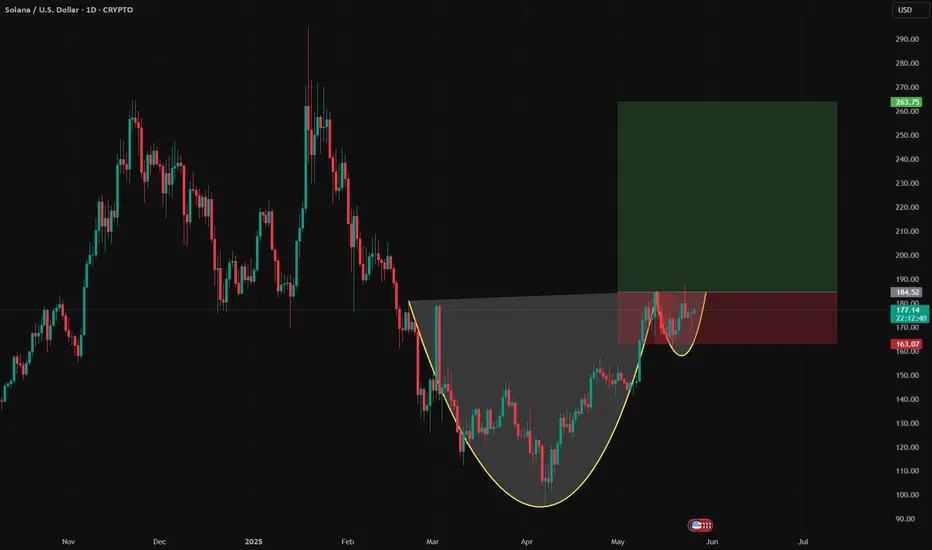
SOLUSD – Cup & Handle Structure - Near Breakout Confirmation ?Solana is currently presenting a high-conviction Cup and Handle formation on the daily chart, signaling the potential for a bullish breakout continuation if key technical levels are reclaimed with volume confirmation.
This pattern began developing after the March 2025 bottom, with price action curving up steadily over several weeks, forming a well-rounded base. The handle has recently developed as a shallow pullback on declining volatility — a favorable characteristic in this setup.
Consolidation Phase
Price moved sideways, indicating accumulation.
Breakout above 150-160 in early 2025 confirmed bullish shift.
Bullish Case:
If 185 holds, expect a retest of 200-220.
Break above 220 opens path to 265 (≈50% rally).
Bearish Risk:
Close below 165 invalidates bullish structure, targeting 150.
Relief Rally or Trap Before the Next Big Drop? BTC/USD PLAN – MAY 24 | Relief Rally or Trap Before the Next Big Drop?
Bitcoin is showing signs of a technical rebound after rejecting from the 111k region. However, macroeconomic factors and investor sentiment are sending mixed signals that require caution moving forward.
🌍 MACRO OVERVIEW:
The US Dollar remains strong, supported by persistent high Treasury yields — putting pressure on risk assets like crypto.
New tariff tensions between the U.S. and China are shaking markets and tightening global liquidity, which may weigh on speculative assets including Bitcoin.
BTC ETF inflows have declined for the second week in a row, suggesting institutions are becoming more cautious after the recent rally.
📈 TECHNICAL OUTLOOK (H1 Chart):
After bouncing from the key support around 106,800, BTC has initiated a mild retracement toward the 0.5 Fibo at 109,300.
Short-term bullish target lies at the 110,000–111,947 area — a heavy confluence zone of supply, trendline resistance, and previous bull trap zone.
A failure to break 111,900 may lead to a strong correction back to 106,800, and if that fails, a deeper drop toward 102,567 is likely — a high-liquidity demand zone.
📌 TRADE SETUPS:
🔵 SHORT-TERM BUY SCALP:
Entry: 108,300 – 108,500
Stop Loss: Below 107,900
Take Profit: 109,300 – 110,000 – 111,947
Look for bullish reaction if BTC forms a higher low and stays inside the channel.
🔻 MAJOR SELL SCENARIO:
Entry: 111,800 – 112,000
Stop Loss: Above 112,300
Take Profit: 110,000 – 108,500 – 106,800 – 102,500
Favor short setups if price fails at resistance and shows rejection with lower volume or bearish candles.
⚠️ Caution:
Bitcoin is at a critical resistance zone. A breakout may trap late longs before a deep correction. If price breaks and holds above 112k, the bullish trend may resume toward new highs.
🎯 Stick to your zones. Don’t chase price. Use proper risk control.

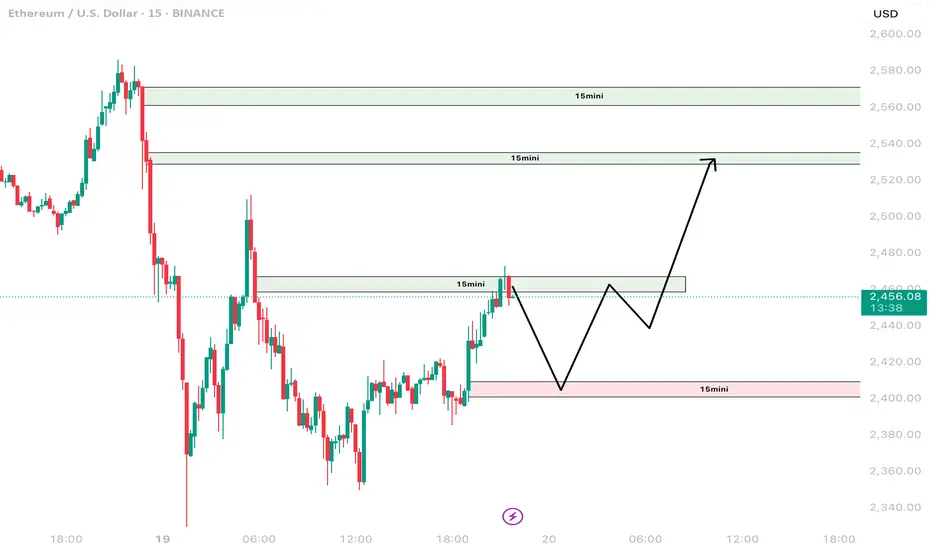
ETHEREUM | Technical Analysis 20th May 2025Hi,
I am sharing my daily view on ethereum for 20th May, 2025.
If you like my analysis then please share and like this post.
Disclaimer: This is only for educational purpose.
Thanks.
BITCOIN - SYMMETRICAL TRIANGLE FORMING WITHIN A BULLISH TRENDSymbol - BTCUSDT
Bitcoin is consolidating. A symmetrical triangle pattern is forming within the context of a prevailing bullish trend. Based on the current technical setup, it is reasonable to interpret this consolidation as a preparatory phase for a continuation of the upward movement.
Fundamental nuances have gradually improved over recent weeks, contributing to a moderate revival in the cryptocurrency market. From a technical standpoint, the market structure on the daily chart appears constructive. Following a period of strong upward momentum, the price has entered a consolidation phase rather than showing signs of reversal. The overall market remains bullish. After approximately 2–3 weeks of consolidation, a bullish distribution pattern appears to be developing. This cycle has repeated on two previous occasions. On the daily timeframe, the presence of extended lower wicks during the consolidation phase suggests that large market participants (whales) are actively absorbing downward pressure, thereby preventing the price from entering risk zones. Accordingly, it is likely that the current consolidation could persist for a time, and there remains the possibility of a retest of the triangle’s lower boundary or even a deeper move to test the liquidity zones around 1,01,400 and 1,00,700 before resuming the upward trend.
Resistance levels: 1,03,600, 1,04,400, 1,05,000
Support levels: 1,02,500, 1,01,400, 1,00,600
A downside scenario may be considered if the price breaks through the triangle’s lower boundary and stabilizes around the 1,01,400 level, potentially forming a pre-breakdown consolidation-assuming no immediate rebound follows.
However, at present, intraday trading strategies can be considered within the range of the ongoing consolidation. A breakout to the upside and continuation of the bullish trend would likely be signaled by consolidation within the 1,03,500 to 1,05,000 range, accompanied by price compression toward the upper boundary.

DOGEUSDT IN THE DANGER ZONE - SELLERS IN CONTROL?Symbol - DOGEUSDT
DOGEUSDT is encountering sustained selling pressure. Following a distribution phase characterized by a sharp upward move, the price has entered a correction phase and is now approaching a critical support area - often referred to as the 'panic zone'. A decisive breakdown below this level could accelerate the decline and trigger a more pronounced bearish trend.
DOGEUSDT has effectively relinquished the upward momentum accumulated during late April and early May. The distribution phase concluded around the 0.2600 level, after which the coin transitioned into a corrective decline. At present, DOGEUSDT is testing the pivotal support zone near 0.2140.
The focal point now is the base of the triangle formation near 0.2140 - a critical zone of support. A breakdown below this level would likely result in the liquidation of long positions and may prompt increased selling activity, thereby fueling bearish momentum.
Resistance levels: 0.2220, 0.2307
Support levels: 0.2145, 0.2135
The prevailing scenario anticipates a continuation of the downward trend. The primary trigger for further decline would be a confirmed breakdown below the 0.2135 support level, accompanied by price consolidation beneath this threshold.
Important Note: This bearish outlook would be invalidated if the price reverses and establishes sustained consolidation above 0.2220, A confirmed move above 0.2300 would strengthen bullish sentiment, at which point a renewed upward outlook would be considered.

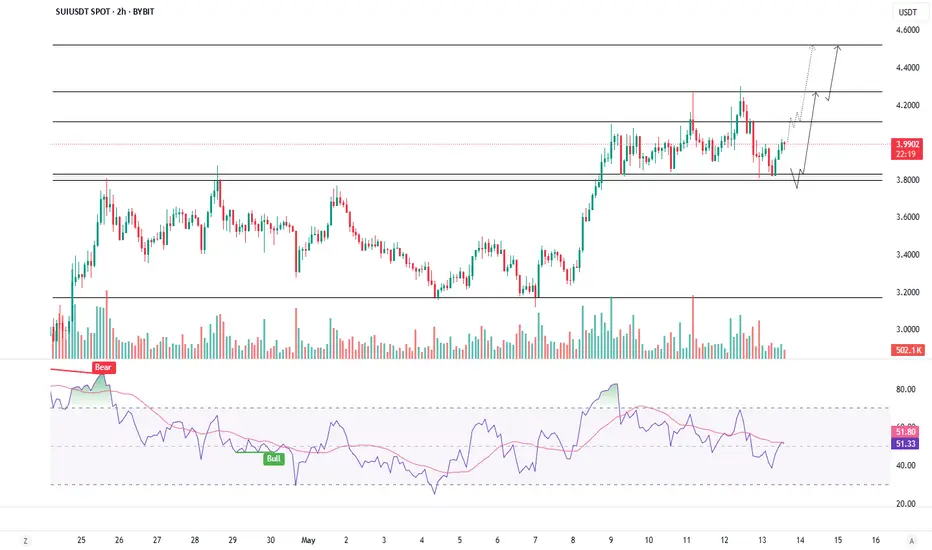
SUIUSDT HOLDING STEADY - BIG MOVE AHEAD?Symbol - SUIUDST
SUIUSDT has entered a consolidation phase within the broader context of an emerging bullish trend. Current price action highlights a zone of interest and a potential trigger area that merit close monitoring.
Market sentiment toward SUIUSDT remains constructive. The formation of a rising trend is being reinforced by Bitcoin's ongoing strength and a relatively supportive macro and fundamental backdrop.
From a technical perspective, SUIUSDT is consolidating within a range bounded by resistance at 4.1100 and support at 3.8110 Notably, a substantial liquidity pool exists below the 3.8110 support level, which has yet to be tested. This suggests a high likelihood of a false breakdown occurring before a potential continuation of the upward trend. However, should bullish momentum accelerate, buyers may defend current levels more aggressively, potentially leading to a breakout above the 4.1100-4.2750 resistance zone and subsequent price stabilization above those levels - indicating further upside potential.
Key Support Levels: 3.8110, 3.6670
Key Resistance Levels: 4.1100, 4.2750
The broader cryptocurrency market, led by Bitcoin, appears to be undergoing a liquidity gathering phase as part of a local correction within a bullish trend structure. While a brief wave of liquidations occurred yesterday, there is currently no substantive evidence of a broader market downturn. In an ideal technical scenario, SUIUSDT could retest support around 3.8110, form a false breakdown, and subsequently resume its upward trajectory.
BTC/USD DAILY PLAN – Will Bitcoin Hit 110K Before Reversing?BTC/USD DAILY PLAN – Will Bitcoin Hit 110K Before Reversing?
After a strong bullish impulse, BTC is now consolidating in a tight range between 103K–106K on the H4 chart. The ascending parallel channel remains intact, but bullish momentum is fading — a sign of potential distribution at the top.
🧠 Macro Context
BTC pumped recently thanks to ETF news and institutional inflows.
However, volume is decreasing, suggesting smart money may be offloading.
DXY and U.S. bond yields are ticking up → this could add pressure on BTC in the short term.
📊 Technical Outlook (H4 Chart)
BTC remains inside an ascending channel. Key levels to watch:
🔺 Resistance:
106,000 – local range high (H4)
110,576 – extended target if price breaks out
🔻 Support:
101,775 – bottom of current range; a breakdown here confirms weakness
94,473 – strong demand zone + EMA200
84,371 – key structural support zone if deeper correction occurs
⚠️ BTC may fake a rally toward 110K and then reverse sharply if broader macro conditions worsen.
🎯 Trading Scenarios
🔹 SCALP BUY:
Entry: 101,800 – 102,000
Stop-Loss: 100,800
Take-Profits: 103,200 → 104,000 → 105,000 → 106,000
Only enter long if price holds above 101.7K and shows strong rejection candles.
🔸 SELL ZONE:
Entry: 110,000 – 110,500
Stop-Loss: 111,200
Take-Profits: 107,000 → 105,000 → 101,775 → 94,473
Watch for exhaustion or false breakout patterns at this psychological zone.
🟢 LONG-TERM BUY ZONE:
Entry: 94,500 – 94,000
Stop-Loss: 92,500
Take-Profits: 96,000 → 98,000 → 100,000 → 103,000
Ideal for swing entries if BTC retraces into the broader demand zone.
⚠️ Key Notes:
BTC is showing signs of “rise slowly – dump fast” behavior.
Keep close watch on 101,775 – a decisive level for intraday direction.
No Fed rate cuts in sight → big money may still stay cautious.
✅ Conclusion:
Stick to trading range setups: BUY at channel base – SELL at distribution zones
Avoid FOMO and only enter trades after clear price action confirmation.
Risk management is essential during this high-trap environment.

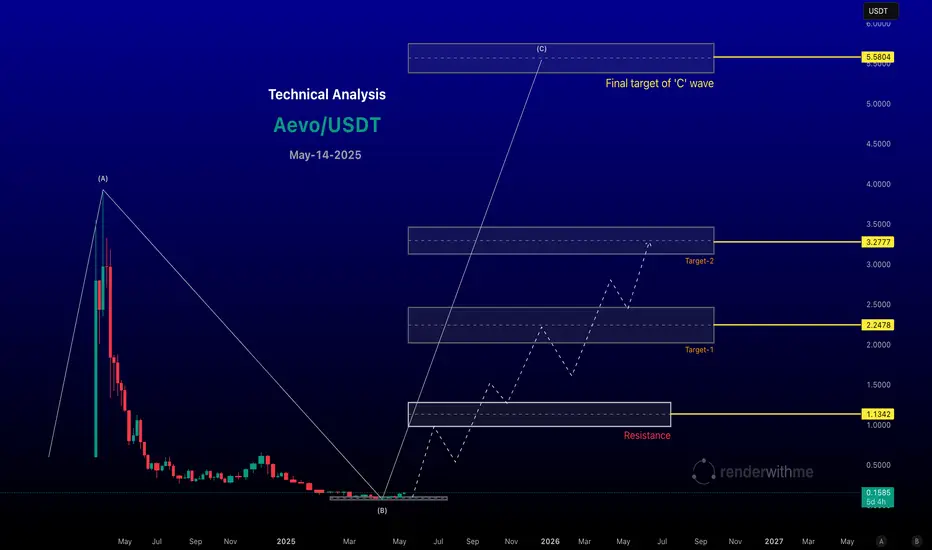
AEVO is a gem in this bull run.
Aevo has experienced significant volatility since its Binance Launchpool listing in March 2024. After a rapid rise to $3.94, it entered a prolonged downtrend, forming lower highs and lows. Recent price action suggests a potential stabilization or relief rally, supported by increased trading volume.
Aevo has experienced significant volatility since its Binance Launchpool listing in March 2024. After a rapid rise to $3.94, it entered a prolonged downtrend, forming lower highs and lows. Recent price action suggests a potential stabilization or relief rally, supported by increased trading volume.
Chart for your reference
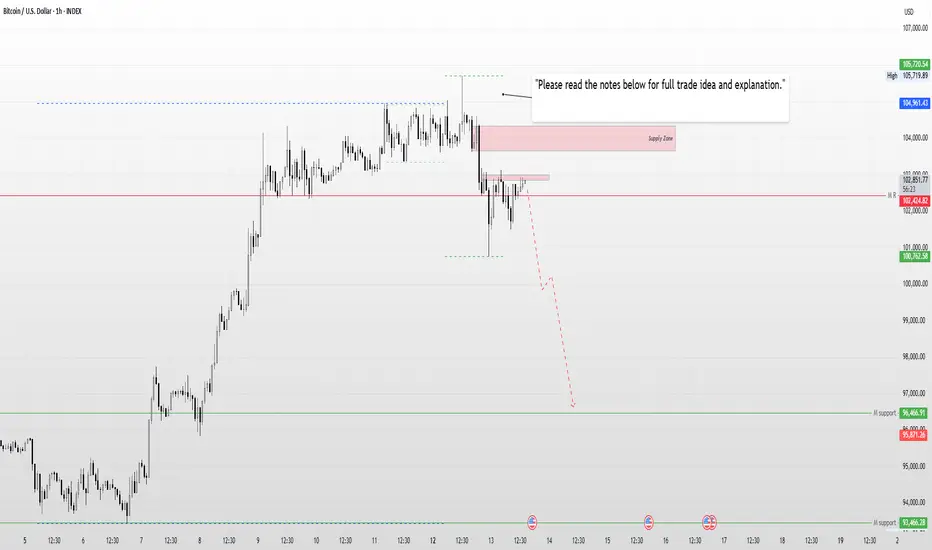
Bitcoin (BTC) Technical Outlook – Caution Advised for Retail Tra🪙 Bitcoin (BTC) Technical Outlook – Caution Advised for Retail Traders
The broader market structure for BTC remains bullish, no doubt. However, on the daily timeframe, we’ve observed a clear bearish move, indicating potential short-term weakness.
Key Resistance Levels to Watch:
First Resistance: 102,851
Second Resistance: 103,665
Both of these levels could act as potential zones for a sell-off, especially if BTC shows signs of exhaustion near these zones. If price reacts bearishly here, we could see a corrective move towards the 96,466 level, which serves as a reasonable downside target.
Important Scenario to Monitor:
If the market attempts a liquidity hunt above the second resistance at 103,665, the situation could get tricky. While this might look like a breakout, it may not sustain bearish momentum beyond that level — indicating market indecision or a possible trap.
⚠️ Final Note for Retail Traders:
BTC is currently creating confusion, and retail traders should exercise extra caution. The market might visually appear to be setting up for a sell, but could quickly reverse, shaking out early entries. Avoid trading emotionally and wait for clear confirmation before entering positions.
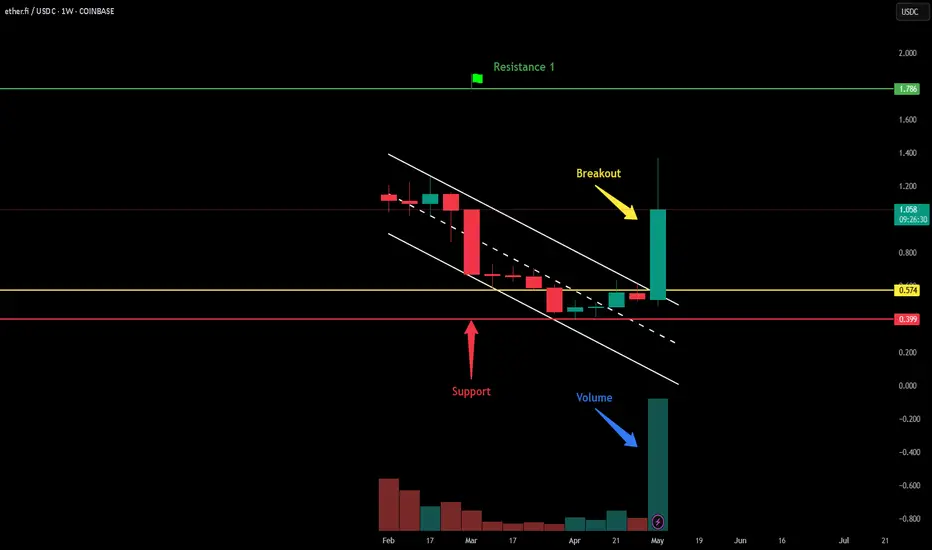
Breakout in ETHFI / TetherUS...Chart is self explanatory. Levels of breakout, possible up-moves (where crypto may find resistances) and support (close below which, setup will be invalidated) are clearly defined.
Disclaimer: This is for demonstration and educational purpose only. This is not buying or selling recommendations. Please consult your financial advisor before taking any trade.
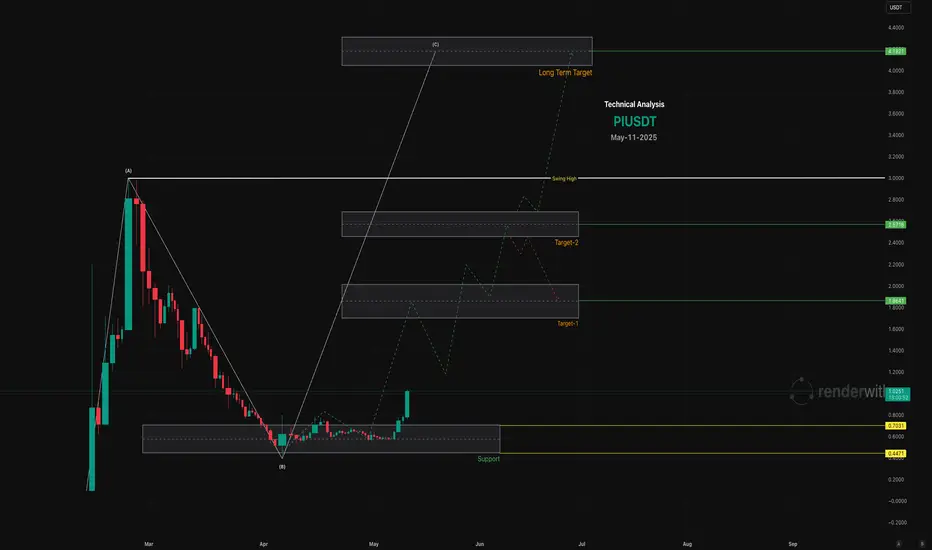
PI Network Can Touch $4 In This Bull Run
Support: Key support levels are at $0.5192, $0.5465, and potentially $0.40 (all-time low) if selling pressure persists.
Resistance: Immediate resistance is at $1.7000, $2.000, A break above $1.70 would signal a strong bullish reversal.
Psychological Levels: $2.00 is a critical psychological barrier, with $2.98 (all-time high from February 2025) as a long-term target.
Chart for your reference
Doge is set for a Rally 1. Current Price and Market Context
Recent Price Levels: As of May 11, 2025, DOGE trades at ~$0.24, with a market cap of ~$30.51B.
I believe the bottom is set, and a rally is imminent.
Chart for reference.

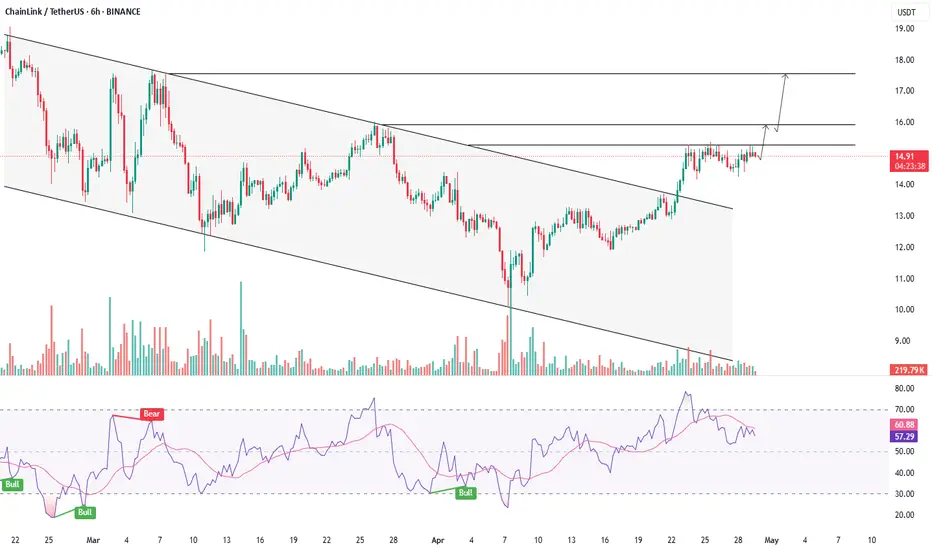
LINKUSDT - CONSOLIDATING NOW, BREAKOUT AHEAD?Symbol - LINKUSDT
CMP - 14.90
LINKUSDT has entered a consolidation phase following its breakout from a downward price channel. This development signals a positive outlook, as it suggests that buyers are accumulating momentum in anticipation of a potential breakout above key resistance levels.
The market has transitioned from a downward price channel to a consolidation phase, with key price levels ranging from 15.27 to 14.40, Bitcoin is exhibiting positive momentum, which, in turn, is supportive of altcoins. Should Bitcoin continue its upward trajectory, particularly after surpassing the 95K threshold, it is likely that the ongoing altcoin season will persist. A breakthrough in LINKUSDT’s resistance level at 15.27 could catalyze further upward movement.
Resistance Levels: 15.27, 15.94
Support Levels: 14.40, 14.26
At present, the performance of altcoins remains largely influenced by Bitcoin, which is benefitting from positive macroeconomic data in both the United States and the global economy. However, for specifically LINKUSDT, attention remains focused on its consolidation phase. If the resistance level at 15.27 is not breached on the first attempt, it is possible that a subsequent retest will yield a successful breakout. Prior to this, the price may test the consolidation support, potentially resulting in a false breakdown, which could create an imbalance favoring buyers. This imbalance, if it materializes, would enhance the likelihood of continued growth and a subsequent resistance breakout, contingent on the persistence of the broader bullish trend.
Bitcoin - Elliot Waves - Minor Counts (Last leg up)Here are the counts of the 5th of 5th that's going on. 108-110 should be max it goes.
Target after this is 60k.

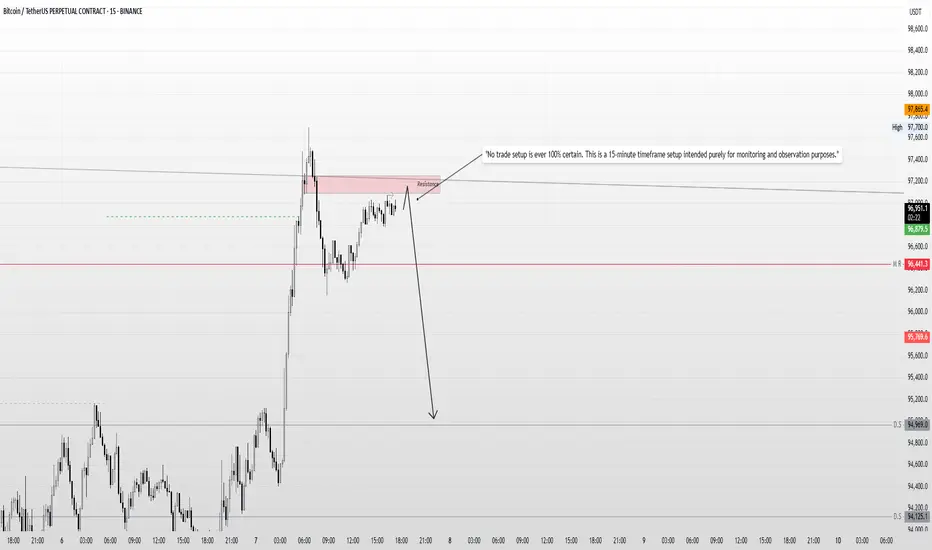
Bitcoin Intraday Bias – Liquidity Sweep & Rejection Setup"Intraday Setup: I anticipate that during the New York open, the market may sweep the liquidity around 97078, reject from the resistance zone, and potentially move lower."
"No trade setup is ever 100% certain. This is a 15-minute timeframe setup intended purely for monitoring and observation purposes."
Disclaimer: This is not financial advice. The analysis shared is for educational and informational purposes only. Please conduct your own research and consult with a licensed financial advisor before making any trading decisions. Trading involves significant risk and may not be suitable for all investors.
BITCOIN ON THE MOVE - BULLS IN CHARGE OR A TRAP AHEAD?Symbol - BTCUSD
CMP - 96000
BTCUSD has reached a new local high of 97900. The overall market structure remains constructive. However, its sustainability continues to be influenced by macroeconomic fundamentals and the performance of the S&P 500 index.
Recent gains have been supported by improvements in the US tariff landscape and the ongoing stabilization of US-China relations. Bitcoin's rally was further reinforced by the concurrent rise in the SPX 500, with which it maintains a relatively strong correlation. During the second half of this week, BTCUSD broke out of a two week consolidation phase, surpassing the resistance level at 95500 and establishing a new local high. A corrective movement is now developing within the confines of the existing upward channel.
The 95000 level represents a key liquidity and risk zone. If bullish momentum sustains above this threshold during a potential retest, the upward trend is likely to persist in the short to medium term. Conversely, a decisive break below 95000 may lead to a deeper decline toward the 92000–88000 range.
Resistance levels: 97425, 99475
Support levels: 95500, 92000
Market attention is focused on the 95500 support level, beneath which a significant liquidity pool has accumulated. Continued growth may result from a retest-induced rebound or a market imbalance favoring buyers. However, caution is warranted as upcoming economic data releases may significantly influence price action.
Important note: A return to the sell zone below 95000–95500, accompanied by an inability to sustain upward momentum, could lead to a broader correction and potential liquidation events.

VIRTUALUSDT SHOWDOWN - SUPPORT TESTED, BREAKDOWN AHEAD?Symbol - VIRTUALUSDT
CMP - 1.6620
VIRTUALUSDT is currently consolidating within the context of a broader uptrend, forming a defined trading range. However, emerging technical signals within this range suggest the potential for a trend reversal and subsequent decline.
Bitcoin, meanwhile, appears to be entering a corrective phase following its recent rally. This development is generally unfavorable for altcoins, which often struggle to gain momentum in the absence of strength from Bitcoin. VIRTUAL is exhibiting signs of consolidation, yet there is mounting pressure within the current structure, as evidenced by the clustering of resistance levels across the range. A key risk factor is the potential breakdown of market structure through a downward exit from the ascending channel, marked by a breach of trendline support.
A renewed test of the key support level at 1.5810 could serve as a catalyst for a breakdown, potentially leading to a sharper decline. Below this threshold, there is a relatively unimpeded path toward the next significant target around 1.1780
Key Resistance Levels: 1.7200, 1.8290
Key Support Levels: 1.5810, 1.4160, 1.1780
Market participants should closely monitor the current trading range between 1.5810 and 1.8290, Persistent pressure on the support level at 1.5810, particularly in the context of a broken uptrend, constitutes a bearish signal. A decisive breach and subsequent consolidation below this level may prompt liquidation events, accelerating a move toward the fair value gap (FVG) or liquidity zone near 1.1780

Management and Psychology Trading psychology is the emotional component of an investor's decision-making process, which may help explain why some decisions appear more rational than others. Trading psychology is characterized primarily by the influence of both greed and fear. Greed drives decisions that might be too risky.

Swing TradingSwing trading is a trading technique that traders use to buy and sell stocks when indicators point to an upward (positive) or downward (negative) trend in the future, which can range from overnight to a few weeks.

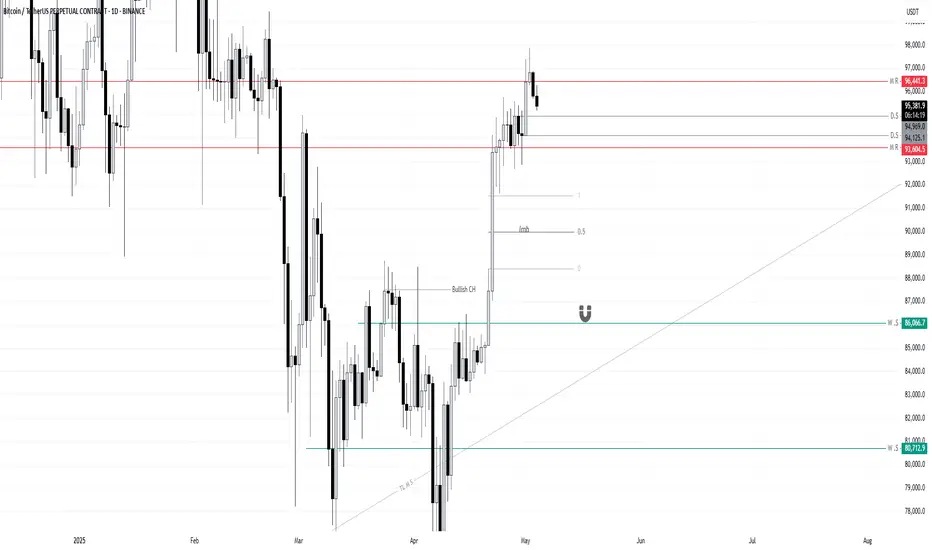
Bitcoin OutLook for Next Week BTCUSDT.pMarket Outlook (BTC/USD):
I’m currently observing the ₹94,125 level on the daily timeframe. A daily candle close below this level would significantly increase the probability of Bitcoin retracing toward the imbalance zone around ₹90,000.
However, there is a key demand zone near ₹86,000, which could act as a strong support and potentially push the market back upward. This area will be crucial in determining whether the bearish momentum continues or a reversal is triggered.
Let’s see how the market reacts around the ₹94,125 level. I’ll post the next update after Monday’s daily candle closes.
Thank you for your continued support — it's truly appreciated.