ETH 1H Outlook: Key Support Retest With Potential Downside RiskKey observations:
1. Support Level Under Pressure
ETH is retesting this support multiple times.
The annotation suggests: “SUPPORT IF BREAKS THEN WE CAN SEE MORE DOWNWORD” — meaning a breakdown could trigger further selling.
2. Downside Targets
If the current support fails, the next liquidity zones highlighted are:
FVG (Fair Value Gap) around $2,950–$2,900
Extreme POI zone around $2,880–$2,850
Major support at $2,787 (marked as “next support”).
3. Upside Scenario
If support holds, ETH could bounce toward:
$3,078
$3,134
High resistance around $3,225
4. Market Structure
Several CHoCH and BOS labels indicate mixed structure, showing recent weakness but with potential for rebound if buyers defend support strongly.
Cryptomarket

long ETH now buys deep buy activatedim in buys for real account deep buys for good profits yes do it now

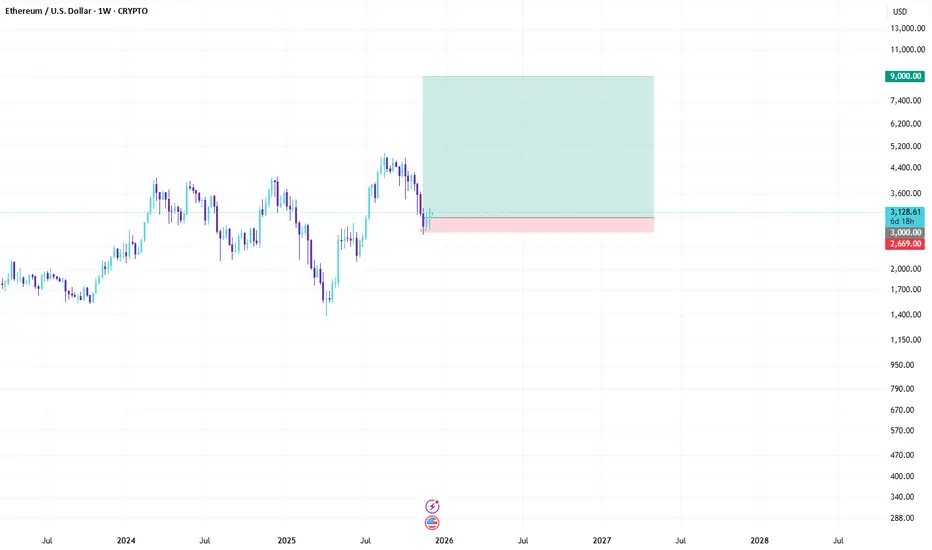
ETH Bullish Outlook: Tokenization Boom to $9K in 2026CRYPTO:ETHUSD
Asset: ETH/USD
Timeframe: Weekly
Hey traders! 🚀 Ethereum's dipping into December around $3,100 after some post-ATH consolidation, but the setup screams reversal. Fundstrat's Tom Lee is calling for a monster rally to $9,000 by 2026, fueled by tokenization exploding across finance. That's nearly 190% upside—ETH's about to steal the spotlight from BTC!
Key Analysis:
Macro Tailwinds: ETH's riding BTC's coattails but with extra juice from spot ETF inflows and real-world asset tokenization. As Wall Street piles in, expect ETH to decouple upward—watch for Nasdaq sync and weakening USD to amplify the move.
Technical Setup: Rock-solid support at $2,800, the recent higher low that's holding like a champ. Daily RSI oversold, bullish MACD crossover brewing, and on-chain metrics show whales accumulating. Smash $3,500 resistance, and we're blasting toward $4,500 next.
Risks: Near-term volatility if broader risk assets falter, but ETF demand and layer-2 scaling keep the floor intact for the long haul.
Trade Signal:
Entry: Long ETH/USD at $3,000 (confirmation above $2,800 support).
Target 1: $4,000 (short-term, ~30% gain).
Target 2: $9,000 (Tom Lee tokenization target by mid-2026).
Stop Loss: $2,700 (below key support to guard the downside).
Risk/Reward: 1:4+ on the primary target. Position size: 1-2% of portfolio.
Chart snapshot: Weekly candles forming a bullish pennant at $2,800, with Fibonacci retracement eyeing $9K extension. Overlay ETH ETF flows for that institutional vibe! (Pro tip: Compare with BTC dominance to spot ETH's breakout edge.)
Idea by Signal Squad
Published: December 8, 2025
What do you think, squad? ETH outpacing BTC in 2026, or more sideways grind? Drop your takes below—let's squad up! #ETH #CryptoSignals #SignalSquad
BTC Bullish Outlook: Riding the Wave to $170K in 2026CRYPTO:BTCUSD
Asset: BTC/USD
Timeframe: Weekly
Hey traders! 🚀 With Bitcoin kicking off December on a softer note around $85K, the market's digesting some Q4 turbulence, but we're eyeing a major reversal. Drawing from JPMorgan's fresh take, BTC could mirror gold's trajectory and surge to $170K within the next 6-12 months. That's an 84% upside from here—don't sleep on this!
Key Analysis:
Macro Tailwinds: BTC's negative correlation with the USD is flashing green as the dollar weakens. Pair that with its risk-on dance with stocks (watch Nasdaq for cues), and we're primed for a breakout.
Technical Setup: We've got support holding firm at the $80K psychological level—classic round-number magnet for BTC. RSI is oversold on the daily, MACD showing divergence, and options data screams "range-bound now, explosive later." Break above $90K, and it's game on toward the next roundie at $100K.
Risks: Short-term chop if stocks wobble further, but long-dated option builds suggest stability before the boom.
Trade Signal:
Entry: Long BTC/USD at $82,000 (confirmation above $80K support).
Target 1: $100,000 (short-term, ~20% gain).
Target 2: $170,000 (JPM moonshot by mid-2026).
Stop Loss: $75,000 (below key support to protect downside).
Risk/Reward: 1:3+ on the primary target. Position size: 1-2% of portfolio.
Chart snapshot: Imagine a weekly candlestick with a bullish engulfing at $80K, Fibonacci extensions pointing to $170K, and gold overlay for that JPM vibe. (Pro tip: Overlay GLD on your BTC chart for visual confirmation!)
Idea by Signal Squad
Published: December 8, 2025
What do you think, squad? Bullish breakout or more consolidation? Drop your thoughts below—let's discuss! #BTC #CryptoSignals #SignalSquad

Weekly Analysis BTC with Sell and Buy scenarios..Here is the weekly analysis of BTC including various topics of ICT, Price action etc.
Note – if you liked this analysis, please boost the idea so that other can also get benefit of it.
Also follow me for notification for incoming ideas.
Also Feel free to comment if you have any input to share.
Join me on live stream for real time update.
Disclaimer: This analysis is for educational purposes only and does not constitute investment advice. Please do your own research (DYOR) and check with your financial advisor before making any trading decisions.

BTCUSD — extending the declineThe most likely scenario I see is a move to the 70k area or slightly lower. From that level we can then look for the next move.

Major Cycle in Crypto Market (Attention Hedge Funds)Cycle-1: Bitcoin’s First Major Boom–Bust Structure (2013–2015)
(Screenshot-1 Breakdown)
Understanding Bitcoin’s historical behaviour is essential for forecasting macro-cycles in the crypto market. This post is the first of a 4-part series, where each screenshot highlights a repeating structural pattern in BTC’s long-term market psychology. After all four cycles are explained, I will present the combined Buy, Sell or Hold conclusion for long-term investors and institutional desks.
🟦 Cycle-1 Overview (April 2013 – January 2015)
In the first major structural cycle of Bitcoin, a very clear macro behaviour emerged — a pattern that continues to repeat across all future cycles.
🔵 Step 1 — ATH (A) Formed (April 2013)
Bitcoin printed a strong All-Time High (A) in April 2013, marking the top of its first major momentum wave.
🟢 Step 2 — Breakout Above ATH (A) → New ATH (B) (Nov 2013)
Once BTC broke above Point A, it entered an aggressive parabolic rally, setting a new ATH (B) in November 2013.
This breakout phase triggered:
FOMO-driven retail participation
Sharp acceleration in volatility
Rapid expansion in price multiples
🔴 Step 3 — Post-Breakout Collapse: -75% to -80% Drawdown
After forming ATH (B), Bitcoin failed to sustain the parabolic breakout.
A deep correction followed:
–75% to –80% decline
Capitulation phase
Panic selling and liquidity contraction
This phase marks the beginning of the macro mean-reversion cycle, a consistent signature in BTC’s long-term structure.
🟣 Step 4 — Price Returns to Previous ATH (A)
The most important element of Cycle-1:
After making a new ATH (B), Bitcoin retraced back to the previous ATH (A)
Time taken: 15–17 months
This behaviour is extremely rare in traditional markets but has repeated consistently in Bitcoin’s long-term structure.
📌 Why This Cycle Matters
Cycle-1 establishes the foundation for a powerful historical pattern:
BTC tends to fall back to its previous ATH after forming a new ATH.
This phenomenon repeats due to:
Leverage washouts
Liquidity resets
Miner capitulation
Long-term holder profit-taking
Macro monetary tightening phases
This is Cycle-1.
In the next screenshots, we will see how Cycle-2, Cycle-3, and Cycle-4 follow the same structural behaviour.
⏭️ Coming Next (Screenshot-2):
“Post-2017 Cycle — New ATH → 83% Crash → Return to Previous ATH.”
Cycle-2: 2017 Parabolic Expansion → 2018–2019 Reset (Screenshot-2 Breakdown)
This is the second chart in the ongoing 4-part series highlighting Bitcoin’s macro boom-and-bust rhythm—a structural pattern that repeats regardless of market participants, liquidity cycles, or macroeconomic conditions.
Cycle-2 again confirms that Bitcoin follows a highly predictable long-term retracement behaviour after every breakout to a new All-Time High.
🟦 Cycle-2 Overview (2017–2019)
This cycle mirrors the exact structure of Cycle-1:
Break previous ATH
Establish new ATH
Drop –75% to –80%
Return to previous cycle’s ATH
Time duration: 15–17 months
Let’s break down the chart step-by-step.
🔵 Step 1 — BTC Breaks Previous ATH on May–June 2017 (Point E)
In early 2017, Bitcoin broke the previous cycle’s ATH (from 2013–2014).
This breakout point is marked as:
Point E (May–June 2017)
Acts as the new cycle support
Represents the start of the parabolic expansion leg
This breakout confirms institutional liquidity entry and the beginning of a classic crypto macro-cycle.
🟢 Step 2 — Massive Rally to New ATH (Point F) — Dec 2017
After the breakout at E, Bitcoin entered its most aggressive historical rally:
BTC exploded into a full parabolic top
New ATH formed at Point F (Dec 2017)
Extreme retail inflow and speculative leverage
ICO mania peak
This is similar to the 2013 pattern—breakout → acceleration → parabolic top.
🔴 Step 3 — Reversal and Deep Crash: –75% to –82%
Post-ATH, Bitcoin collapsed sharply:
Total Drawdown: –75% to –82%
Duration: 455 days (≈15 months)
Angle of correction: Steep capitulation slope (as shown in your chart)
ICO bubble burst + liquidity draining
Dominance reset + long-term distribution
The depth and duration match Cycle-1 almost exactly.
🟣 Step 4 — Price Re-tests Previous ATH Zone (Point G — Mar 2019)
Just like Cycle-1, Bitcoin returned precisely to the previous breakout area:
Cycle Support (E) → Retest at G
Time Duration: ≈15–17 months
Price forms a demand zone around the previous ATH
Bottoming structure completes at G (March 2019)
This confirms again:
Bitcoin always re-tests its previous ATH after forming a new ATH — within a fixed time band of ~15–17 months.
Cycle-2 perfectly aligns with the behavioural signature of Cycle-1.
📌 Why Cycle-2 Matters to Institutions
This cycle reveals Bitcoin’s predictable macro liquidity reset pattern:
Break previous ATH → Excess speculation → Parabolic top
Systemic deleveraging → –80% correction
Return to previous cycle’s ATH support
Fresh long-term accumulation
This behaviour is structurally identical across multiple halving cycles.
Cycle-3: 2020 Breakout → 2021 Mania → 2022–2023 Reset (Screenshot-3 Analysis)
This third chart demonstrates the strongest confirmation of Bitcoin’s repeating macro-cycle structure.
Despite greater institutional involvement, derivatives expansion, and global liquidity changes, Bitcoin still respected the same 75–80% retracement and 15–17-month correction window.
Cycle-3 proves the pattern is structural, not accidental.
🟦 Cycle-3 Overview (2020–2023)
Like previous cycles:
BTC breaks previous ATH
Creates a new ATH
Drops –75% to –80%
Comes back to retest the previous ATH
Same time duration: ~15–17 months
Let’s decode the chart.
🔵 Step 1 — BTC Breaks Previous ATH in Nov–Dec 2020 (Point H)
Bitcoin broke the 2017 ATH during late 2020:
Breakout Point H (Nov 2020)
This previous ATH (Point F = Point H) becomes the new major cycle support zone
Triggered institutional FOMO: MicroStrategy, Tesla, hedge funds
This breakout ignited the strongest bull run in Bitcoin’s history.
🟢 Step 2 — Bitcoin Forms a New ATH in Nov 2021 (Point I)
Following the breakout at H:
BTC surged to a macro ATH at Point I (Nov 2021)
Fueled by:
Unlimited liquidity (pandemic QE)
Institutional buyers
ETF expectations
Retail mania & leverage
This top perfectly mirrors the parabolic peaks from 2013 and 2017.
🔴 Step 3 — Deep Macro Crash: –75% to –80%
After the November 2021 top:
BTC entered a systemic deleveraging phase
Complete 2022 crypto meltdown:
Luna collapse
Celsius, Voyager, BlockFi
FTX implosion
Price fell 77% from the ATH
Duration: 485 days (~16 months)
Exactly the same timing window as the previous two cycles.
🟣 Step 4 — Retest of Previous ATH Support (Point J — Mar 2023)
Just like Cycle-1 (2013 → 2015)
and Cycle-2 (2017 → 2019):
Bitcoin again returned exactly to its previous ATH zone:
Support Retest Point J (Mar 2023)
Perfect touch of the 2020 breakout zone
Massive demand entered the market
Cycle bottom completed right on schedule
This completes the third full repeat of BTC’s long-term structural cycle.
📌 Institutional Takeaway
Cycle-3 confirms:
Bitcoin’s macro behaviour is identical across 2013, 2017, and 2021 cycles — regardless of market maturity.
Every time Bitcoin breaks its previous ATH:
It creates a new parabolic peak
Then crashes 75–80%
Then returns to retest the previous ATH level
All within a consistent 15–17 month window
This makes Bitcoin the most predictable high-beta asset on the planet at a macro timescale.
Cycle-4: Oct-2024 Breakout → Oct-2025 ATH → Mar-2027 Retest of Legacy Support
After analyzing the previous three Bitcoin macro cycles (2013–2015, 2017–2019, 2021–2023), the new chart strongly suggests that Bitcoin is following the exact same structural behaviour for the 4th time.
This idea explains why BTC may enter a 15–17 month decline starting from the Oct-2025 macro top, and why the next major demand zone sits around 30,000 USD in Mar-2027.
🟥 1. Break of Previous ATH (I = K) — Oct 2024
Bitcoin broke above its previous ATH zone in Oct 2024, exactly like in all earlier cycles:
2013 ATH break → 2013 bull run
2017 ATH break → 2020–2021 bull run
2021 ATH break → 2024 surge
2024 ATH break → current cycle
This breakout (I = K level) becomes the new structural support for the cycle bottom later.
🟩 2. BTC Forms New Macro ATH (Point L) — Oct 2025
One year later, Bitcoin printed a new ATH around Oct 2025, marking the peak of Cycle-4.
Previous cycles also peaked approx. 11–14 months after breaking the last ATH, which strengthens this model.
🔻 3. Post-ATH Crash Begins — Same Pattern, Same Angle, Same Duration
All 3 previous cycles share:
• 75%–80% decline
• Duration: 15–17 months
• Final target: previous ATH or the ATH-1 level
Your chart highlights the same decline angle and same time window (Oct-2025 → Mar-2027).
This is exactly what Bitcoin has done before:
Cycle ATH → Bottom Duration Drop Retest Level
2013 → 2015 15 months –86% Previous ATH
2017 → 2019 17 months –84% Previous ATH
2021 → 2023 16 months –77% Previous ATH
2025 → 2027 (Prediction) 15–17 months –75% to –80% Previous ATH
Nothing in the 2024–2025 structure breaks this long-term behaviour.
🟦 4. Current Price Near “N” = Retesting Breakout Support
BTC is currently trading back near the Oct-2024 breakout level, marked as:
N = Previous ATH Support Zone
Historically, this level is not the final bottom.
It is only the first macro support touch before the full 75–80% correction completes.
Because the full 15–17 month window has not yet played out, a deeper decline remains statistically likely.
🟡 5. Final Prediction — BTC Bottom Around 30,000 USD (Mar-2027)
Following cycle symmetry:
Top: Oct-2025
Drop duration: 15–17 months
Bottom: Mar-2027 (same month as previous major bottom in Mar-2023)
Target zone: $30,000 ≈ last-to-last ATH (2020 level)
This fits perfectly with all 4 historical cycles.
This means BTC may revisit the deep demand zone before the next major bull cycle begins.
📌 Final Outlook (Important for Long-Term Investors)
If Bitcoin truly repeats its macro cycle:
The best long-term buying opportunity would occur in Mar 2027
Price reading: $28K–$32K
After that, BTC begins Cycle-5 (likely targeting $180K–$250K)
This idea is not short-term trading advice; it is a macro-cycle pattern that has consistently repeated for 12+ years.
🟡 BUY / SELL / HOLD — Clear Conclusion
SELL / REDUCE RISK
If you are a trader or short-term investor, Bitcoin is in the post-ATH declining phase, which historically produces 15–17 months of lower prices.
HOLD (Long-Term Only)
Long-term holders can remain calm but should expect deep volatility, not straight-up movement.
BUY (Smart Accumulation Window)
The next high-conviction buying zone will be:
🔥 $28K–$32K
🔥 Timeline: Mar 2027
That will be the start of the next Bitcoin mega cycle (Cycle-5).
📢 Final Message
This research is not about fear or hype—it is about Bitcoin’s consistent repeating macro behaviour.
Every single major crash and rally of the last decade followed the same timing, structure, and depth.
Bitcoin is not random.
Bitcoin is cyclical.
And the cycle says:
**The real bottom is not here yet.
The real opportunity comes in 2027.**

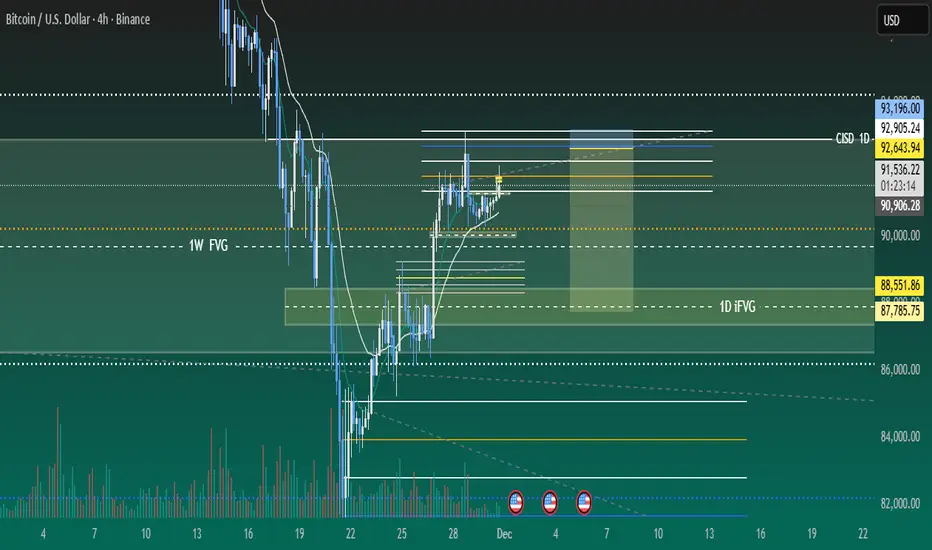
Weekly analysis BTC with high RnR scenariosBTC is now in consolidation zone and may spend some more days. It may also develop ABC pattern or reversal at daily level, if price has to change its delivery and take turn from here. This zone is kind of make or break. If price is not able to sustain and breakdown, then it may witness ~65-70K levels as well.
We hope for reversal from this level as price is developing the pattern at higher time frame.
1. Price has taken liquidity or 82K and almost touched 80K.
2. It has inversed 1Day FVG and now price is consolidating in the range between EMAs.
3. We may expect price retracement till 1D iFVG and then reversal.
4. Before to that we may see sweep of 92900 (1D CISD) level and then a retracement short trade till 1D FVG
5. Most probably price will take liquidity of FVG/RDRB level and create MSS/CISD/TS/iFVG in LTF.
6. Price should show rejection/reversal in respective LTF (5m/15m) at FVG zone.
7. Take the trade only once clear entry model i.e. turtle soup. iFVG break, CDS or MSS happens on LTF
All these combinations are signalling a high probability and high RnR trade scenario.
Note – if you liked this analysis, please boost the idea so that other can also get benefit of it.
Also follow me for notification for incoming ideas.
Also Feel free to comment if you have any input to share.
Join me on live stream for real time update.
Disclaimer: This analysis is for educational purposes only and does not constitute investment advice. Please do your own research (DYOR) and check with your financial advisor before making any trading decisions.
Weekly Gold analysis & 8R scenarioLast week gold closed positively with a strong candle showing positivity and approaching to a strong 4H FVG nested inside weekly quadrant level and making cluster. We may see both buying and selling scenarios.
Gold has also broken 4H trend line and retested it. So we can see a possible move till FVG.
We may also witness a breakout if price violates FVG and breaks all time high with strong volume support.
1. Price is creating higher highs in micro structure level and approaching towards 4hours FVG after breaking and retesting trend line at 4 Hours.
2. Trend line breakout is supported by strong volume.
3. Price is continuously running above EMAs confirming up move for now.
4. We may see a reversal scenario at 4 hour FVG level.
5. Most probably price will take liquidity of FVG/RDRB level and create MSS/CISD/TS/iFVG in LTF.
6. Price should show rejection/reversal in respective LTF (1h/15m) at FVG zone.
7. Take the trade only once clear entry model i.e. turtle soup. iFVG break, CDS or MSS happens on LTF
All these combinations are signalling a high probability and ~8R trade scenario.
Note – if you liked this analysis, please boost the idea so that other can also get benefit of it.
Also follow me for notification for incoming ideas.
Also Feel free to comment if you have any input to share.
Join me on live stream for real time update.
Disclaimer: This analysis is for educational purposes only and does not constitute investment advice. Please do your own research (DYOR) and check with your financial advisor before making any trading decisions.

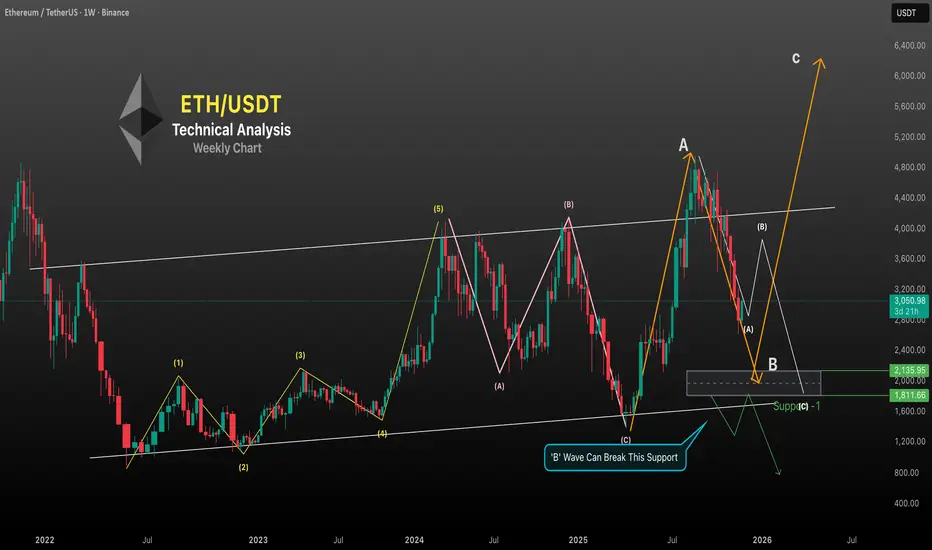
Ethereum – Elliott Wave Analysis (Weekly Chart)
#Phase 1:
Impulse Wave (1–5) Completed
ETH completed a 5-wave impulsive structure from the 2022 lows to the 2024 top:
Wave (1) – Initial reversal from the bear market bottom
Wave (2) – Deep corrective pullback
Wave (3) – Strong expansion wave (typically the largest, as shown here)
Wave (4) – Sideways consolidation within the channel
Wave (5) – Final push into the upper resistance of the long-term channel
This 5-wave structure completed near the $4,093 region.
#Phase 2:
ABC Corrective Pattern Playing Out
After the 5-wave completion, ETH entered a large ABC correction:
(A) Wave
A sharp drop from the top, marking the start of correction.
(B) Wave
A lower-high retracement that couldn’t break above the multi-year channel resistance — classic sign of a corrective rally.
(C) Wave
This wave completed near the lower boundary of the long-term channel (shown on your chart), fulfilling the ABC structure.
#Phase 3:
New Cycle – Larger ABC Structure Forming
After completing the previous ABC cycle, ETH started a new higher-degree correction:
Wave A (up)
A strong rally to ~4,956 created the larger-degree Wave A.
Wave B (current)
Price is now declining in a steep Wave B structure.
Your highlighted grey demand zone ($1,800–$2,200) is the most likely B-wave target.
Notes Must Read
B-waves often break support briefly, creating a sentiment trap
#Phase 4:
Wave C – The Big Expansion (2026?)
After Wave B finishes inside $1,800–$2,200, ETH is likely to start a massive Wave C.
Wave C is typically:
Impulsive
Equal to Wave A or 1.618× Wave A
Target 🎯 $6,000 – $6,400 region
This matches the Elliott Wave rule where Wave C often extends strongly after a deep B-wave.
~Disclaimer~
High Risk Investment
Trading or investing in assets like crypto, equity, or commodities carries high risk and may not suit all investors.
Analysis on this channel uses recent technical data and market sentiment from web sources for informational and educational purposes only, not financial advice. Trading involves high risks, and past performance does not guarantee future results. Always conduct your own research or consult a SEBI-registered advisor before investing or trading.
This channel, Render With Me, is not responsible for any financial loss arising directly or indirectly from using or relying on this information.
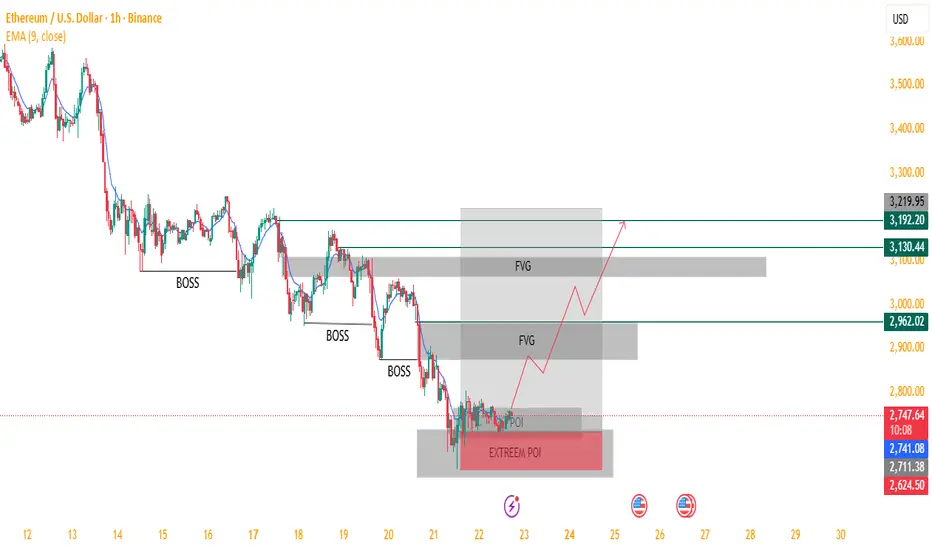
ETH/USD – Potential Bullish Reversal from Extreme POI !Analysis:
The chart suggests Ethereum is currently trading inside a strong Extreme Point of Interest (POI) after a series of Breaks of Structure (BOSS) to the downside. Price has entered a demand zone that may trigger a bullish reversal.
Key observations:
Downtrend Structure: Multiple BOSS confirmations show sustained bearish momentum leading into the Extreme POI.
Extreme POI (Demand Zone): Price is consolidating inside a deep demand area marked in red, indicating potential accumulation by buyers.
POI Reaction Expected: If price maintains support here, a bullish reversal is likely.
Fair Value Gaps (FVG):
Two major FVGs above act as logical bullish targets for price inefficiency fill.
Projected Price Path:
The drawn projection suggests:
Short-term bounce from POI
Breakout structure upward
Continuation toward higher FVG fills around $2,962, $3,130, and possibly $3,192 – $3,220.
Bias:
▶ Bullish, as long as price remains above the Extreme POI.
A breakdown below would invalidate the setup and continue the downtrend.
This is a strong smart-money style setup with a clean narrative:
Demand → Break of structure → FVG fill → Higher targets.
Crypto Trading Guide1. Understanding Crypto Trading
Crypto trading involves buying and selling digital assets such as Bitcoin (BTC), Ethereum (ETH), and thousands of altcoins with the goal of earning profits. Traders analyze price movements, market sentiment, liquidity, and technical indicators to make buy or sell decisions.
Unlike stock markets, crypto exchanges are decentralized and global. This means prices can fluctuate rapidly based on fundamentals, macroeconomic factors, regulatory developments, or even social media trends. Knowing how these factors affect token value is the first step toward successful trading.
2. Types of Crypto Trading
There are several popular trading styles, each suited for different personality types and risk appetites.
a) Day Trading
Day traders enter and exit positions within a single day. They rely on short-term price movements, chart patterns, and volume spikes. This style requires high attention, quick decision-making, and consistent strategy execution.
b) Swing Trading
Swing traders hold assets for days or weeks. They aim to capture price “swings” driven by broader trends. This style offers a balance—less stress than day trading yet more opportunities than long-term investing.
c) Scalping
Scalpers make numerous small trades throughout the day, profiting from minor price differences. It demands precision, discipline, and fast execution.
d) Position Trading
Position traders take long-term positions based on macro trends, technological developments, or fundamental analysis. They are less affected by short-term volatility.
e) Automated or Algorithmic Trading
Bots execute trades automatically based on predefined rules. This reduces emotional bias and allows 24/7 trading. However, setup and strategy optimization require knowledge and testing.
3. Choosing the Right Crypto Exchange
Selecting a reliable exchange is vital for safety and smooth trading. Compare platforms based on:
Security features (2FA, cold storage, proof of reserves)
Trading fees (maker/taker charges)
Liquidity (higher liquidity ensures smoother trades)
Supported crypto pairs (BTC/USDT, ETH/USDT, etc.)
User interface and tools
Customer support quality
Global exchanges include Binance, Kraken, and Coinbase, while several regional exchanges also offer local currency support.
4. Building a Trading Plan
A trading plan acts as your roadmap. It should answer:
Which coins will you trade?
What is your entry strategy?
What is your exit strategy?
How much capital will you risk per trade?
What indicators will you use?
How will you control emotions?
A strong trading plan prevents impulsive decisions and keeps you aligned with your long-term goals.
5. Fundamental Analysis (FA)
Fundamental analysis evaluates a crypto asset’s underlying value. Unlike stocks, cryptocurrencies don't have earnings or balance sheets. Instead, traders rely on:
Project whitepaper
Technology and blockchain model
Token utility and real use cases
Team and advisors
Partnerships and community size
Supply metrics (circulating and max supply)
Roadmap progress
Market sentiment (news, social media trends)
Strong fundamentals help identify long-term winners.
6. Technical Analysis (TA)
Technical analysis uses chart data to predict price movements. Common tools include:
a) Candlestick Patterns
Doji, engulfing, hammer, shooting star—these show buying or selling strength.
b) Support and Resistance
Support acts as a floor for prices; resistance acts as a ceiling.
c) Moving Averages (MA)
Popular trends include:
50-day MA
100-day MA
200-day MA
Bullish when price stays above key MAs.
d) RSI (Relative Strength Index)
Indicates overbought (70+) or oversold (30-) conditions.
e) MACD (Moving Average Convergence Divergence)
Shows momentum and potential trend reversals.
f) Volume Analysis
A price move with strong volume is more reliable than one with low volume.
A combination of these indicators gives clearer trading signals.
7. Risk Management
Crypto’s volatility can wipe out profits quickly if risk is not controlled. Effective risk management includes:
a) Position Sizing
Never allocate your entire portfolio to one coin. Use fractional position sizes (1–5% per trade).
b) Stop-Loss Orders
Automatically exit losing trades before losses escalate.
c) Take-Profit Levels
Lock in profits instead of waiting for unsustainable peaks.
d) Avoid Over-Leveraging
Futures trading may amplify gains, but also magnifies losses. Beginners should avoid high leverage.
e) Diversification
Hold a mix of large caps (BTC, ETH), mid-caps, and small caps to balance risk.
f) Keep Emotions in Check
Fear and greed are the biggest threats. A calm, rule-based approach wins long term.
8. Psychology of Crypto Trading
Market psychology plays a major role in crypto. Traders should understand:
Fear of Missing Out (FOMO)
Chasing pumps leads to buying at peaks.
Fear, Uncertainty, and Doubt (FUD)
Negative news often triggers panic selling—even when fundamentals remain strong.
Overconfidence
Winning streaks can cause reckless decisions. Stick to your plan.
Patience and Discipline
Waiting for perfect setups is key. Avoid forcing trades.
A successful trader masters both the charts and their mindset.
9. Common Crypto Trading Mistakes
Avoid the pitfalls that trap many beginners:
Trading without a plan
Using high leverage early
Investing money you cannot afford to lose
Blindly following social media influencers
Ignoring security practices
Overtrading
Not keeping trading journals
Holding losing positions out of hope
Learn from mistakes and review trades regularly.
10. Securing Your Crypto
Security should always be a top priority. Follow best practices:
Use hardware wallets for long-term storage
Enable 2FA authentication
Keep strong, unique passwords
Avoid trading on public Wi-Fi
Beware of phishing and fake websites
Backup seed phrases offline
A secure setup ensures your profits remain yours.
Conclusion
Crypto trading offers enormous potential, but success depends on knowledge, discipline, and strategic execution. By understanding trading styles, applying both fundamental and technical analysis, managing risk effectively, and controlling emotions, you can navigate the volatility of crypto markets with confidence. The key is to start slow, stay consistent, and treat trading as a long-term skill-building journey. With the right approach, crypto trading becomes not just profitable but also an enriching experience in the rapidly evolving world of digital finance.

Bat is real bat hahahaBINANCE:BATUSD
whale want to draw real bat picture 😅
all information in chart image.
please do your own research before taking any trade.
i am not financial advisor
risk is real stay practical
please feel free to ask any questions

Bitcoin Monthly Support Test — Next Target $58,419 ?Key support sits at $81,933. A clean break and close below this zone could expose Bitcoin to a deeper retracement toward the next major support around $58,419.
However, $81,933 is also a strong monthly support level, so the market’s reaction here is critical.
Keep an eye on whether this level holds or fails — it will likely dictate the next major move.
Share your view in the comments: Do you think BTC will defend this monthly support, or are we heading lower?

Bitcoin's Death Cross is Here: A crash with a message to all!BITSTAMP:BTCUSD has just delivered one of its most significant reality ✔ checks of the year — the recent crash wasn’t simply a dip; it was a multi-layered market unwind that exposes the current fragility of the crypto ecosystem.
📉 Current Bitcoin Situation: “From Euphoria to Uncertainty”
Bitcoin’s trend shifted rapidly over the past few weeks.
Spot ETFs that once fueled relentless upside have significantly slowed inflows, with some days printing net outflows as retail enthusiasm cooled and institutions trimmed exposure.
Meanwhile:
Over billions in long liquidations hit in some days.
Funding flipped aggressively negative
Sentiment turned from greed → hesitation
High beta alts saw steeper collapses, showing risk-off behavior
This wasn’t random volatility — it was a controlled flush triggered by structural weakness.
🔥 Why Bitcoin Crashed: The Real Story
🔹 Technical Factors
BTC lost a major support cluster after multiple failed attempts to hold the mid-range.
Open interest was overheated, creating the perfect setup for a liquidation cascade.
Price rejected sharply from a supply zone that aligns with the weekly imbalance.
☠️ Death Cross on Daily Time Frame: Now Confirmed
The 50 SMA crossing below the 200 SMA is not a “doom event” by itself…
But historically, Bitcoin rarely ignores this signal, especially when paired with weakening momentum and fading liquidity.
⚠ The last major Death Cross?
2022’s brutal bear continuation, which led to several months of grinding downside before any meaningful reversal.
The current structure looks uncomfortably similar:
Lower highs printing consistently
Loss of trend strength
Distribution patterns on higher time frames
Declining demand from smart money inflows
This isn’t fearmongering — it’s observation.
🔹 Fundamental + Macro Factors
ETF inflow cooldown = reduced demand pressure
Miners started selling into strength to stabilize income post-difficulty adjustment
Global markets leaned risk-off due to macro tightening
Whales began distributing quietly (confirmed by on-chain inflow spikes into exchanges)
When technical fragility meets fundamental slowdown, crashes are not accidents — they’re consequences.
🐋 Whales Are Selling: “When the quiet money moves, the market reacts loud.”
On-chain data over the last week showed:
Increase in exchange inflows from large wallets
Spot distribution from old long-term holders
ETF issuers are reducing inventory during downswings
This behavior is classic:
Whales distribute during periods of retail excitement…
Retail panics during whale exits…
And the crash becomes a self-fulfilling cycle.
📅 4–6 Week Forecast: “Chop, Pain & Opportunity”
Over the next month or so, the market will likely experience:
Sideways-to-down structure
Failed rally attempts near the 50 SMA
Whip-saw price action due to low conviction
Accumulation pockets are forming quietly
BITSTAMP:BTCUSD needs to reclaim the 50 SMA with strength before a clean trend resumes.
Until then, volatility ≠ strength.
🎯 Conclusion: Re-Investment Zones & Smart Accumulation
Crashes are emotional for most, but strategic for the prepared.
This is not a call to rush.
It’s a reminder:
Smart money enters when sentiment collapses.
Dumb money enters when sentiment peaks.
Analyze. Prepare. Don’t chase.
🧩 Comment down below 👇 and let’s talk about how to overcome it — build awareness together as traders, not competitors.
If this Idea gave you valuable information, then please boost it, and follow for more practical trading!
Happy Trading & Investing!
Team @TradeWithKeshhav ⚡

BTC strong down trend and high RnR sell scenario..BTC is in strong down trend and broke ~ 90K level and targeting further downside levels of 82K and 75K. Price is continuously forming lower highs and BoS. Price has formed a BOS on hourly chart and approaching 1h FVG. We may expect a rejection pattern in LTF inside FVG and further downfall.
1. Price is in strong down trend and formed 1H FVG after creating BOS.
2. FVG is formed on weekly quadrant level, making it more significant,
3. Price is now approaching FVG
4. Most probably price will take liquidity of FVG/RDRB level and create MSS/CISD/TS/iFVG in LTF.
5. Price should show rejection/reversal in respective LTF (5m/15m) at FVG zone.
6. Take the trade only once clear entry model i.e. turtle soup. iFVG break, CDS or MSS happens on LTF
All these combinations are signalling a high probability and ~8R trade scenario.
Note – if you liked this analysis, please boost the idea so that other can also get benefit of it.
Also follow me for notification for incoming ideas.
Also Feel free to comment if you have any input to share.
Join me on live stream for real time update.
Disclaimer: This analysis is for educational purposes only and does not constitute investment advice. Please do your own research (DYOR) and check with your financial advisor before making any trading decisions.

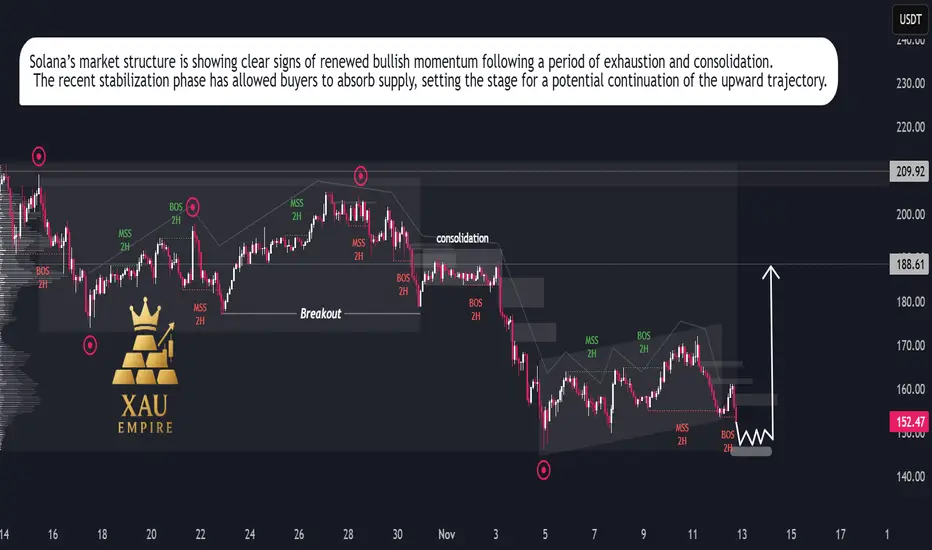
SOL/USDT – Bullish Momentum Rising, Rally Setup in ProgressSolana is showing renewed strength after an extended corrective phase, suggesting that the recent slowdown was a temporary reaccumulation rather than the start of a new downtrend. Price action has begun to stabilize, reflecting growing investor confidence and increasing participation from buyers at discounted levels.
Market flow indicates that selling pressure is fading, while buying volume has started to build up gradually. The recent structure reflects a healthy market rotation, where weaker hands are being replaced by strategic buyers positioning for the next expansion phase.
Momentum appears to be shifting in favor of the bulls, supported by consistent higher reactions after each dip and a clear compression pattern that often precedes strong directional movement. This behavior points toward a potential continuation of the broader uptrend, with expectations for renewed growth as market sentiment strengthens.
Overall, Solana’s current price behavior suggests the market is preparing for another bullish leg. As volatility contracts, the probability of an impulsive upside expansion increases, signaling that the next significant move is likely to unfold in favor of buyers.
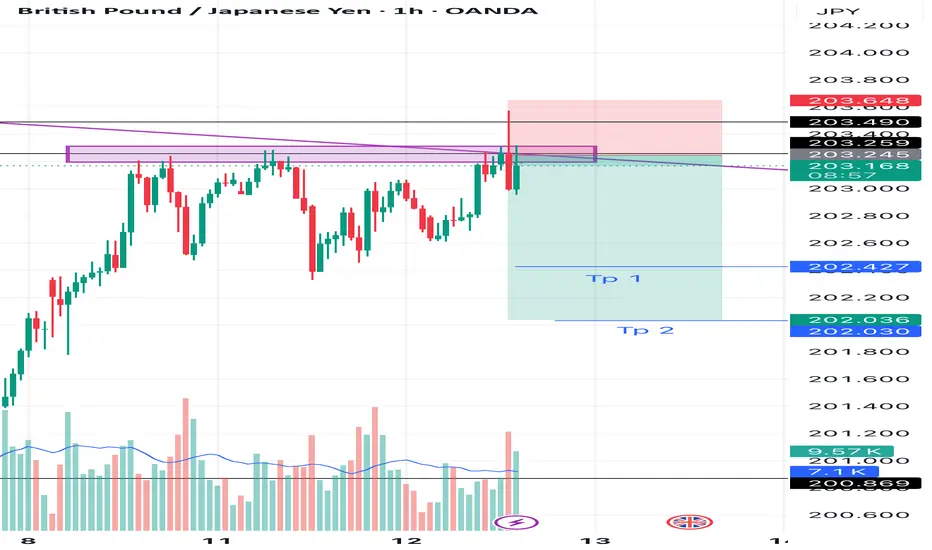
GBPJPY SHORT 1H TIME FRAME I am sitting in short of GBPJPY on 1H Time frame
Logic :- i can clearly see a good rejection with huge volumes from resistance and buyers are trapped, Sellers are gaining control so i am going for 1:2/3.
Let’s see one can take with proper SL gand targets given ✅
Trust the process 🚀, A lot more to come
Thank you guys, Like and comment for more uploads
BTCUSDT SHORT I was sitting in Short after a good bearish candle formed at resistance with very good volume, i just took 1:2 and i was out of the trade.
Logic :- Price was too stretched and bears were gaining control, bulls were trapped
But still the trend is bullish for me, lets see 🚀
Happy profits 🥂 enjoy guys, sorry i didn’t posted this trade earlier
LIKE AND FOLLOW FOR MORE TRADE IDEAS

As posted earlier 1:2 done As posted earlier i was sitting long in Btcusdt, 1:2 is done and i am out of the trade with 70% qunatity.
BINANCE:BTCUSDT
Like and follow for these types of trade ideas !!
And Join me with my journey so you can make yours 👍
Disclaimer: This is not financial advice. Please consult your financial advisor before making any investment decisions.

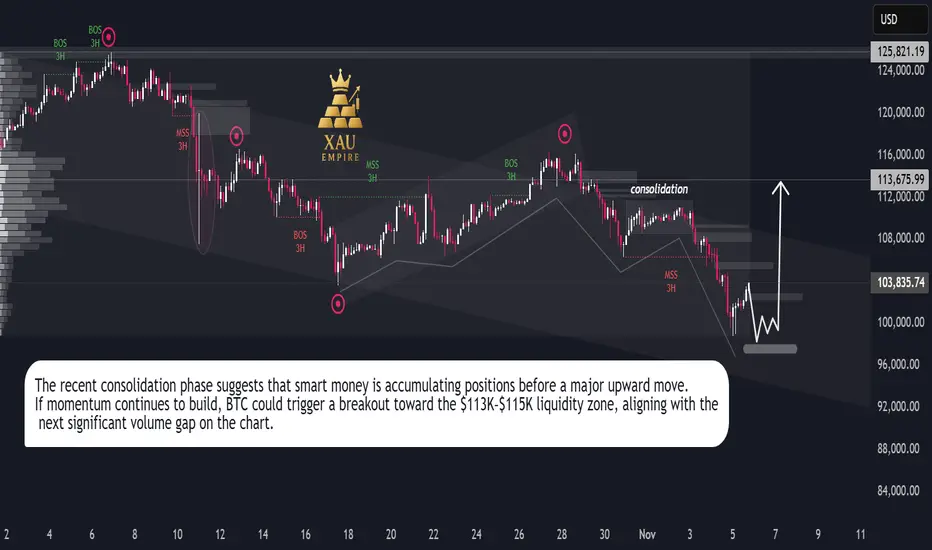
Bitcoin Bulls Target $113K**Bitcoin (BTC/USD) Analysis — November 2025**
Bitcoin has been moving within a controlled downtrend channel, facing continuous lower highs since late October. The market recently went through a **liquidity sweep**, followed by a minor **market structure shift (MSS)** on the 3-hour timeframe. This suggests exhaustion in the current bearish leg.
After a period of **sideways consolidation**, price is testing a strong accumulation zone near the **$100K–$97K** region. This zone aligns with prior demand and high-volume nodes, making it a potential base for a bullish reversal.
A clean rebound from this level could drive Bitcoin toward the **$113K–$115K** area, where the next liquidity cluster sits. If buyers regain momentum, this move could accelerate into a **V-shaped recovery**, confirming the start of a fresh mid-term bullish cycle.
Overall sentiment remains **bullish**, supported by renewed buyer activity and potential macro-driven inflows ahead. Traders should watch for volatility spikes as the market transitions from accumulation to breakout mode.
**Key Takeaway:**
BTC is stabilizing near key demand, eyeing a rebound toward $113K+. Momentum confirmation above the short-term consolidation zone could trigger a strong upward continuation.
**#Bitcoin #BTCUSD #CryptoAnalysis #BitcoinForecast #BTCPricePrediction #CryptoTrading #BullishReversal #CryptoMarket #TradingViewAnalysis**
Real Knowledge of MarketCore Foundational Knowledge
Derivatives Basics: Options are derivative contracts, meaning their value is derived from an underlying asset (stocks, indices, commodities, etc.).
Key Terminology: A trader must be fluent in terms like call options (right to buy), put options (right to sell), strike price, premium, expiration date, intrinsic value, and time value.
Rights vs. Obligations: Understanding that option buyers have the right, but not the obligation, to exercise, while option sellers (writers) have the obligation if exercised, is fundamental to risk assessment.
Leverage: Options offer significant leverage, meaning a small amount of capital can control a large position in the underlying asset, which amplifies both potential profits and losses.

Real value of Market # Entry #Exit #Trail # StoplossThe phrase "Market # Entry #Exit #Trail # Stoploss" refers to the core parameters of a structured trading plan. The "real value" does not imply a single numerical figure, but rather the monetary gain or loss realized from a trade based on how these elements are defined and executed, combined with the discipline to follow them consistently.
Market: The specific financial instrument or market being traded (e.g., a particular stock, currency pair, or commodity).
Entry: The predefined price level or condition at which a trader opens a position. A good entry can offer a favorable risk-to-reward ratio from the start.
Exit: The predefined strategy or points at which a trader closes a position, either to take a profit or to limit a loss. Exits are crucial as they determine the final profit or loss.
Trail: Refers to a trailing stop-loss order, a dynamic risk management tool that automatically adjusts the stop-loss level as the market price moves in the trader's favor. This locks in profits while allowing the trade to continue if the price keeps moving favorably.
Stoploss (SL): A pre-determined price level or percentage below (for a long position) or above (for a short position) the entry price where the position is automatically closed to prevent further losses if the market moves against the trader.
