BTCUSD - RESISTANCE RETEST IN PROGRESSSymbol - BTCUSD
Bitcoin continues to consolidate beneath the previously breached ascending trendline, with no distinct signs indicating the end of the corrective phase or the emergence of strong bullish momentum. A retest of the resistance zone is currently forming.
Bitcoin is trading within a defined range between 1,11,650 & 1,06,250 At present, there are no clear bullish reversal signals, and price action suggests a corrective move toward resistance before a potential decline into the liquidity pool near 1,06,250, shaped by prior consolidation and retesting activity.
Two critical resistance zones lie ahead — 1,11,650 and 1,13,600 Resistance at 1,11,650 has been validated. However, failure to sustain rejection here may lead to a test of the upper boundary. A false breakout in that area could trigger a subsequent pullback. Overall, the cryptocurrency market remains relatively subdued, reflecting ongoing uncertainty and caution surrounding broader macro and policy factors.
Resistance levels: 1,11,650 - 1,13,600
Support levels: 1,08,650 - 1,07,375 - 1,06,250
Current price action indicates a developing consolidation phase within a localized downtrend. A confirmed breakout above 1,13,000 and subsequent consolidation above 1,13,500 would strengthen the case for a potential trend reversal. Until such confirmation emerges, a pullback from resistance into the zone of interest remains the primary expectation.
Cryptomarket

XMR/USDT(Monero) - Reversal Breakout? | 150% Upside Potential🔍 LONG-TERM STRUCTURAL OVERVIEW
Multi-Year Journey:
XMRUSD completed a significant base-building phase between 2021-2025, establishing a broad consolidation range between $120-$270. Recent price action shows acceleration from this base with current test of major resistance confluence.
Current Position:
Price breaking above multi-year consolidation at $335, approaching critical resistance cluster at $422 (marked on your chart). This represents the 3rd major test of overhead supply zones after initial spike to $517 in early 2021.
📈 KEY STRUCTURAL ZONES FROM CHART
Major Resistance Clusters:
Immediate: $335-360 (current test zone, pink resistance box)
Critical: $422 (major horizontal resistance from 2021-2022)
Ultimate: $517.80 (prior swing high, strong supply area)
Support Foundation:
Immediate: $280-300 (recent breakout zone, now support)
Primary: $240-260 (consolidation ceiling turned floor)
Major: $120-140 (multi-year base, last defense)
⚡ TECHNICAL OBSERVATIONS (Weekly Timeframe)
Range Evolution:
2021 Peak: $517.80 high followed by 18-month decline
2022-2023: Extended consolidation $120-$200 (accumulation phase)
2024 Q1-Q3: Breakout attempt to $240 with rejection back to $120
2024 Q4-2025: V-shaped recovery with expansion to current $335
RSI Context (Weekly):
Current Reading: 59.96 (neutral-positive zone)
Key Observation: Above 50 centerline (momentum structure favoring buyers)
Historical Context: Prior peak at 80+ in 2021, current reading shows room for expansion
Not Extended: RSI sub-70 provides cushion before overbought territory
Pattern Recognition:
Chart structure resembles multi-year cup formation:
Cup Depth: $517 → $120 (75% correction)
Base Duration: 24+ months consolidation
Handle Phase: $240-$280 consolidation (completed)
Breakout: Current expansion from $240 base
🎯 WHAT'S HAPPENING NOW
Breakout Characteristics:
Clean break above $280 consolidation ceiling
Sustained acceptance in $300+ zone (4+ weeks)
Weekly candles showing consecutive higher lows: $240 → $280 → $300
Current candle: Large bullish body with minimal upper wick
Volume & Momentum:
Recent weekly candles showing expansion (visible on chart)
RSI climbing from 40s to current 59.96 = momentum building
Not yet parabolic - structured advance vs climactic spike
Time at Levels:
Significant time spent at $240-280 = re-accumulation zone
Quick move through $300-335 = light resistance
Now approaching $360-422 supply zone = critical test ahead
🧩 MARKET STRUCTURE CONTEXT
What Makes This Setup Notable:
1. Base Completion:
Multi-year consolidation (2022-2024) between $120-$270 established strong foundation. Extended time at these levels typically absorbs supply.
2. Resistance Zone Approach:
First meaningful test of $422 resistance since 2021-2022. Prior tests showed rejection wicks; current structure shows more sustained pressure.
3. RSI Position:
At 59.96, momentum is positive but not extended. Historical peak was 80+ (2021), suggesting room for expansion if resistance clears.
4. Weekly Candle Structure:
Recent candles showing consistent bullish closes with bodies dominating wicks = demand absorption vs rejection pattern.
📊 CRITICAL ZONES TO WATCH
Upward Resolution Path:
$360 Zone: Minor resistance from prior consolidation
$422 Level: Major multi-year resistance (BLACK LINE on chart)
$517.80 Area: Ultimate resistance, 2021 swing high
Support Defense Levels:
$300-320: Immediate support, recent breakout acceptance
$280 Zone: Breakout point, critical for structure maintenance
$240 Area: Re-accumulation base, major defense line
$120-140: Multi-year floor, final support
🔄 PATTERN PROGRESSION ANALYSIS
Historical Comparison:
Your chart shows projected path (RED LINE) suggesting:
Retest of $280-300 area (cup formation handle)
Consolidation near current levels
Expansion toward $440-520 zone
Potential extension to $650-760+ (blue projection boxes)
Current vs Projection:
✅ Completed base formation phase
✅ Broke above $280 consolidation
⏳ Now testing $335-360 resistance band
⏳ Awaiting $422 resolution
📈 TIMEFRAME SYNCHRONIZATION
Weekly Structure (Primary):
Trend: Upward from $120 base
Momentum: RSI 59.96 (positive, room to expand)
Pattern: Cup base breakout in progress
What Higher Timeframes Suggest:
Monthly chart (implied from weekly) would show:
Multi-year decline completion
Base formation confirmation
Early stage recovery structure
Critical Validation Needed:
Sustained weekly closes above $360
RSI maintaining above 55-60 range
No breakdown below $280 breakout zone
🎯 RESISTANCE BATTLE ZONES
Zone 1: $335-360 (Current Battle)
Prior consolidation ceiling
Multiple tests showing absorption
RSI circled area on chart (red circle) suggests prior resistance memory
Zone 2: $422 (Major Defense Line)
Horizontal resistance from 2021-2022 period
Multiple rejections in past
Clean level = strong institutional memory
Zone 3: $517.80 (Ultimate Test)
2021 swing high
Represents prior cycle peak
Clearing this opens path to blue box projections ($760+)
💡 STRUCTURAL ASSESSMENT
Formation Quality:
Base Duration: 24+ months = strong foundation
Depth: 75% correction from peak = significant reset
Consolidation: Tight range at $120-270 = supply absorption
Breakout: Clean move above $280 with acceptance
Momentum Characteristics:
Not Parabolic: Structured advance vs blow-off spike
RSI Healthy: 59.96 vs 2021 peak of 80+ = room exists
Weekly Pattern: Higher lows forming consistently
Candle Bodies: Dominating wicks = demand presence
Risk Factors:
Major Resistance: $422 zone represents significant overhead supply
Distance from Base: +180% from $120 low = extended from origin
Crypto Volatility: Broader market correlation risks
Prior Rejection: $517 level showed strong supply in past
🔔 KEY DECISION POINTS
For Upward Continuation:
Weekly close above $360 = clears immediate resistance
Sustained acceptance in $360-400 range
RSI maintaining above 55 with expansion toward 65-70
Volume expansion on resistance breaks
For Consolidation Phase:
Rejection at $422 zone (like 2021-2022)
Pullback to $280-320 support = handle formation
RSI cooling to 45-55 range = healthy reset
Time consolidation vs price consolidation
For Downside Risk:
Loss of $280 breakout zone
Weekly close below $240 re-accumulation base
RSI breakdown below 50 = momentum loss
Rejection with large upper wicks = supply returning
🧠 OBJECTIVE MARKET STATE
Current Phase: Multi-year base breakout testing first major resistance cluster
Structure: Weekly timeframe showing consistent higher lows from $120 base, currently at $335 (+180% from low)
Momentum: RSI 59.96 (positive zone, above 50 centerline, room before extended readings at 70+)
Critical Juncture: Approaching $360-422 resistance band that rejected price in 2021-2022 period. Current approach shows different character - sustained pressure vs quick rejection.
Weekly Candle Evidence: Recent closes showing demand absorption with bullish bodies dominating. This doesn't predict outcome but shows different structure than prior tests.
📊 WHAT'S DIFFERENT THIS TIME?
2021-2022 Resistance Tests:
Quick spikes with immediate rejection
Large upper wicks showing supply
RSI showing divergence at peaks
Limited base building time
Current 2025 Test:
Extended base formation (24+ months)
Gradual accumulation at higher levels
Sustained acceptance above breakout
RSI climbing steadily without extremes
This doesn't guarantee outcome but shows structural differences in how price approaches the zone.
🎯 OBSERVATION FRAMEWORK
Weekly Close Locations Matter:
Above $360: Confirms breakout extension
Between $320-360: Consolidation continuation
Below $300: Questions breakout validity
Below $280: Breaks structure
RSI Behavior to Monitor:
Staying 55-70: Healthy momentum expansion
Spiking above 75: Potential exhaustion warning
Falling below 50: Momentum shift neutralizing
Breaking below 45: Structure weakening
Volume/Candle Patterns:
Large bullish bodies: Demand absorption
Upper wicks increasing: Supply returning
Declining volume at highs: Momentum fading
Expansion on breakouts: Conviction building
Structural Evidence:
Weekly RSI: 59.96 (positive momentum, not extended)
Pattern: Cup base with handle breakout
Candles: Consecutive higher lows with bullish bodies
Time: Sustained acceptance above $280 breakout
Critical Test Ahead:
$422 horizontal resistance represents major supply zone. Prior tests showed quick rejection; current approach shows gradual accumulation behavior at higher levels after extended base formation.
Resolution Awaited:
Acceptance above $360-422 opens path toward $517 (prior high) and extension zones charted in blue boxes. Rejection maintains consolidation structure with support at $280-320.
🕓 Timeframe: 6 to 9 months
⚠️ Disclaimer: This analysis presents observable market structure without predictions or recommendations. Based on weekly timeframe patterns visible on chart. All observations require independent verification and risk assessment. DYOR!

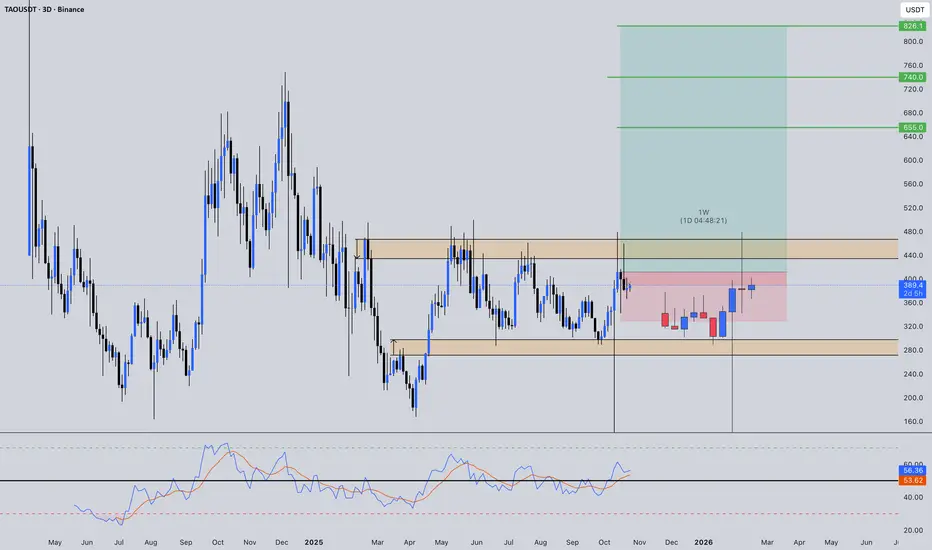
BITTENSOR (TAO) - AI Coin - Wyckoff Accumulation - 3D Analysis🔍 STRUCTURAL OVERVIEW
Long-Term Range Formation:
TAOUSDT has established a multi-month consolidation structure between $280-$440. Price action shows compression within this zone with multiple tests of both boundaries.
🕓 Holding Timeframe: 6 to 9 months
Current Position:
Price testing upper boundary of established range at $389-420 zone (pink resistance box on chart). This marks the 4th significant test of this level since early 2025.
📈 KEY ZONES FROM CHART
Resistance Clusters:
Immediate: $389-420 (current test zone)
Secondary: $440-460 (prior consolidation ceiling)
Extension Zones: $669 → $740 → $826 (marked green boxes - prior supply areas from 2024)
Support Foundation:
Primary: $280-310 (established accumulation pocket)
Intermediate: $320-340 (mid-range acceptance)
⚡ TECHNICAL OBSERVATIONS
Range Characteristics:
Price spending significant time between $320-$400 = acceptance zone building
Multiple swing failures at $420 level = persistent supply presence
Lower boundary at $280 defended on 4 separate tests = demand emerging
Momentum Context (RSI - 3D):
Currently: 58.62 (neutral zone)
Above 50 centerline = momentum structure favoring buyers in this timeframe
Not yet extended (sub-70) = room for continuation if resistance clears
Volume Pattern:
Recent consolidation showing declining volatility - typical compression behavior before range resolution.
🧩 WHAT'S HAPPENING NOW
Compression Phase:
Multi-month range compression with price gravitating toward upper boundary. The tightening range between $320-$420 suggests energy building for directional resolution.
Level Interaction:
Current candles testing $389-420 resistance zone with RSI showing neutral momentum. Unlike previous tests that showed rejection wicks, recent structure shows more sustained pressure at this level.
Time at Level:
Increasing time spent above $360 in recent periods indicates buyers absorbing supply at higher prices within the range.
🎯 CRITICAL OBSERVATION POINTS
For Upward Resolution:
Sustained acceptance above $420 on 3D close
RSI holding above 60 during any breakout attempt
Volume expansion accompanying the move
For Range Continuation:
Rejection from $389-420 zone (as seen 3 prior times)
Loss of $360 support = reversion to $320-340
RSI falling back below 50 = momentum neutralization
For Downside Risk:
Loss of $320 = range breakdown scenario
Target: Retest of $280 range low
📊 MARKET STRUCTURE SUMMARY
Pattern: Multi-month rectangular range consolidation
Current Phase: Testing upper boundary (4th approach)
Momentum: Neutral-positive (RSI 58, above centerline)
Key Decision Zone: $389-420 resistance cluster
What Makes This Test Different:
Unlike prior rejections showing long upper wicks, current structure shows more gradual accumulation behavior approaching the zone. This doesn't predict outcome but shows different character at this test.
🔔 ZONES TO WATCH
$420 Break = Critical for range resolution confirmation
$360 Hold = Maintaining higher structure within range
$320 Support = Range integrity defense line
Objective State: Price testing upper boundary of established consolidation range with neutral-positive momentum. Resolution awaited - acceptance above $420 or rejection maintains range structure.
This analysis presents current market structure without predictions or recommendations. All observations based on visible price action and technical positioning. Trade decisions require your own analysis and risk assessment.
LINK - To The Moon? | 3D Chart AnalysisLINK has pulled back into a strong demand zone between $15.4–$16, aligning perfectly with the ascending trendline support that has held since mid-2023.
The recent wick rejection shows early signs of demand returning — if price holds above this area, we could see a potential mid-term reversal forming.
⸻
📊 Technical Outlook:
• 🔹 Structure: Still maintaining a higher-low formation on 3D
• 🔹 Support Zone: $15.4–$16 — key area for continuation
• 🔹 Trendline Support: Multi-touch ascending trendline intact
• 🔹 RSI: Neutral, room for upside momentum
• 🎯 Targets:
• TP1 → $30
• TP2 → $50
• ❌ Invalidation: 3D close below $15.4
⸻
📈 Bias: Bullish reversal setup – accumulation zone holding strong
🕓 Timeframe: 6 to 9 months

Crypto Assets Secrets: The Hidden Dynamics of Digital WealthIntroduction
Over the past decade, crypto assets have transformed from a fringe experiment in digital money into a multitrillion-dollar financial ecosystem that challenges the traditional boundaries of economics, finance, and technology. Bitcoin’s mysterious emergence in 2009 under the pseudonym Satoshi Nakamoto sparked a global phenomenon, laying the foundation for an entirely new asset class known as crypto assets or digital assets. While the world has widely discussed cryptocurrencies like Bitcoin and Ethereum, the secrets behind crypto assets—how they derive value, operate, and influence financial systems—remain misunderstood by many.
This essay unveils the hidden dimensions of crypto assets, exploring their technological foundations, economic mechanisms, market dynamics, investment secrets, and the strategic shifts they are inducing in global finance.
1. Understanding Crypto Assets
A crypto asset is a digital representation of value that operates on blockchain technology and uses cryptography for security, verification, and transaction validation. Unlike fiat currencies, crypto assets are decentralized, meaning they are not issued or controlled by central banks or governments. They rely instead on distributed networks of computers (nodes) that collectively maintain the integrity of the ledger.
Crypto assets can be broadly divided into three main categories:
Cryptocurrencies – digital currencies used primarily as a medium of exchange (e.g., Bitcoin, Litecoin).
Utility tokens – tokens granting access to services within blockchain ecosystems (e.g., Ethereum’s ETH for gas fees).
Security and asset-backed tokens – representing ownership or rights to assets like equity, real estate, or commodities (e.g., tokenized stocks or gold).
Behind these classifications lies a deeper secret: the tokenization of value. Blockchain allows almost any form of asset—tangible or intangible—to be represented, traded, and fractionalized digitally, unlocking unprecedented liquidity and accessibility in global finance.
2. The Secret of Blockchain Technology
At the heart of every crypto asset lies blockchain technology, a decentralized digital ledger that records transactions in immutable “blocks.” The blockchain’s transparency, security, and decentralization are its core strengths.
The secret behind blockchain’s power is its consensus mechanism—the process by which distributed participants agree on the state of the ledger. Common mechanisms include:
Proof of Work (PoW) – miners solve complex mathematical puzzles to validate transactions (used by Bitcoin).
Proof of Stake (PoS) – validators lock up coins (“stake”) to earn the right to confirm transactions (used by Ethereum 2.0).
Delegated Proof of Stake (DPoS) and Proof of Authority (PoA) – more energy-efficient models emphasizing speed and scalability.
These consensus methods ensure that no single entity can alter records, creating a trustless system where integrity is mathematically guaranteed rather than institutionally enforced. This underpins the revolutionary concept of decentralized trust, which is one of the most powerful secrets of crypto assets.
3. Value Creation and Scarcity: The Economic Secret
Traditional assets derive value from underlying cash flows, commodities, or sovereign guarantees. Crypto assets, however, derive value from mathematical scarcity and network utility.
For example, Bitcoin’s total supply is capped at 21 million coins, making it a deflationary asset. This digital scarcity mimics the rarity of gold, positioning Bitcoin as “digital gold” and a hedge against inflation. Ethereum’s value, meanwhile, stems from its programmable utility—its blockchain powers thousands of decentralized applications (dApps) and smart contracts.
The economic secret is that crypto assets merge scarcity with utility. A token that is both scarce and useful tends to appreciate in value as network adoption grows—a phenomenon described by Metcalfe’s Law, which states that the value of a network is proportional to the square of its number of users.
4. The Secret Power of Decentralization
One of the most revolutionary aspects of crypto assets is decentralization—the removal of intermediaries like banks, brokers, or governments. In decentralized finance (DeFi), users can lend, borrow, trade, or invest directly using smart contracts without third-party oversight.
This system operates 24/7, globally, with transparent and automated processes. The secret advantage of decentralization is permissionless innovation: anyone can build or access financial services without seeking institutional approval. This democratizes finance and opens opportunities to billions of unbanked individuals worldwide.
However, decentralization comes with challenges—governance disputes, code vulnerabilities, and regulatory uncertainty—which form part of the hidden risks behind the promise of crypto wealth.
5. Crypto Market Dynamics: Secrets of Volatility and Manipulation
Crypto markets are notoriously volatile. Prices can rise or fall by double digits in a single day. This volatility is often misunderstood as pure speculation, but it also reflects deeper structural characteristics:
Low liquidity compared to traditional markets.
High leverage in derivatives and margin trading.
Whale activity—large holders who can manipulate prices.
News-driven sentiment amplified by social media and influencer culture.
A lesser-known secret is the role of algorithmic trading and market-making bots, which dominate exchanges and create rapid micro-fluctuations. Additionally, because crypto operates globally without a centralized regulator, price discovery is influenced by multiple fragmented exchanges.
To navigate this landscape, experienced investors rely on on-chain analysis, which examines blockchain data—wallet activity, token flows, and network metrics—to anticipate market trends beyond traditional charting methods.
6. Secrets of Crypto Investing and Portfolio Strategy
Successful crypto investing requires understanding not just price trends but fundamental blockchain metrics, including transaction volume, developer activity, tokenomics, and governance models.
Key strategies and their underlying “secrets” include:
HODLing – Long-term holding of high-conviction assets like Bitcoin or Ethereum, based on belief in their future dominance.
Staking – Earning passive income by locking coins to secure networks in PoS systems.
Yield farming – Lending or providing liquidity to DeFi protocols in exchange for rewards; highly profitable but risky.
NFT and metaverse investing – Speculating on digital ownership and virtual real estate.
Diversification – Allocating across blockchains, stablecoins, and DeFi projects to mitigate volatility.
Another secret is tokenomics, the economic design of a crypto project—how tokens are distributed, used, burned, or minted. Projects with transparent, sustainable tokenomics tend to outperform those with inflationary or centralized token supplies.
7. Hidden Risks and Security Secrets
While the crypto revolution promises freedom and profits, it hides complex security risks. Common vulnerabilities include:
Exchange hacks – centralized platforms holding billions in user assets are frequent targets.
Smart contract exploits – coding bugs that allow attackers to drain funds.
Phishing and social engineering – scams exploiting user ignorance or greed.
Private key loss – once lost, access to crypto wallets is permanently gone.
The security secret lies in self-custody—owning and protecting private keys through hardware wallets and multi-signature security models. Decentralized exchanges (DEXs) also enhance safety by allowing users to retain control of their assets during trading.
Another layer of defense is zero-knowledge proofs (ZKPs), a cryptographic innovation enabling transactions to be verified without revealing sensitive data. This technology is paving the way for privacy-preserving and scalable blockchains.
8. The Regulatory Secret: Balancing Innovation and Control
Governments worldwide are grappling with how to regulate crypto assets. The tension lies between fostering innovation and preventing financial crimes like money laundering or tax evasion.
The secret insight is that regulation is inevitable but potentially beneficial. Clear frameworks attract institutional investors who previously avoided crypto due to legal uncertainty. Countries like Singapore, Switzerland, and the UAE have leveraged crypto-friendly regulations to become global blockchain hubs.
Meanwhile, central banks are experimenting with Central Bank Digital Currencies (CBDCs)—state-issued digital currencies that adopt blockchain principles without decentralization. This reveals a paradoxical secret: the technology that began as a rebellion against centralization may ultimately reshape central banking itself.
9. The Institutional and Technological Shift
The entry of institutional players—hedge funds, asset managers, and public corporations—marks a new phase in crypto maturity. Companies like MicroStrategy, Tesla, and BlackRock have integrated Bitcoin into their balance sheets or fund offerings. This institutional endorsement signals that crypto is evolving from speculative trading to a legitimate asset class.
Behind the scenes, major innovations such as layer-2 scaling, interoperability protocols (Polkadot, Cosmos), and tokenized real-world assets (RWA) are redefining the boundaries of blockchain utility. These technologies aim to solve scalability bottlenecks and connect fragmented blockchains, enabling a seamless decentralized financial ecosystem.
The secret lesson here is convergence—the merging of traditional finance (TradFi) and decentralized finance (DeFi) into a hybrid model known as “CeDeFi”, where institutions adopt blockchain efficiencies while retaining regulatory compliance.
10. The Psychological Secret of Crypto Adoption
Crypto markets are not driven purely by technology—they are driven by belief and psychology. The phenomenon of community-driven growth, often seen in projects like Dogecoin or Shiba Inu, demonstrates how narratives and memes can mobilize collective sentiment into market capitalization worth billions.
The psychological secret lies in network belief—the idea that value in crypto is sustained by the confidence of its holders. When enough participants believe a token has worth, it self-validates through market demand. This blend of behavioral finance and digital community dynamics gives crypto its cultural power.
11. Environmental and Ethical Secrets
Critics argue that proof-of-work mining consumes enormous energy, raising concerns about sustainability. However, the hidden side of this debate is technological evolution. Newer blockchains are adopting energy-efficient consensus models, and Bitcoin mining is increasingly powered by renewable energy sources.
Moreover, the crypto industry is becoming a driver of green innovation—through tokenized carbon credits, renewable energy financing, and blockchain-based ESG tracking. Thus, the secret lies not in rejecting crypto’s environmental footprint but in harnessing it for sustainability solutions.
12. The Future Secrets of Crypto Assets
The future of crypto assets will be shaped by several converging trends:
Tokenization of real-world assets – turning stocks, real estate, and commodities into blockchain tokens for global access.
AI-driven smart contracts – merging artificial intelligence with blockchain for self-optimizing systems.
Cross-chain interoperability – seamless transfer of assets across different networks.
Decentralized identity (DID) – enabling privacy-preserving authentication and digital citizenship.
Institutional-grade custody and compliance – bridging crypto with traditional finance infrastructure.
The deeper secret is that crypto assets represent more than an investment trend—they are the foundation of a new digital economy built on transparency, inclusivity, and programmable trust.
Conclusion
The secrets of crypto assets lie not in hidden codes or mysterious markets, but in the profound reimagining of how humans define, exchange, and secure value. From decentralized trust and mathematical scarcity to programmable finance and tokenized ownership, crypto assets are revolutionizing global systems at every level.
Yet, with this transformation comes both opportunity and responsibility. Understanding these secrets allows investors, policymakers, and technologists to participate wisely in shaping a future where financial power is distributed, transparent, and resilient. As blockchain innovation continues to unfold, the true secret may be this: crypto assets are not just changing finance—they are redefining the very architecture of trust in the digital age.
BTC Market Update: Bulls Regain ControlBitcoin has stabilized after a sharp corrective phase, forming a consolidation structure around the $111,000 area. Recent sessions indicate that sellers are losing dominance while buyers are quietly re-accumulating within the current range. This type of price action often appears before a potential short-term recovery move.
Market volume remains steady, and the structure shows compression—suggesting liquidity buildup below the current level. If this consolidation sustains without breaking lower, a breakout toward the $115,000–$116,000 region appears likely. A clean move beyond this zone could invite stronger bullish continuation as sidelined traders re-enter.
However, the broader trend remains cautious, as macro conditions and dollar strength could still limit momentum. Short-term traders may look for entries near the range lows with clear invalidation below $108,000. Proper risk management remains essential, targeting gradual exits around mid-range levels and scaling profits near projected resistance zones.

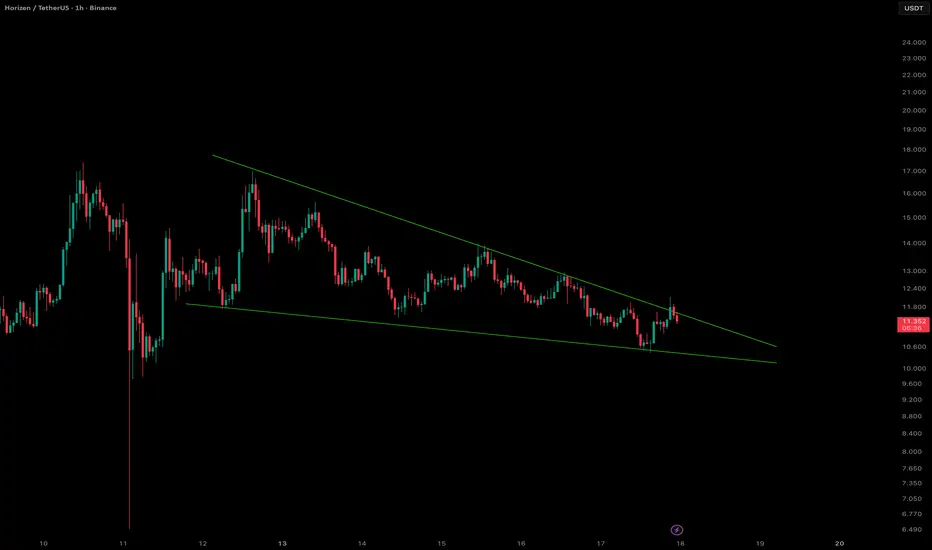
ZENUSDT Breaking Out of the Falling Wedge??HORIZEN (ZENUSDT) Analysis - 1 Hour Time Frame
Looks like ZEN is trying to break out of the falling wedge pattern. A candle close with decent volume or a successful retest above the falling wedge could confirm the bullish breakout.
In any case, Iam keeping an eye on this one, added to my watch list.
Dont forget to like and follow me to for more trade opportunities.
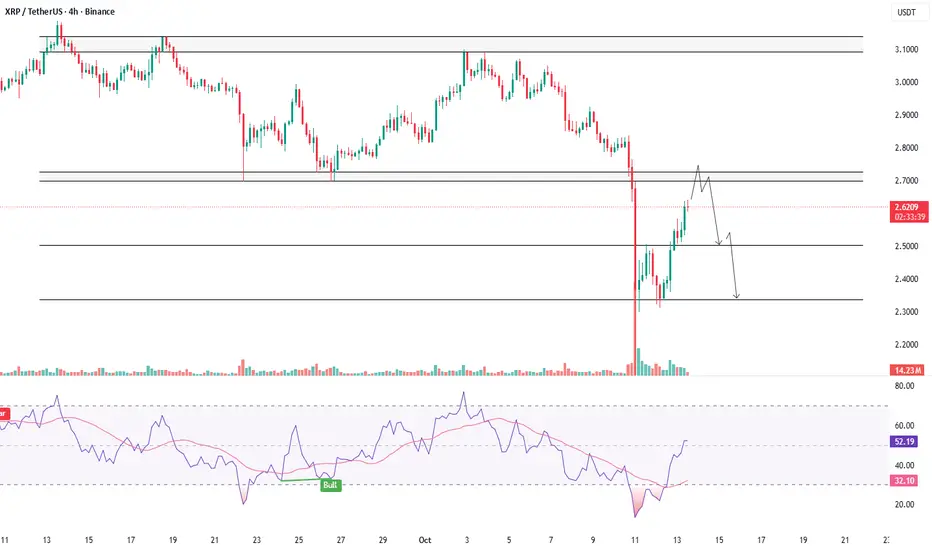
XRPUSDT - RETESTS RESISTANCE AFTER SELL-OFFSymbol - XRPUSDT
XRPUSDT is undergoing a corrective phase following a sharp sell-off. It remains premature to anticipate sustained growth without intermediate pullbacks, as the pair is approaching a major resistance zone.
The broader cryptocurrency market is showing signs of recovery after a period of heavy liquidations. Both BTCUSDT and XRPUSDT are nearing critical resistance levels, where a potential corrective movement could emerge.
From a technical perspective, after nearly two months of consolidation, the price broke below the established trading range, indicating a structural breakdown. As part of the current correction, XRPUSDT is retesting the liquidity zone between 2.7000 & 2.7266, which could serve as a trigger for renewed selling pressure.
Resistance levels: 2.7000 – 2.7266, 2.8286
Support level: 2.5050
A sharp advance without sufficient technical strength to surpass the 2.7000 resistance may lead to a false breakout, followed by a pullback toward the 2.5050 support zone.
What Makes Crypto Different from Traditional AssetsIntroduction
Cryptocurrencies have emerged over the last decade as a revolutionary form of digital asset, capturing global attention for their potential to redefine finance, investment, and even societal trust. Unlike traditional assets such as stocks, bonds, and fiat currencies, crypto operates on decentralized networks and utilizes cryptographic principles. While traditional assets have been the cornerstone of financial markets for centuries, crypto introduces novel features and risks that set it apart. Understanding these differences is crucial for investors, policymakers, and anyone interested in the evolution of financial markets.
1. Nature of the Asset
Traditional Assets: Traditional financial assets represent ownership in a tangible or legal entity. For example, stocks signify a share of ownership in a company, bonds are debt instruments promising future repayment, and real estate represents physical property. Their value is often tied to cash flows, earnings, or physical utility.
Cryptocurrencies: Cryptocurrencies are purely digital assets, existing only on a blockchain—a distributed ledger maintained by a network of computers. They do not inherently represent ownership of a company or tangible goods (except for certain tokenized assets). Their value derives from scarcity (like Bitcoin’s capped supply), network adoption, and market sentiment rather than conventional cash flows.
Key Difference: Crypto is an intangible, digital-only asset whose value is largely determined by market perception, adoption, and underlying blockchain technology, unlike traditional assets which are tied to tangible ownership or income streams.
2. Decentralization and Control
Traditional Assets: Traditional assets are regulated and controlled by central authorities such as governments, central banks, and regulatory bodies. For instance, stock markets operate under oversight from institutions like the SEC in the United States. Transactions are intermediated by banks, brokers, and clearinghouses, ensuring compliance with legal frameworks.
Cryptocurrencies: Most cryptocurrencies operate on decentralized networks, meaning no single entity controls the system. Transactions are verified by a distributed network of nodes using consensus mechanisms such as proof-of-work or proof-of-stake. Users can transact peer-to-peer without intermediaries, reducing reliance on centralized authorities.
Key Difference: Crypto offers decentralization and autonomy, whereas traditional assets rely heavily on centralized intermediaries for governance and transaction verification.
3. Supply and Inflation Mechanisms
Traditional Assets: Fiat currencies are subject to monetary policy, with central banks controlling supply to influence inflation, interest rates, and economic growth. Stocks are issued at the discretion of companies, and bonds follow government or corporate debt issuance schedules. The supply can be increased or adjusted according to policy or corporate strategy.
Cryptocurrencies: Cryptos like Bitcoin have fixed supplies encoded in their protocols (Bitcoin’s maximum supply is 21 million coins). Other cryptocurrencies use algorithms to control issuance and incentivize network participation. This scarcity is designed to emulate deflationary characteristics, contrasting with the often inflationary nature of fiat currencies.
Key Difference: Crypto supply is usually pre-determined and algorithmically enforced, whereas traditional assets are subject to discretionary management and central control.
4. Liquidity and Market Accessibility
Traditional Assets: Stocks and bonds are traded on regulated exchanges with established liquidity and market hours. Investors often require brokerage accounts, and trading may be limited by jurisdictional regulations. While liquidity is generally high for large-cap assets, small markets may suffer from limited participants.
Cryptocurrencies: Crypto markets operate 24/7 globally with virtually no geographic restrictions. Anyone with internet access can buy, sell, or hold crypto, often without the need for traditional intermediaries. However, liquidity can vary widely between coins; while Bitcoin and Ethereum are highly liquid, smaller tokens may be subject to high volatility and thin markets.
Key Difference: Crypto markets are continuously accessible and globally decentralized, unlike traditional markets with operational hours and regional constraints.
5. Volatility and Risk Profile
Traditional Assets: Traditional assets tend to have established risk-return profiles. While stocks can be volatile, especially in emerging sectors, they are generally less erratic compared to crypto. Bonds provide predictable returns with lower volatility, and commodities fluctuate based on supply-demand fundamentals.
Cryptocurrencies: Cryptos are highly volatile. Prices can swing 10–20% in a single day due to market sentiment, regulatory news, or technical developments. While volatility offers opportunities for high returns, it also carries substantial risk. Crypto markets are less mature and less predictable than traditional markets.
Key Difference: Crypto’s extreme volatility distinguishes it as a high-risk, high-reward asset class, unlike the relatively stable behavior of traditional financial assets.
6. Regulation and Legal Framework
Traditional Assets: Traditional financial assets operate under well-established legal frameworks and are protected by investor safeguards. Securities laws, accounting standards, and regulatory oversight aim to reduce fraud and systemic risk.
Cryptocurrencies: Crypto regulation is still evolving. Some countries have embraced it, creating frameworks for trading, taxation, and custody, while others ban or restrict usage. Lack of regulation can lead to fraud, hacking, and market manipulation. Investor protections are often minimal compared to traditional markets.
Key Difference: Traditional assets are highly regulated with legal recourse for investors, whereas crypto operates in a more ambiguous and evolving regulatory environment.
7. Transparency and Verification
Traditional Assets: Transparency in traditional assets is often limited to financial reporting, audits, and regulatory filings. Verification of ownership or transactions usually requires intermediaries like banks or clearinghouses.
Cryptocurrencies: Blockchains provide public, immutable ledgers where anyone can verify transactions without intermediaries. Smart contracts enable automatic execution of agreements. This transparency reduces the need for trust in centralized authorities but requires understanding of blockchain technology.
Key Difference: Crypto enables direct, verifiable transparency of transactions, while traditional assets rely on intermediaries for reporting and verification.
8. Divisibility and Portability
Traditional Assets: While fiat currencies are divisible and easily transferable, assets like real estate or certain bonds are not easily fractioned or transferred. Stocks can be subdivided through shares, but some physical assets remain illiquid or cumbersome.
Cryptocurrencies: Cryptos are highly divisible; for example, Bitcoin can be split into 100 million units called satoshis. Digital nature makes them extremely portable and transferrable across borders instantly with minimal fees compared to traditional banking systems.
Key Difference: Cryptos offer unmatched divisibility and portability, enhancing flexibility for small and large investors alike.
9. Innovation and Utility
Traditional Assets: The utility of traditional assets is relatively straightforward—stocks provide ownership, bonds offer interest, and commodities have industrial or consumption uses. Innovation in traditional finance occurs, but structural changes are slow due to regulatory and institutional constraints.
Cryptocurrencies: Cryptos are more than just assets; they enable decentralized finance (DeFi), tokenization, programmable money, and novel applications like NFTs. They offer utility within their ecosystems, such as participating in governance, staking, and decentralized applications.
Key Difference: Cryptos combine financial value with technological utility, whereas traditional assets primarily serve as stores of value or income generation tools.
10. Security and Custody
Traditional Assets: Security in traditional finance depends on trusted intermediaries—banks, brokers, and clearinghouses. Physical assets can be insured, and digital assets in broker accounts are protected by legal frameworks.
Cryptocurrencies: Crypto security is decentralized but relies heavily on private key management. Loss of keys can mean permanent loss of funds. While blockchain is secure by design, exchanges and wallets have been hacked, emphasizing the importance of personal custody practices.
Key Difference: Crypto security shifts responsibility to the individual, unlike traditional assets where intermediaries shoulder the protection burden.
11. Global Accessibility and Inclusivity
Traditional Assets: Access to traditional assets often requires citizenship, residency, or local bank accounts. Emerging markets may face barriers due to infrastructure limitations or regulatory constraints.
Cryptocurrencies: Crypto allows anyone with internet access to participate in global markets. It can provide financial inclusion to unbanked populations, bypassing traditional barriers.
Key Difference: Cryptos are inherently borderless and democratizing, while traditional assets are constrained by geography and regulatory frameworks.
Conclusion
Cryptocurrencies fundamentally differ from traditional assets across multiple dimensions: nature, control, supply mechanisms, liquidity, risk, regulation, transparency, divisibility, innovation, security, and accessibility. Traditional assets are backed by tangible entities or cash flows, regulated by authorities, and generally stable, while crypto thrives on decentralization, digital scarcity, and technological innovation.
These differences create opportunities and challenges. On one hand, crypto democratizes finance, allows for 24/7 global markets, and enables programmable financial tools. On the other hand, it introduces high volatility, regulatory uncertainty, and security risks. As the financial landscape evolves, understanding these distinctions is critical for investors, regulators, and innovators aiming to navigate both traditional and digital asset ecosystems.
Cryptocurrency is not merely an alternative investment; it represents a paradigm shift in how value, trust, and financial transactions are conceived. While traditional assets remain foundational to wealth creation, crypto pushes the boundaries of what constitutes money, ownership, and economic participation in the 21st century.
ZECUSDT - HOLDING STRONG AMID MARKET WIDE LIQUIDATIONSSymbol - ZECUSDT
CMP - 267.18
ZECUSDT has demonstrated notable resilience amid the broader cryptocurrency market downturn, which triggered over $10 billion in long position liquidations. Even in such an environment, certain assets have managed to withstand the selling pressure.
The cryptocurrency market remains gripped by panic and widespread liquidations, with Bitcoin currently testing the 100K level under intense selling pressure. However, amidst this turmoil, a few altcoins have shown relative strength - ZECUSDT being one of them as it continues to climb and test key resistance zones.
ZEC experienced a sharp decline earlier but found strong demand near the high volume node around 145 - 155. The subsequent aggressive rebound indicates the presence of solid bullish interest at these levels.
Resistance levels: 280.30, 305.65
Support levels: 242.64, 208.76
Focus remains on the 280.20 trigger zone. If the current retest does not result in a deep pullback and price consolidates near resistance, the likelihood of a breakout increases substantially. A decisive close above 280.30 - 280.50 could open the path for a rally toward 305 - 345. That said, it remains a high-risk setup, and traders are advised to exercise caution and maintain tight stoploss.

ALGO Swing Trade Setup — Support Bounce OpportunityWe see a strong support zone forming around $0.186 – $0.195, which has been tested multiple times in the past. This area is acting as a potential springboard for a bullish reversal.
If price respects this zone, we may see momentum carry ALGO upward toward key resistance areas.
Entry Zone: $0.186 – $0.195
Target 1: $0.225 – $0.26
Target 2: $0.285 – $0.33
Stop Loss: Just below $0.18, invalidating the setup if price breaks lower

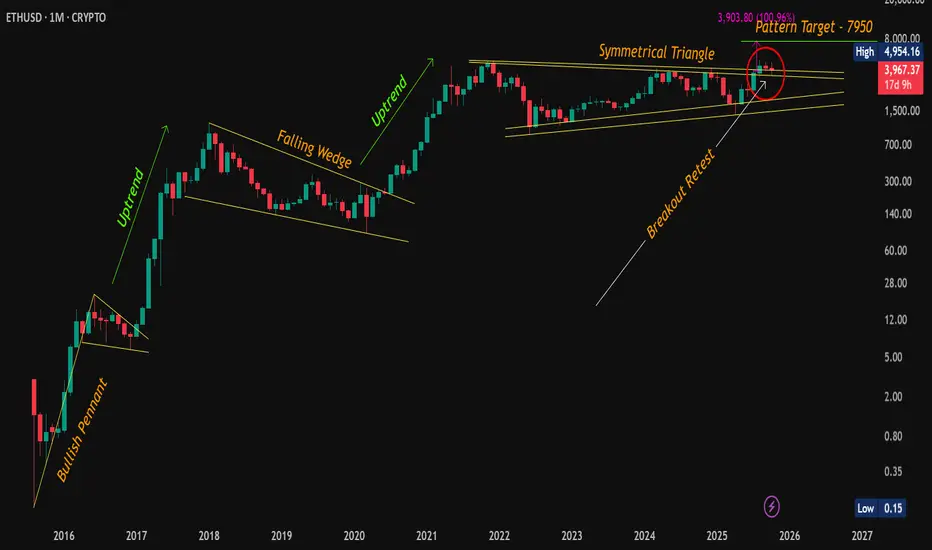
ETH Retest Confirmed – Bullish Momentum Intact!CMP: $3,968
Ethereum is holding strong above the symmetrical triangle breakout zone after a textbook breakout + retest . Despite the recent consolidation, the structure remains bullish , and the bigger pattern is still in play.
🔶 Technical Highlights:
✅ Symmetrical Triangle Breakout: ETH successfully broke out and retested the upper trendline (see red circle). This retest confirms the breakout validity.
✅ Consolidation Above Resistance: ETH is consolidating in a tight range above previous resistance , forming a potential bull flag .
✅ Pattern Targets Remain Active:
📍 Symmetrical Triangle Target: ~$7,950
📍 Bull Flag Target (if breakout confirms): ~$7,365+
📈 Market Structure:
📍 Previous breakouts (Bullish Pennant in 2016, Falling Wedge in 2019) led to strong uptrends .
📍 Current consolidation mirrors historical patterns that preceded major rallies.
🟢 Key Level to Watch:
📍 A monthly close above $4,954.16 (previous ATH) would mark the next major confirmation, likely attracting breakout traders and institutions.
💡 ETH is showing maturity in structure – breakouts, retests, and consolidations are happening on higher timeframes with clear technical precision. The longer this base holds, the stronger the eventual move could be.
📌 Disclaimer: This analysis is shared for educational purposes only. It is not a buy/sell recommendation. Please do your own research before making any trading decisions.
#ETH | #Ethereum | #Crypto | #Breakout | #ChartPatterns | #SymmetricalTriangle | #BullFlag | #PriceAction
BTCUSD CONTINUATION UPDATE ( 4H )As expected from our previous setup, BTCUSD respected the supply zone near 116,000–117,000, perfectly reacting from the premium range of our last impulse leg. The rejection confirmed a clean Market Structure Shift (MSS) around 112,400–113,000, shifting control back to the sellers.
After the MSS, price retraced back to fill the imbalance and mitigate the 4H bearish order block, then continued its descent toward our partial take-profit zone around 110,800–111,000, which has already been reached and delivered solid profits.
Currently, BTC is consolidating just above the discount range (107,800–107,300), aligning with a small 4H demand zone and the 0.618 fib retracement of the prior impulse. This area is crucial — it’s where short-term buyers may attempt a bounce, but our overall structure still leans bearish until we reclaim 113,200 with a strong 4H close.
Below lies uncollected liquidity and extended targets at:
0.786 Fib: 105,850
1.0 Projection: 103,100
1.618 Expansion: 95,100
Our short entries from the 115k region are currently floating over +1,400 USD per lot, showing strong momentum in line with the macro bearish swing.
🎯 Plan Moving Forward:
Maintain partials secured around 110,800.
Trail the remainder below 110,500 structure to protect profits.
Continue targeting the deeper liquidity zones (103k–105k) unless market structure flips bullish.
❌ Invalidation:
A clean 4H close above 113,200 will signal potential shift back to bullish order flow — in that case, we’ll monitor for new FVGs or OBs to plan re-entry.

BTCUSD RAINING BLO*D🩸 BTC slapped our sell-limit like it owed it money 💀 The setup looked clean — until the bulls said “Not today.” We’re running in drawdown, but structure still holds hope ⚔️
📉 Current View:
BTCUSD 1H — Price rejected around 115.9K–116.8K liquidity zone after a market structure shift (MSS) at 113.0K. Structure remains bearish unless daily closes above 116.8K.
📊 Key Levels:
🔴 Resistance/Sell Zone: 115.8K–116.8K (OB / liquidity)
⚫ Structure Break: 113.0K → below = continuation
🟢 Buy Re-entry/Demand Zones: 112.4K–111.7K | 109.8K–108.9K (golden pocket)
🧠 Trading Plan:
• Bearish bias holds while below 116.8K → Target 113.0K then 109.8K
• Bullish flip only if daily candle closes above 117K → Next target 119.5K–121.2K
📰 BTC Update:
ETF inflows slow mid-October; CPI data due this week could spark volatility. Derivatives funding rates mildly positive — short-term long bias possible, but liquidity still favors downside traps.
💬 Trader’s Humor: “Sell-limit triggered, stop-loss flirting, and patience getting margin-called — just another day in crypto.” 😂
#BTCUSD #BitcoinAnalysis #CryptoTraders #SmartMoneyConcepts #PriceAction #ForexCommunity #CryptoSetup #TradingLife #TraderHumor #BitcoinForecast #CryptoAnalysis #LiquidityHunt #PriceActionTrading #CryptoCommunity #BTCSetup #ForexAndCrypto #alphatechfinances

XAUUSD HIT MY STOP LOSSGold just broke above our previous OB/Liquidity resistance around 4040–4055, taking out the short-side liquidity and confirming a bullish market structure shift (MSB) on 15M and 1H timeframes.
🔹 Previous plan: Sell-limit at resistance — invalidated as price made a new high.
🔹 Current bias: Bullish continuation towards 4078 → 4095 → 4120.
🔹 Pullback zones to watch:
• 4035–4045 (OB retest / liquidity grab area)
• 4005–4020 (golden pocket confluence)
🧠 Trading Plan:
Wait for price to retrace into key support zones.
Look for bullish rejection / confirmation before entering long.
First TP near 4078, extended targets 4095+
SL below 4020 zone (structure invalidation).
💬 Price action respected structure beautifully. Remember — the market doesn’t care about our limits, only about liquidity.
Trade what’s visible, not what’s emotional.
#XAUUSD #GoldForecast #ForexTrader #SmartMoneyConcepts #LuxAlgo #OrderBlockTrading #LiquiditySweep #PriceAction #GoldAnalysis #TradingStrategy #TechnicalAnalysis #ForexSetup #DayTrading #ChartAnalysis #TradingView #alphatechfinances

Cryptocurrency and Blockchain TradingIntroduction
Cryptocurrency and blockchain trading represent a transformative evolution in global financial markets. Unlike traditional fiat currencies governed by central banks and financial institutions, cryptocurrencies operate on decentralized networks built on blockchain technology. This paradigm shift has created unique opportunities and challenges for traders, investors, and institutions worldwide.
At its core, cryptocurrency trading involves buying, selling, and exchanging digital assets, often with the goal of making profits from price fluctuations. Blockchain technology, the underlying framework for cryptocurrencies, ensures transparency, security, and decentralization, enabling peer-to-peer transactions without intermediaries.
This article explores the principles, mechanisms, strategies, and risks involved in cryptocurrency and blockchain trading, offering a detailed guide for beginners, intermediate, and advanced market participants.
Understanding Cryptocurrencies
Definition and Characteristics
A cryptocurrency is a digital or virtual currency that uses cryptography for security and operates on a decentralized ledger called a blockchain. The defining characteristics include:
Decentralization: No single entity controls the network. Decisions are made through consensus mechanisms.
Security: Cryptographic algorithms secure transactions and wallets, making fraud extremely difficult.
Transparency: Blockchain ensures that all transactions are visible to participants, enhancing trust.
Limited Supply: Many cryptocurrencies, like Bitcoin, have a capped supply, creating scarcity that can influence value.
Programmability: Smart contracts enable programmable transactions, automatically executing when predefined conditions are met.
Popular Cryptocurrencies
Bitcoin (BTC): The first and most valuable cryptocurrency, often regarded as digital gold.
Ethereum (ETH): Known for its smart contract capabilities and decentralized applications (dApps).
Ripple (XRP): Focused on cross-border payments and banking solutions.
Litecoin (LTC): A faster, lighter alternative to Bitcoin for peer-to-peer transactions.
Binance Coin (BNB): Initially used for exchange fee reductions on Binance, now powering multiple DeFi applications.
Blockchain Technology: The Backbone
How Blockchain Works
A blockchain is a distributed digital ledger that records transactions across multiple computers. Key components include:
Blocks: Data structures that store transaction records.
Chains: Blocks are linked sequentially, forming a chain. Each block contains a cryptographic hash of the previous block, ensuring integrity.
Nodes: Computers participating in the network that validate and store blockchain data.
Consensus Mechanisms: Protocols like Proof of Work (PoW) and Proof of Stake (PoS) ensure agreement on the blockchain's state.
Benefits for Trading
Security: Immutable records prevent fraud and manipulation.
Transparency: Publicly accessible ledgers allow traders to verify transactions.
Efficiency: Automated smart contracts reduce reliance on intermediaries.
Global Reach: Cryptocurrencies are borderless, allowing participation across nations.
Cryptocurrency Trading Explained
Cryptocurrency trading differs from traditional markets due to high volatility, continuous operation (24/7 trading), and unique technical dynamics.
Types of Cryptocurrency Trading
Spot Trading
Spot trading involves buying and selling cryptocurrencies for immediate settlement. Traders profit from price differences in the short term or long term. Exchanges like Binance, Coinbase, and Kraken facilitate spot trading.
Margin Trading
Margin trading allows traders to borrow funds to increase their market exposure. This amplifies both potential profits and losses. For example, using 10x leverage, a $1,000 investment controls $10,000 worth of crypto.
Futures Trading
Futures contracts are agreements to buy or sell cryptocurrency at a predetermined price on a future date. Platforms like BitMEX, Binance Futures, and Bybit provide derivatives markets. Futures trading enables speculation on price movements without owning the underlying asset.
Options Trading
Options give traders the right, but not the obligation, to buy or sell cryptocurrency at a set price within a specific period. This allows hedging and risk management strategies.
Algorithmic and Automated Trading
Bots and trading algorithms execute orders based on predefined strategies, such as arbitrage, trend-following, or market-making, enabling high-frequency trading and consistent execution.
Market Participants
Cryptocurrency trading involves diverse participants, each influencing market behavior differently:
Retail Traders: Individual investors seeking profit from short-term or long-term price movements.
Institutional Investors: Hedge funds, asset managers, and corporations investing in crypto assets, influencing liquidity and stability.
Market Makers: Entities providing liquidity by continuously buying and selling assets, reducing bid-ask spreads.
Speculators: Traders aiming to profit from volatility without necessarily believing in the long-term value of the asset.
Arbitrageurs: Traders exploiting price differences across exchanges for risk-free profit.
Key Factors Influencing Cryptocurrency Prices
Market Sentiment: News, social media, and influencer activity can dramatically affect prices.
Regulation: Government policies, legal status, and taxation of cryptocurrencies impact market confidence.
Technology Upgrades: Network updates, forks, and innovations influence asset value.
Liquidity and Market Depth: Higher liquidity reduces volatility, whereas low liquidity can amplify price swings.
Global Economic Factors: Inflation, fiat currency performance, and geopolitical events indirectly affect crypto markets.
Technical Analysis in Cryptocurrency Trading
Common Tools
Candlestick Patterns: Identify trends and reversals through patterns like doji, hammer, or engulfing candles.
Moving Averages (MA): Track average prices to determine trend direction. Popular types include SMA (Simple Moving Average) and EMA (Exponential Moving Average).
Relative Strength Index (RSI): Measures overbought or oversold conditions.
MACD (Moving Average Convergence Divergence): Identifies trend changes and momentum.
Fibonacci Retracements: Used to predict support and resistance levels.
Trading Strategies
Day Trading: Entering and exiting positions within a single day to profit from intraday volatility.
Swing Trading: Holding assets for days or weeks to capitalize on medium-term trends.
Scalping: Rapid, high-volume trades exploiting small price movements.
HODLing: Long-term holding based on belief in the asset’s future potential.
Fundamental Analysis
Fundamental analysis evaluates a cryptocurrency’s intrinsic value based on qualitative and quantitative factors:
Whitepapers: Documents detailing a project’s goals, technology, and tokenomics.
Development Team: Experienced and reputable developers increase project credibility.
Community Support: Active communities on forums, social media, and GitHub indicate long-term viability.
Partnerships and Adoption: Integration into businesses and financial systems enhances value.
Supply Mechanisms: Token supply, staking incentives, and burning mechanisms influence scarcity.
Risk Management in Cryptocurrency Trading
Due to extreme volatility, risk management is crucial:
Position Sizing: Limit exposure based on account size and risk tolerance.
Stop-Loss Orders: Automatically close positions to prevent excessive losses.
Diversification: Spread investments across multiple assets to reduce concentration risk.
Leverage Caution: High leverage can magnify losses; traders should use it judiciously.
Security Practices: Use hardware wallets, two-factor authentication (2FA), and secure exchanges.
Regulatory and Legal Considerations
Cryptocurrency trading regulations vary globally:
United States: Regulated by SEC, CFTC, and FinCEN, focusing on securities compliance and anti-money laundering.
European Union: Markets are gradually regulated under MiCA (Markets in Crypto-Assets Regulation).
Asia: Countries like Japan and Singapore have clear licensing frameworks, while India’s stance fluctuates.
Other Regions: Some nations ban crypto entirely, while others encourage innovation.
Traders must stay informed to comply with taxation, reporting, and legal requirements.
Emerging Trends
Decentralized Finance (DeFi): Peer-to-peer financial systems offering lending, borrowing, and staking opportunities.
Non-Fungible Tokens (NFTs): Unique digital assets creating new investment classes and liquidity opportunities.
Institutional Adoption: Companies adding crypto to balance sheets or offering trading platforms.
Layer-2 Scaling Solutions: Enhancements like Ethereum’s Polygon reduce fees and increase transaction speed.
AI-Driven Trading: Advanced algorithms analyzing market sentiment and predictive trends.
Challenges in Cryptocurrency Trading
Volatility: Rapid price swings can lead to significant losses.
Security Risks: Exchange hacks, phishing, and wallet theft remain major concerns.
Regulatory Uncertainty: Changing laws can disrupt markets and affect liquidity.
Liquidity Constraints: Low trading volume in certain coins can cause slippage.
Emotional Trading: Fear and greed often lead to irrational decisions.
Conclusion
Cryptocurrency and blockchain trading is a dynamic and rapidly evolving domain combining technology, finance, and human behavior. While it offers opportunities for significant profit, it carries substantial risk. Successful trading requires a blend of technical analysis, fundamental research, risk management, and regulatory awareness.
As blockchain adoption grows and institutional participation increases, cryptocurrency markets are likely to mature, offering more stability, innovative instruments, and integration into the broader financial ecosystem.
Traders who stay informed, disciplined, and adaptable are best positioned to navigate this revolutionary landscape. With proper education, robust strategy, and caution, cryptocurrency trading can transform from a speculative gamble into a structured, potentially rewarding endeavor.
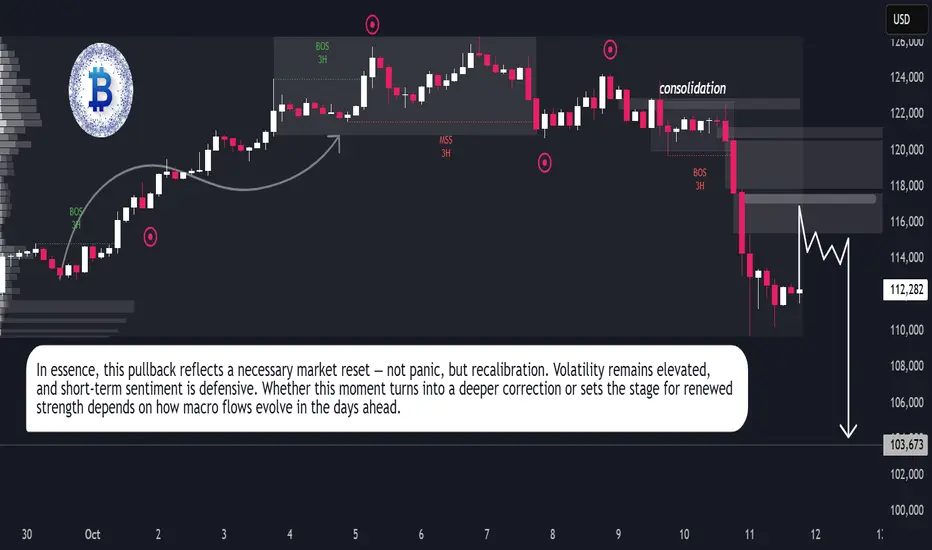
Bitcoin Faces Sudden Shakeout After Weeks of CalmBitcoin Volatility Returns as Market Momentum Resets
Hello Traders,
The Bitcoin market experienced a sudden burst of volatility in the recent session, ending a period of relative calm. On the 4H timeframe (Binance), intense selling pressure drove prices from near $117,000 down to roughly $109,000 before stabilizing around the $112K region. The swift decline marked a clear shift in short-term momentum, showing that buyers are beginning to lose dominance as broader market sentiment cools.
This pullback unfolded against a backdrop of renewed global uncertainty. A series of trade-related policy headlines reignited risk aversion, while continued strength in the U.S. dollar added additional stress to crypto markets. Institutional flows briefly reversed, signaling reduced confidence in near-term upside potential. The result was a wave of forced liquidations, magnified by leverage, as traders rushed to adjust exposure during the drop.
Despite the intensity of the move, market conditions remain structurally healthy. On-chain data shows that long-term holders are largely unmoved, suggesting this phase is more of a short-term repricing than a major cycle reversal. Derivative markets, however, have cooled significantly — open interest has thinned, and funding rates have normalized, indicating a temporary reset in speculative participation.
In the coming days, Bitcoin’s behavior will likely depend on liquidity dynamics rather than new macro data. With upcoming U.S. economic reports delayed and the dollar holding firm, volatility may persist as traders respond to headlines and reposition ahead of the next policy developments.
For now, the market appears to be in a state of balance after rapid liquidation. Whether this forms a new accumulation base or precedes deeper correction will depend on how quickly momentum returns. The broader sentiment remains cautious but stable — a waiting phase, as the market tests its conviction once more.
Bitcoin H1 Analysis: Shorting the Retracement After Major BrKDWNLet’s analyze your **BTCUSD H1 chart** carefully 👇
---
🧠 Chart Summary
* **Symbol:** BTCUSD
* **Timeframe:** H1
* **Current Price:** ~112,309
* **Sell Limit:** 113,041.61
* **Stop Loss (SL):** just above 113,041.61 (roughly near 113,300–113,400)
* **Take Profit (TP):** not explicitly shown but likely near 109,000–108,000 based on structure.
---
📊 **Technical Breakdown**
1️⃣ Trend Direction
* The pair is **in a clear short-term downtrend** after failing to hold above the **Previous Daily High (≈122,900)**.
* Price broke **below 50% and 61.8% Fibonacci retracement levels**, confirming bearish momentum.
* **Moving averages (Red = short-term EMA, Yellow = long-term EMA)** are both sloping **downward**, showing strong bearish momentum.
2️⃣ Key Structure Levels
* **Previous Daily High:** ~122,900 (Major resistance zone)
* **Previous Daily Low:** ~114,700 (Broken → retest expected)
* **Sell Limit Level (113,041.61):** Perfectly placed near the **Fibonacci 23.6%–38.2% retracement zone** of the last swing leg.
* This is an **ideal “lower-high” retracement entry** in a downtrend.
#### 3️⃣ Support Zones Below
Immediate support:** 111,800
Next key support:** 109,250 (around your possible TP zone)
Weekly low zone:** 108,350 – if that breaks, we could see a deeper push to 106,000.
---
⚙️ **Trade Plan Analysis (Sell Limit 113041.61)
| Aspect | Analysis |
| --------------------- | --------------------------------------------------------------- |
| **Setup Type** | Pullback Sell / Lower-High Entry |
| **Bias** | Strongly Bearish |
| **Entry Level** | 113,041.61 (Good retracement zone) |
| **Stop Loss** | Above 113,400–113,600 (just beyond structure) |
| **Take Profit** | 109,200–108,300 (previous support and 100% Fibonacci extension) |
| **Risk/Reward Ratio** | ~1:3 or better depending on TP placement |
| **Probability** | High – provided retracement completes to your Sell Limit |
---
🔥Confirmation Points Before Entry Triggers
If price retraces upward:
* Watch for **bearish engulfing** or **rejection candle** near 113,000 zone.
* If price fails to break above 113,400, your entry is valid.
* If it closes **above 113,600 on H1**, consider canceling the order — it would mean short-term momentum shifted bullish temporarily.
---
🧩 Summary Plan
✅ **Entry:** Sell limit at 113,041.61
✅ **SL:** 113,400–113,600
✅ **TP1:** 111,900
✅ **TP2:** 109,200
✅ **TP3:** 108,350
📉 **Bias:** Bearish continuation after pullback
---
⚠️Extra Notes
* Momentum is strong; if the retracement doesn’t reach 113,000, you might miss the entry — don’t chase.
* A secondary entry could form near **112,700** if a fresh rejection candle appears there.
* News events or BTC volatility spikes can create fake pullbacks — always watch the **H1 close** for confirmation.
-
ETHFIUSDT - BULLS ARE NOT DONE YET?Symbol - ETHFIUSDT
ETHFIUSDT is undergoing a corrective phase after updating its local high at 1.938 The breakout above the 1.677 zone appears to be an attempt to initiate a distribution phase following an extended period of consolidation. The key question now is whether the bulls can sustain control above this area.
Bitcoin is also in correction mode following a false breakout of its resistance level. In this context, the broader cryptocurrency market is experiencing a temporary decline. Nevertheless, the prevailing trend remains bullish, supported by a favorable fundamental outlook. Once the current correction concludes, market growth may resume.
On the daily timeframe, ETHFIUSDT is attempting to transition into a distribution phase after approximately five to six months of consolidation. The overall trend remains upward, and following the breakout of resistance, a corrective movement toward the liquidity zone at 1.677 is developing. A false breakdown, accompanied by a shift in market imbalance and subsequent consolidation above 1.678, could stimulate renewed buyer interest - potentially leading to further price appreciation.
Resistance levels: 1.898, 1.938
Support levels: 1.677, 1.534
The chart highlights two critical support zones - 1.677 and 1.534, Sustained bullish activity above the 1.677 level may result in a rebound and continued upward movement, confirming the ongoing distribution phase. Conversely, failure to maintain this level could prompt a retest of the zone at 1.534, where a liquidity sweep may subsequently trigger a new wave of buying pressure.

LTCUSDT - BULL TRAP IN MAKING?Symbol - LTCUSDT
CMP - 130.00
LTCUSDT is currently forming a distribution pattern following a period of local consolidation. The price is testing the resistance zone and exhibiting signs of a false breakout. However, it is important to note that the broader cryptocurrency market remains in a corrective phase.
At present, Bitcoin appears relatively weak, undergoing both a correction and short-term consolidation ahead of a potential continuation of the decline toward the 117K-116K range. Within this environment, the recent upward move in LTCUDST may be short lived and could transition into an aggressive decline if the price closes below the key resistance level.
This false breakout, or market manipulation relative to resistance, suggests that LTC’s current rally may represent a local bull trap, particularly amid broader market weakness. A breakdown could lead the pair toward the breakeven or liquidity zone between 124.10 & 115.30
Resistance levels: 132.00, 134.20
Support levels: 124.14, 115.36
A confirmed false breakout of the resistance zone, especially while the altcoin market continues to weaken, could indicate a liquidity grab prior to a deeper market alignment with Bitcoin’s broader correction. Consequently, confirmation of this pattern may serve as a signal for a potential downside move in LTCUSDT.

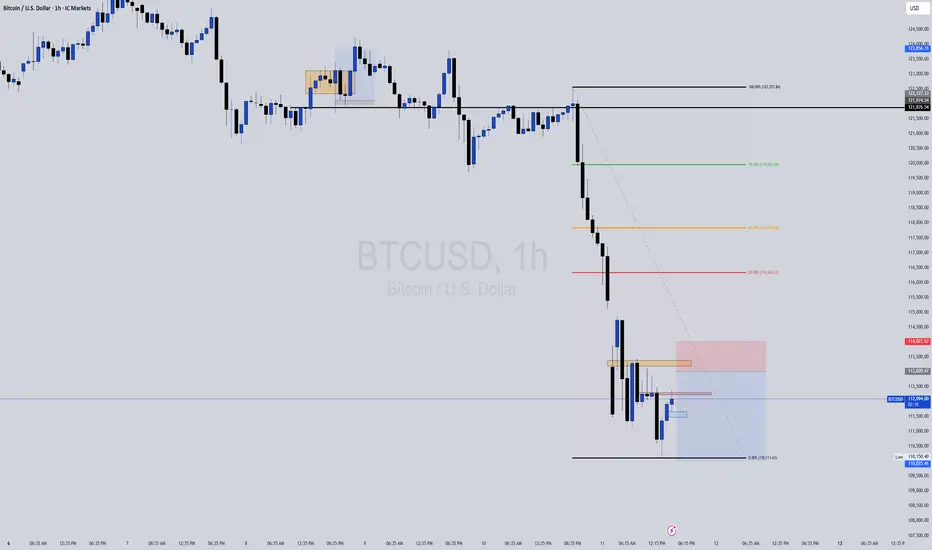
BTC → Correction phase before bullish expansionBTC/USD Report-Based Analysis
Bitcoin is currently in a corrective phase following a structured upward delivery. After showing strength early in the cycle, the market transitioned into a redistribution and consolidation zone, allowing liquidity to rebalance across both sides. This shift suggests that price is undergoing a short-term reaccumulation before the next impulsive move. The recent break of structure (BOS) indicates a temporary bearish delivery, designed to sweep liquidity below prior demand zones. Smart money appears to be collecting positions in discounted price areas, absorbing sell-side liquidity as volatility expands. The clean liquidity pockets under 116,000–114,000 levels highlight potential mitigation zones where larger participants may seek re-entry. The overall structure remains bullish on the higher timeframe. Once the current correction finalizes and liquidity is efficiently collected, BTC may resume its upward expansion, targeting premium zones near 125,000 and above. Momentum confirmation from volume and market flow will be essential for validating this transition back into a bullish delivery phase. In short, BTC is in a controlled correction, aiming to refine liquidity before reinitiating its bullish macro delivery cycle.

How Liquidity Zones in Forex Mirror in Bitcoin Markets?Hello Traders!
If you’ve studied liquidity concepts in Forex trading , you might’ve noticed how similar they behave in the crypto market , especially in Bitcoin.
Both markets are driven by liquidity and order flow, not random price movements.
Let’s understand how these two worlds mirror each other and how you can use that knowledge to trade smarter.
1. What Are Liquidity Zones?
Liquidity zones are price areas where a large number of orders are placed, stop losses, buy/sell limits, or pending entries.
Institutions and big players target these zones to execute their large positions with minimal slippage.
That’s why price often “hunts” highs or lows before the real move starts.
2. Liquidity Behavior in Forex
In pairs like EUR/USD or GBP/USD, liquidity often builds near session highs and lows.
Smart money pushes price to these zones to trigger retail stops and grab liquidity.
Once liquidity is collected, the market usually reverses in the opposite direction.
3. The Same Psychology in Bitcoin
Bitcoin may not be a currency pair, but it runs on the same emotional patterns, fear, greed, and impatience.
Liquidity clusters near obvious highs/lows, round numbers (like $60,000 or $50,000), and breakout points.
Big players hunt these zones in the same way as in Forex, because crypto markets are even more sentiment-driven.
4. How to Identify These Zones on BTC Charts
Mark previous day’s highs and lows, these are classic liquidity targets.
Check where price made impulsive moves in the past; those areas often have resting orders.
Look for quick “fakeouts” beyond these levels followed by strong rejection, a sign liquidity was grabbed.
5. How to Trade the Mirroring Pattern
Wait for liquidity grab candles (spikes above/below key levels).
Enter on confirmation of reversal (engulfing or pin bar).
Place stops beyond the liquidity wick and target the next range midpoint.
Rahul’s Tip:
Whether it’s Forex or Bitcoin, the chart structure changes, but human behavior doesn’t .
If you understand how liquidity works in one market, you can easily read the traps in another.
Conclusion:
Liquidity is the universal language of smart money.
The same tricks used in Forex, fakeouts, stop hunts, and reversals, repeat daily in Bitcoin charts.
Once you learn to spot them, you’ll see that both markets are mirrors of each other in how they trap and move traders.
If this post helped you see the connection between Forex and Bitcoin, like it, drop your view in comments, and follow for more deep market insights!
Trading Gold and Cryptocurrency in the Indian Market1. Overview of Gold Trading in India
Gold has deep cultural and economic significance in India. It is widely used in jewelry, savings, and investment, making India one of the largest consumers of gold globally.
1.1 Forms of Gold Investment
In India, gold trading occurs in several forms:
Physical Gold – Jewelry, coins, and bars.
Gold ETFs (Exchange-Traded Funds) – Allow investors to buy units representing gold without physically holding it.
Sovereign Gold Bonds (SGBs) – Issued by the Reserve Bank of India (RBI), providing interest along with appreciation in gold price.
Futures and Options – Traded on the Multi Commodity Exchange (MCX), providing leveraged exposure.
1.2 Gold Trading Mechanics
Gold trading in India, especially in the futures market, involves contracts with standard weights (1 kg, 100 grams, etc.). Prices fluctuate based on domestic demand, international gold prices, USD/INR exchange rates, and geopolitical tensions. Traders can go long (buy) or short (sell), using leverage to maximize returns, though this increases risk.
1.3 Strategies in Gold Trading
Trend Trading: Identifying upward or downward trends in international or domestic gold prices and trading accordingly.
Hedging: Using gold futures to protect portfolios from inflation or currency depreciation.
Arbitrage: Exploiting price differences between spot markets, ETFs, and futures.
1.4 Risks and Considerations
Gold is influenced by global market volatility.
Leverage can magnify losses.
Liquidity in physical gold is higher, but online platforms provide faster execution.
2. Overview of Cryptocurrency Trading in India
Cryptocurrency trading in India is still evolving. Cryptos are digital or virtual currencies that operate on blockchain technology. The most popular are Bitcoin (BTC), Ethereum (ETH), Ripple (XRP), and several altcoins.
2.1 Cryptocurrency Market in India
India has seen explosive growth in cryptocurrency adoption over the last few years. Exchanges like WazirX, CoinDCX, and ZebPay provide platforms for trading Bitcoin and other digital assets. Trading can occur in:
Spot Market: Buying and selling cryptocurrencies at current market prices.
Futures Market: Contracts allowing traders to speculate on future prices.
Margin Trading: Trading using borrowed funds to amplify gains (and risks).
2.2 Regulatory Landscape
Cryptocurrency regulations in India remain in flux:
RBI Restrictions: Previously, banks were restricted from providing services to crypto exchanges, but this has eased after Supreme Court intervention.
Taxation: Cryptocurrency gains are taxed at 30%, with a 1% TDS on transactions above a certain threshold.
Legal Status: Cryptos are legal to trade but not recognized as legal tender.
2.3 Strategies for Crypto Trading
Day Trading: Taking advantage of intraday volatility to make profits.
Swing Trading: Capitalizing on medium-term trends lasting days or weeks.
HODLing: Long-term holding based on belief in price appreciation.
Arbitrage: Exploiting price differences across exchanges.
2.4 Risks and Considerations
Cryptocurrencies are highly volatile; prices can swing 10-20% within hours.
Exchanges may face liquidity or security issues.
Regulatory changes can significantly impact prices.
3. Trading Platforms in India
3.1 Gold Trading Platforms
MCX (Multi Commodity Exchange): Futures and options.
Stock Broker Platforms: Zerodha, Upstox, ICICI Direct provide access to ETFs and SGBs.
Banks and Post Offices: For Sovereign Gold Bonds and physical gold.
3.2 Crypto Trading Platforms
WazirX: Popular for beginners with simple UI.
CoinDCX: Offers derivatives trading and margin facilities.
ZebPay: Secure platform with various coins available.
International Platforms: Binance and Kraken for Indian residents (with caution on regulations).
4. Technical and Fundamental Analysis
4.1 Gold
Technical Analysis: Uses price charts, trendlines, moving averages, and RSI to predict price movements.
Fundamental Analysis: Considers inflation rates, global demand, central bank policies, and geopolitical events.
4.2 Cryptocurrency
Technical Analysis: Chart patterns, candlestick formations, MACD, Bollinger Bands, and volume analysis.
Fundamental Analysis: Blockchain adoption, regulatory news, network updates, and market sentiment.
5. Risk Management
5.1 Gold
Diversify between physical gold, ETFs, and futures.
Limit leverage to avoid margin calls.
Monitor global gold prices and USD/INR movements.
5.2 Cryptocurrency
Trade only with capital you can afford to lose.
Use stop-loss orders to minimize losses.
Keep funds in secure wallets rather than exchanges for long-term holding.
Diversify across coins to spread risk.
6. Future Outlook
6.1 Gold
Gold will remain a core part of Indian investment due to cultural affinity and inflation hedging.
Global uncertainties, such as currency devaluation or geopolitical tensions, can drive prices higher.
6.2 Cryptocurrency
Adoption is expected to rise as digital literacy grows.
Regulations will play a pivotal role in shaping market stability.
Potential for blockchain-based applications beyond trading, including NFTs, DeFi, and metaverse assets.
Conclusion
Trading gold and cryptocurrencies in India offers unique opportunities for portfolio diversification. Gold provides stability and hedging against inflation, while cryptocurrencies offer potential high returns at higher risk. Success in both markets requires understanding the instruments, staying updated with global and domestic trends, employing technical and fundamental analysis, and practicing disciplined risk management.
Indian traders now have access to sophisticated platforms and instruments that enable both short-term speculation and long-term investment. Combining gold and cryptocurrencies strategically can help investors achieve a balance of security, growth, and speculative gains, ensuring a resilient and profitable portfolio in a rapidly evolving financial landscape.
