XRP Price Action – Accumulation Before GrowthXRP is currently navigating a phase defined by liquidity-driven swings and rapid sentiment shifts. After the market endured a heavy decline, buyers have re-emerged, showing resilience through aggressive rebounds. This behavior reflects a deeper pattern: sellers are losing efficiency in driving the market lower, while buyers are treating each dip as an opportunity to accumulate.
In the short term, the market appears to be balancing between two forces — the need for a corrective retracement to secure liquidity, and the desire of participants to push price into higher zones. This tug-of-war often results in shallow pullbacks, where temporary declines are quickly absorbed. Such behavior highlights that speculative capital is rotating back into XRP, aligning with broader risk-on sentiment across digital assets.
If this pattern holds, the near-term trajectory favors gradual expansion, with the asset likely aiming for higher valuations. However, investors should remain aware that short-term corrections are less about trend reversals and more about the mechanics of liquidity collection.
Cryptomarket

Bitcoin Under Pressure: Bearish Momentum BuildsBitcoin recently transitioned from a corrective decline into a consolidation phase, where price activity showed reduced volatility and market indecision. The breakout from this range has introduced renewed momentum, highlighted by strong bullish candles and a clear shift in trend dynamics. This move reflects fresh capital entering the market, suggesting growing investor confidence and positioning for potential continuation.
Despite this momentum, the structure also shows signs that rapid acceleration could invite short-term profit-taking, which may create phases of corrective retracement before the broader trend direction is reestablished. The market remains sensitive to global financial sentiment, liquidity cycles, and broader adoption narratives, meaning volatility should be expected even within an upward bias.
Overall, current conditions reflect a shift toward renewed optimism, with momentum favoring buyers while maintaining the likelihood of temporary corrections as part of a healthy market cycle.

Bitcoin – Let’s Play the Resistance Game at 114,500Bitcoin on the 1-hour chart has entered a critical resistance zone around 114,200–114,500. Price has rallied strongly from the recent lows near 113,000, but now faces a major supply area. The structure suggests that BTC could face rejection here and move back toward the support zone near 112,600 if sellers step in.
As long as price stays below 114,500, this resistance remains valid. A clean breakout above this level with strong momentum would invalidate the bearish view and open the path for higher levels. On the downside, holding support near 112,600 will be key for buyers to maintain control.
Disclaimer: This analysis is for educational purposes only and should not be taken as financial advice. Please do your own research or consult your financial advisor before investing.
Analysis By @TraderRahulPal (TradingView Moderator) | More analysis & educational content on my profile
👉 If you found this helpful, don’t forget to like and follow for regular updates.

Cryptocurrency : The New Normal & The World of Leverage Trading.📌 Cryptocurrency: The New Normal & The World of Leverage Trading ⚔️ ( A Sweet Killer! )
🌍 Why Are Traders Shifting to Crypto? COINBASE:BTCUSD BITSTAMP:ETHUSD COINBASE:SOLUSD
✔️ Lower capital required compared to stocks
✔️ Fewer gaps (24/7 market = no overnight gap-up/down shockers)
✔️ High leverage opportunities (control bigger trades with smaller margin)
✔️ Global accessibility (Binance, Bybit, OKX, CoinDCX, Mudrex etc.)
📊 Types of Trading in Crypto
💠 **Spot Trading** → In India, 30% tax on capital gains ( check according to your country ).
💠 **Options & Futures** → Taxed as *Business Income* ( like F&O in stocks ). No flat 30% rule.
⚡ What is Leverage?
👉 Leverage means using *small capital* to control a *large trade size* , because the exchange lends you money.
Think of it like **margin trading** in stocks — but much more aggressive.
🔹 Example 1 : Normal Trade style ( No Leverage )
suppose you have 💰 Capital = ₹10,000
Bought BTC at Price = ₹10,000,000
* You can buy 0.001 BTC ( 10000 ➗ 10,000,000 ).
* If BTC rises 10% → Profit = ₹1,000 (+10%)
* If BTC falls 10% → Loss = ₹1,000 (-10%)
👉 Risk & reward move in proportion to your capital.
🔹 Example 2 : Leverage Trade style ( 10x Leverage )
suppose you have 💰 Capital = ₹10,000
opted Leverage = 10x
New Trade Size ( margin ) = ₹1,00,000 ( you can now utilize this margin amount for trading )
* You can buy 0.01 BTC ( 10000 ➗ 10,000,000 ).
* If BTC rises 10% → Profit = ₹10,000 (+100% return)
* If BTC falls 10% → Loss = FULL ₹10,000 ( Liquidation 🚨 )
👉 A 10% move = your account will be blown.
🔹 Example 3:
suppose you have 💰 Capital = ₹10,000
opted Leverage = 50x (Extreme ⚠️)
New Trade Size ( margin ) = ₹5,00,000 ( you can now utilize this margin amount for trading )
* You can buy 0.05 BTC ( 50000 ➗ 10,000,000 ).
* If BTC rises just 2% → Profit = ₹10,000 (+100% return)
* If BTC falls just 2% → FULL ₹10,000 loss ( Liquidation 🚨 )
* If BTC rises just 10% → Profit = ₹50,000 (+500% return)
* If BTC falls just 10% → FULL ₹10,000 loss ( Liquidation 🚨 )
👉 Tiny moves in high volatile asset class = jackpot or wipeout/blown.
⚔️ Key Takeaways :
1️⃣ Leverage multiplies profits 💸 but also multiplies losses too💀 ( a sweet killer! )
2️⃣ Crypto is *highly volatile* (10–20% daily moves are common) → High leverage is extremely risky, if not managed well.
3️⃣ Beginners should **never use more than 2x–3x leverage**
👉 In simple words: **Leverage is a double-edged sword ⚔️**
Used wisely → You’re a king 👑
Used recklessly → You’re broke 🥀
🚘 Liquidation Explained ( ex: Car Analogy )
Imagine you pay ₹10,000 to rent a car worth ₹1,00,000. (That’s 10x leverage).
* The car is in your hands, but ₹90,000 still belongs to the owner of car (exchange).
* If the damage goes beyond your ₹10,000 margin → the owner takes back the car immediately.
👉 That’s liquidation: when your loss = your margin.
🔹 Case 1: Normal Trade style ( No Leverage )
Margin = ₹10,000 → Buy BTC.
If BTC drops 10% → Loss = ₹1,000.
You still have ₹9,000 left.
✅ No liquidation. Just a normal loss.
🔹 Case 2: 10x Leverage Trade style
Margin = ₹10,000
New Trade Size ( margin ) = ₹1,00,000
* BTC rises 10% → Profit = ₹10,000 (+100%)
* BTC falls 10% → Margin wiped = Liquidation 🚨
🔹 Case 3: 20x Leverage Trade style
Margin = ₹10,000
New Trade Size = ₹2,00,000 ( margin )
* BTC rises 5% → Profit = ₹10,000 (+100% return)
* BTC falls 5% → Margin wiped = Liquidation 🚨
👉 Just 5% against you = Account gone.
🔹 Case 4: 50x Leverage Trade style (High-Risk Zone ⚠️)
Margin = ₹10,000
New Trade Size = ₹5,00,000 ( margin )
* BTC rises 2% → Profit = ₹10,000 (+100% return)
* BTC falls 2% → FULL ₹10,000 loss = Liquidation 🚨
👉 Just 2% against you = Blown account = Game over.
🎯 Final Word
Leverage = Power ⚡
But in crypto’s volatile world, it’s also a **trap for the impatient**.
* Smart traders use small leverage.
* Impulsive traders burn out with high leverage.
💬 Question for you: What’s the **highest leverage** you’ve ever used in a trade? Drop it below 👇 (Be honest—we’ve all been tempted!)
If this Idea gave you a value information then please, Boost it, share your thoughts in comments, and follow for more practical trading!
Happy Trading & Investing!
@TradeWithKeshhav and team

BTC Neowave UpdateBTC Intraday Update
Our entry 1 is activated yesterday, so maintain that with stoploss
2nd entry will be created when.....s1 will complete by breaking up of black cycles
Short Term Trend
Learn More about trend here

CRYPTO ALERT: SOLANA SHORT TERM BEARISH TREND IN 4H CHARTSOLANA, one of the most traded crypto after BTC and ETH is in a short term bearish trend on the 4H chart. It has multiple demand zones and unmitigated order blocks pending for execution before any further upward movement.
SOLUSD can be shorted at CMP 236 with Stop Loss at 244 for short term targets of 224 - 218 - 200 in a period of 2-3 weeks.
📉 THIS CHANNEL IS ONLY FOR EDUCATIONAL PURPOSES.
Disclaimer: I am Not a SEBI registered analyst. I just share my positions to do paper trading and no where its a recommendation! Please do your own analysis before taking any trade.

BTC/USDT Outlook – Volatility Rises After Sharp DeclineBTC/USDT Market Report
Bitcoin recently faced heavy selling pressure, pushing the market into a sharp decline. This drop reflects a shift in sentiment where earlier stability has been replaced by increased volatility and downside momentum.
Price action shows signs of exhaustion after the fall, suggesting the possibility of a short-term rebound attempt. However, broader behavior still reflects uncertainty, with buyers needing stronger participation to shift momentum back in their favor.
If downward pressure continues, deeper corrections could emerge before any meaningful recovery. In the near term, traders should expect sharp swings as the market tries to stabilize.

Solana (1H Chart) - Breakout-Retest Long TradeThis is a long trade setup for Solana perpetual futures based on a breakout and retest structure, placed on the 1-hour chart.
Trade Overview
• The chart shows price consolidating near a horizontal resistance zone (yellow line), followed by a breakout above this level and a subsequent retest.
• The entry is taken after confirmation of support at the breakout zone, aiming for a move toward the upper target.
Entry, Target, and Stop-Loss
• Entry: Around 226 USD, following a successful retest of the yellow breakout level.
• Target: 232 USD, marked in green at the upper end of the chart’s risk-reward box.
• Stop-Loss: 222 USD, just below the retest zone, minimizing risk if price reverses.
Trade Logic and Reasoning
• The trade capitalizes on a classic breakout-retest pattern, where price first breaks resistance and then tests it as new support.
• Increasing volume near the breakout supports bullish momentum.
• Risk management is prominent, with a clear stop-loss set below the retest area.
Risk/Reward Profile
This setup offers a favorable risk-to-reward ratio, as visualized by the green/red shaded box indicating potential gain versus loss for the position.
BTCUSD 1D Time frame📈 Price Action
Previous Close: $113,897.00
Day’s Range: $112,204.00 – $114,451.00
Current Price: $113,897.00
🔧 Technical Indicators
Relative Strength Index (14): 55.39 — Indicates neutral momentum.
MACD: Positive — Suggests upward trend.
Moving Averages:
5-day MA: $112,545.50
20-day MA: $112,519.63
50-day MA: $114,828.28
100-day MA: $109,519.30
200-day MA: $101,144.13
Stochastic Oscillator (14): 67.91% — Indicates bullish momentum.
Average True Range (ATR): $3,177.03 — Suggests moderate volatility.
Directional Movement Index (ADX): 10.23 — Indicates a weak trend.
📊 Support & Resistance Levels
Immediate Support: $112,000
Immediate Resistance: $115,000
🧠 Trend Analysis
Trend: Neutral to bullish
Momentum: Positive
Volatility: Moderate
Summary: Bitcoin is currently trading near $113,897, showing a neutral to bullish trend with positive momentum. The 50-day moving average is above the current price, indicating potential upward movement. Traders should monitor the support level at $112,000 and resistance at $115,000 for potential breakout opportunities.

NIFTY 4H Time frame📊 Current Snapshot
Current Price: ₹25,010.95
Day’s Range: ₹24,940.15 – ₹25,008.95
Previous Close: ₹24,977.95
Opening Price (4H): ₹24,940.15
Volume: Approximately 6.16 million shares
📈 Trend & Indicators
Trend: Neutral to mildly bullish; trading near 50-hour and 200-hour moving averages.
RSI (14): Neutral zone.
MACD: Positive → indicating mild bullish momentum.
Moving Averages: Short-term averages indicate neutral to slightly bullish outlook.
🔮 Outlook
Bullish Scenario: Break above ₹25,008.95 with strong volume could target ₹25,186.00.
Bearish Scenario: Drop below ₹24,940.00 may lead to further decline toward ₹24,871.10.
Neutral Scenario: Consolidation between ₹24,940.00 – ₹25,008.95; breakout needed for directional move.
📌 Key Factors to Watch
Economic Indicators: Interest rates, inflation, and RBI policy updates.
Sector Performance: Trends in the IT and financial sectors.
Global Cues: Global market trends, US indices, crude oil, and currency movements.
SENSEX 1D Time frame📊 Current Snapshot
Current Price: ₹81,475
Day’s Range: ₹81,235 – ₹81,644
52-Week Range: ₹71,425 – ₹85,978
Previous Close: ₹81,101
Opening Price: ₹81,504
Market Cap: Approx. ₹15.47 lakh crore
Volume: Moderate
🔑 Key Support & Resistance Levels
Immediate Support: ₹81,235
Next Support: ₹81,000
Immediate Resistance: ₹81,644
Next Resistance: ₹82,000
📈 Trend & Indicators
Trend: Neutral to mildly bullish; trading near 50-day and 200-day moving averages.
RSI (14): 60 – Neutral zone.
MACD: Positive → indicating mild bullish momentum.
Moving Averages: Short-term MAs indicate neutral to slightly bullish outlook.
🔮 Outlook
Bullish Scenario: Break above ₹81,644 with strong volume could target ₹82,000.
Bearish Scenario: Drop below ₹81,235 may lead to further decline toward ₹81,000.
Neutral Scenario: Consolidation between ₹81,235 – ₹81,644; breakout needed for directional move.
📌 Key Factors to Watch
Market Sentiment: Overall market trend and investor behavior.
Economic Indicators: Interest rates, inflation, and RBI policy updates.
Global Cues: Global market trends, US indices, crude oil, and currency movements.

BANKNIFTY 1D Time frame📊 Current Snapshot
Current Price: ₹54,536.00
Day’s Range: ₹54,400 – ₹54,705
52-Week Range: ₹47,702.90 – ₹57,628.40
Previous Close: ₹54,216.10
Opening Price: ₹54,554.75
Market Cap: Approx. ₹3.78 lakh crore
Volume: ~77,647 contracts
📈 Trend & Indicators
Trend: Neutral to mildly bullish; trading near 50-day and 200-day moving averages.
RSI (14): 60 – Neutral; no immediate overbought or oversold conditions.
MACD: Positive → indicates bullish momentum.
Moving Averages: Short-term moving averages suggest neutral to slightly bullish outlook.
🔮 Outlook
Bullish Scenario: Break above ₹54,705 with strong volume could target ₹55,000.
Bearish Scenario: Drop below ₹54,400 may lead to further decline toward ₹54,000.
Neutral Scenario: Consolidation between ₹54,400 – ₹54,705; breakout needed for directional move.
📌 Key Factors to Watch
Banking Sector Performance: As BANKNIFTY comprises major banking stocks, sector-specific developments can influence index movement.
Economic Indicators: Changes in interest rates or inflation can impact index performance.
Global Cues: Developments in global markets can affect investor sentiment.
AVAXUSD Good Long @23.4-23 rangeAVAXUSD made a good base around 23 level. It acted as a Strong support from past falls. Now again when some correction happening we will go long on AVAXUSD from 23 range.
Entry - 23.4-23 (Accumulation zone)
Target - 24.3,25,29
SL - 21

ZIG Getting Ready For The Blast!ZIG coin has proven extreme resilience since its launch and with its new partnership announcement with APEX Global Group, which is one of the largest asset management firms with over $3.4 Trillion USD, this beast is just getting started.
Buying a decent bag here for 1 to 2 years hold.
ENJOY and dont forget to thank me later.
Solana Breakout: Ready for Bull Rally After Key Resistance FlipSolana (SOL) has decisively broken out above key resistance in September 2025, signaling strong bullish momentum as traders eye new targets.
Technical Setup and Breakdown:
Solana (SOL) has decisively broken out above the key resistance zone of $200–$210, a level that capped price gains for months. This breakout is validated by a significant surge in trading volume, signaling strong market conviction behind the move. The previous resistance now flips to support, setting a solid foundation for the next leg of the rally toward $250.
What’s Next? Scenarios and Targets:
The breakout sets the stage for two primary scenarios:
1. Bullish Continuation: If price holds above $210 and builds momentum, Solana could quickly revisit $244–$250 and higher, especially if the crypto market remains positive. Some projections for 2025 suggest targets as high as $350, though immediate monthly resistance sits closer to $250.
2. Pullback Risk: If price fails to sustain above new support, a retest of the Support zone near $205–$210 is possible, providing a key reaction zone for traders.
Final Take:
This chart offers traders a textbook example of a confirmed breakout with actionable price levels and volume confirmation. It provides a structured roadmap for both breakout traders and momentum investors focused on Solana’s bullish momentum.

Bitcoin – Current Trend UpdateBitcoin – Current Trend Update
Hello Traders,
Bitcoin continues to follow the structure of an inverse head-and-shoulders pattern, which has not yet been invalidated. After testing the 113.5k zone, price once again reacted lower – this marks the third rejection at this level, confirming it as a key resistance area. For BTC to sustain its bullish momentum and complete the final wave of the formation, this zone will be crucial.
Scenarios to Watch
Bullish Case: The uptrend remains intact as long as price holds above 109k. In this case, buying opportunities are still valid.
Bearish Case: A sustained close below 109k would invalidate the bullish outlook and activate a bearish scenario. Traders should wait for confirmation before committing to shorts.
Short-Term View
On the lower timeframes, BTC is moving within a sideways range. For intraday traders, range strategies such as buying near support and selling near resistance can still be applied until a clear breakout occurs.
Market Sentiment
At the moment, most of the market’s attention is shifting towards gold, leaving Bitcoin with relatively lower momentum. This may keep BTC trading in a tighter range, so traders should lower expectations for strong volatility in the immediate term.
This is my trading outlook for today. Use it as a reference and feel free to share your own perspectives in the comments.

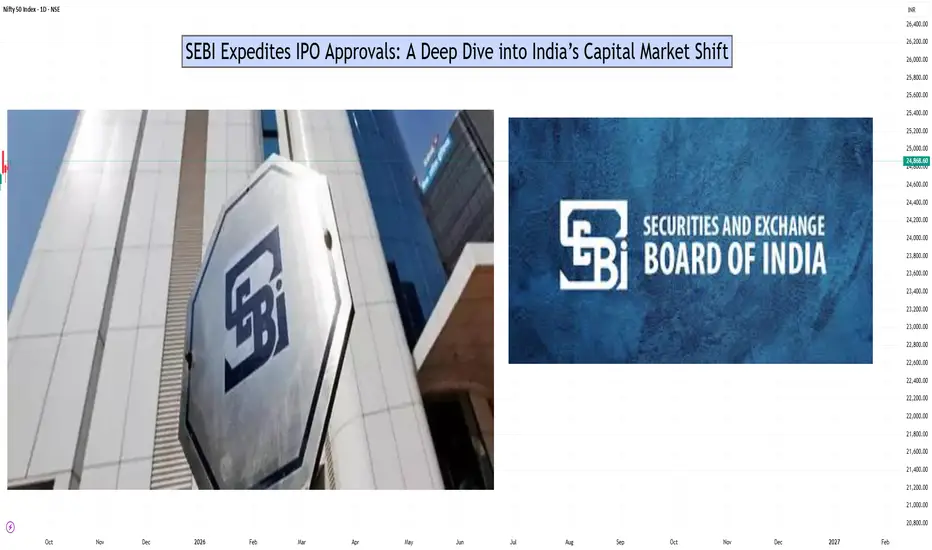
SEBI Expedites IPO Approvals: A Deep Dive into India’s Capital SEBI Expedites IPO Approvals: A Deep Dive into India’s Capital Market Shift
1. Introduction
The Securities and Exchange Board of India (SEBI) has recently undertaken a significant step—fast-tracking Initial Public Offering (IPO) approvals. Traditionally, IPO approval in India has been a lengthy process, often stretching to six months. But SEBI’s new measures aim to cut this time nearly in half, potentially bringing it down to three months or less.
This shift comes at a time when India’s equity markets are booming, with record levels of fundraising expected in 2025. After raising around $20.5 billion through IPOs in 2024, analysts predict that 2025 could surpass this figure. According to reports, $8.2 billion has already been raised so far in 2025, with an additional $13 billion in IPOs already approved and nearly ₹18.7 billion pending approval.
2. Why SEBI is Expediting IPO Approvals
Several factors are driving SEBI to accelerate the IPO pipeline:
Surging Investor Appetite
Indian retail participation in stock markets has seen an explosion in recent years.
Over 11 crore Demat accounts are active as of 2025, compared to just 3.6 crore in 2019.
More retail investors mean more demand for IPOs, making faster approvals essential.
Global Capital Flows
India is seen as one of the fastest-growing large economies.
With global investors diversifying away from China, India is attracting billions in Foreign Portfolio Investments (FPIs).
A streamlined IPO process will help India capture this liquidity flow before it moves elsewhere.
Boosting Startup Ecosystem
Unicorns like PhysicsWallah, Urban Company, and WeWork India are preparing for listings.
Startups require quicker capital-raising routes to compete globally.
Regulatory Efficiency and AI Adoption
SEBI is now deploying AI-powered document screening tools to check IPO filings.
This reduces human delays and allows faster compliance checks.
Collaboration with merchant bankers and exchanges has also been strengthened.
Record Fundraising Target
SEBI expects India to break the $20B mark again in 2025, possibly setting an all-time record.
Expedited approvals are central to making this happen.
3. How the New Approval System Works
Traditionally, IPO approvals involved multiple manual steps:
Filing of Draft Red Herring Prospectus (DRHP).
SEBI reviews disclosures, company financials, risk factors, and governance.
Queries are raised with the company, leading to back-and-forth communication.
Final approval takes 4–6 months.
Now under the fast-track mechanism:
AI Pre-Screening: Automated checks scan filings for missing data, compliance issues, and inconsistencies.
Concurrent Review: Instead of sequential reviews, SEBI, merchant bankers, and exchanges review documents simultaneously.
Time-Bound Queries: Companies are given strict deadlines to respond to SEBI’s queries.
Standardization: Risk disclosure formats and governance checks are now standardized across sectors.
This is expected to cut approval timelines by 40–50%.
4. IPO Pipeline for 2025
Some big-ticket IPOs in the pipeline include:
PhysicsWallah (₹3,820 crore) – Edtech unicorn expanding into AI-driven education.
Urban Company – Already raised ₹854 crore from anchor investors; IPO opening soon.
LG Electronics India – Large consumer electronics brand targeting India’s growing tech-savvy population.
WeWork India – Despite global challenges, the Indian arm remains profitable and expansion-focused.
Credila Financial Services – Education loan subsidiary of HDFC, a high-demand financial segment.
The SME IPO market is equally hot with listings like Goel Construction debuting at a 15% premium and Prozeal Green Energy getting SEBI approval.
5. Benefits of Faster IPO Approvals
For Companies
Quicker access to capital for expansion.
Ability to capitalize on favorable market sentiment without delays.
Reduced costs of prolonged regulatory processes.
For Investors
More frequent and diverse IPO opportunities.
Increased transparency due to standardized disclosures.
Higher liquidity as more firms enter the public market.
For Indian Markets
Strengthened image of India as an investment hub.
Alignment with global best practices (US SEC and Hong Kong’s IPO process are faster).
Improved global competitiveness for Indian startups.
6. Risks and Challenges
Speed vs. Quality
Faster approvals must not compromise on due diligence.
Weak companies slipping through could hurt investor trust.
Market Saturation
Too many IPOs in a short span could lead to oversupply, reducing listing gains.
Retail Investor Overexposure
Retail investors may flock to IPOs without understanding fundamentals, increasing risk of losses.
Global Volatility
Geopolitical tensions, US interest rate decisions, or oil price shocks can derail IPO plans.
7. Global Context
Globally, IPO markets have been mixed:
US Markets: Tech IPOs are recovering but still face valuation pressure.
China: Tighter regulations have slowed down IPO fundraising.
Middle East: Saudi Arabia and UAE continue to see large IPOs in energy and infrastructure.
In this scenario, India is positioning itself as a global IPO leader, especially in the tech and services sector.
8. Investor Strategy for 2025 IPOs
For investors, the IPO rush creates both opportunities and challenges. Some strategies include:
Focus on Fundamentals
Look for companies with strong financials, governance, and growth potential.
Avoid IPOs driven purely by hype.
Anchor Investor Signals
Strong anchor participation (like Urban Company’s ₹854 Cr funding) signals institutional confidence.
Sector Plays
Edtech, Renewable Energy, Fintech, and Consumer Services are hot sectors.
Traditional sectors like construction and manufacturing are also showing resilience.
Listing Gains vs. Long-Term Holding
Some IPOs (like Goel Construction SME) deliver quick listing pops.
Larger IPOs (like PhysicsWallah, Urban Company) may be better for long-term growth.
9. Case Study: Urban Company IPO
Urban Company is a prime example of SEBI’s faster approval ecosystem.
Filed DRHP earlier in 2025.
Received SEBI approval within 12 weeks.
Raised ₹854 crore from anchors before IPO launch.
Price band set at the higher end, reflecting strong demand.
Market analysts project strong long-term growth given India’s rising demand for home services.
This showcases how SEBI’s new process benefits both issuers and investors.
10. Conclusion
SEBI’s decision to expedite IPO approvals is a game-changer for India’s financial markets. By cutting approval times, using AI-driven compliance, and standardizing processes, SEBI is creating a faster, more transparent, and investor-friendly IPO environment.
With major companies like PhysicsWallah, Urban Company, Neilsoft, and Prozeal entering the market, and regulatory support from SEBI, 2025 is poised to be a record-breaking year for IPO fundraising in India.
However, investors must balance enthusiasm with caution—choosing fundamentally strong IPOs, monitoring global market conditions, and avoiding blind bets driven by hype.
In essence, SEBI’s move reflects India’s ambition to emerge as a global capital-raising hub, connecting domestic growth stories with global capital at unprecedented speed and scale.
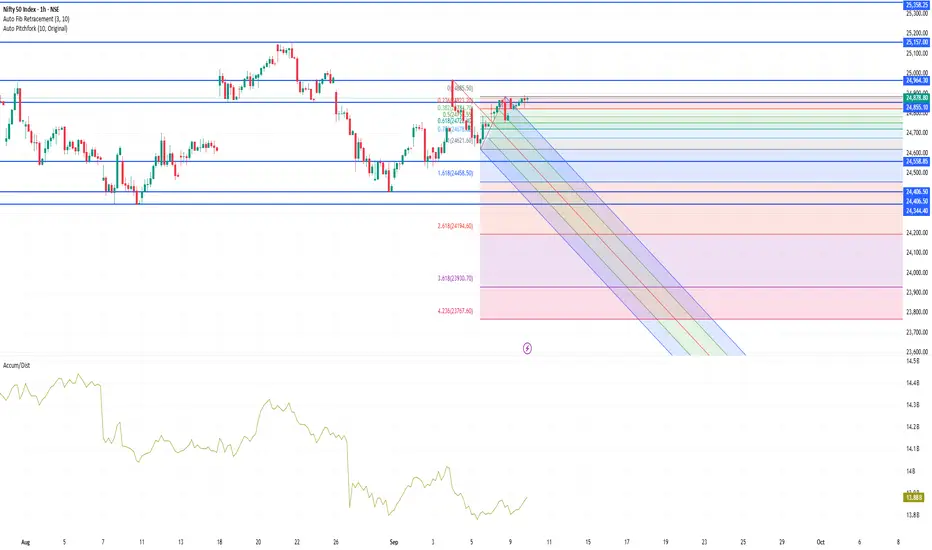
NIFTY50 index levelsKey Levels & Swing Trade Outlook (1-Hour Timeframe)
Resistance & Support (Broader Technical View)
Key Resistance Zones:
24,900–25,000 range (daily level)—a critical breakout area
Slightly higher potential if breakout occurs, toward 25,200+
Immediate Support Zones:
24,750–24,800 level
Broader range support at 24,620–24,700
More defensive base near 24,400 (longer-term)
Intraday Pivot Levels (Based on latest derived pivots)
From Moneycontrol, for the current trading session:
Classic Pivot R1: 24,855 | R2: 24,937 | R3: 24,989
Classic Pivot S1: 24,721 | S2: 24,669 | S3: 24,587
1-Hour Swing Trading Perspective
Although explicit 1-hour pivot data is not readily available, we can infer swing strategies using the broader technical context and typical indicators:
1-Hour Swing Fundamentals:
Use short-term moving averages (e.g., 20/50 EMA) to gauge trend direction. The index is trading above these on shorter timeframes, suggesting intraday bullish bias
Common indicators: RSI, Bollinger Bands, MACD, etc.

Bearish Trade Setup for SOLUSDOverview:
This is a short position on SOLUSD, entering on the 1-hour chart with a well-defined risk-to-reward ratio. The trade is based on a downward trend confirmed by the price action and EMAs, making this a high-probability bearish scenario.
Key Levels and Indicators:
Entry Point: 186.6736
The entry is triggered when the price moves below the resistance level. This confirms the continuation of the downtrend.
Stop Loss: 202.2042
The stop loss is set above the most recent swing high to protect from any sudden price reversals. This level is designed to avoid a whipsaw and ensures the trade is kept within a reasonable risk range.
Target: 155.5356
The target is calculated based on a projected price movement in line with the current trend. Given the current market structure, this target provides an optimal reward-to-risk ratio.
Why is this a Bearish Setup?
Trend Confirmation:
The price has been consistently moving lower, showing strong bearish momentum. The EMAs (9 and 20) are also sloping downwards, reinforcing the likelihood of further downside movement.
Price Action:
The recent price action has formed lower highs and lower lows, a key indication of a strong downtrend.
EMA Alignment:
The 9-period EMA (188.6387) is below the 20-period EMA (192.3233), a classic bearish crossover that confirms the downward bias of the market.
Risk-to-Reward Setup:
The trade offers an excellent risk-to-reward ratio of approximately 1:3, which ensures that potential profits outweigh the risk taken on the trade.
Trade Management:
Entry Criteria: Enter the position when the price breaks below the support zone, ideally near the entry point.
Exit Strategy: Target is set at 155.5356, but keep an eye on the price action in case a trend reversal occurs before hitting the target. Always adjust the stop loss to lock in profits as the price moves in your favor.
Final Thoughts:
This is a well-structured bearish trade idea based on both technical analysis and price action. Always ensure that you follow proper risk management rules and adjust your stop loss or take profit levels based on market conditions.

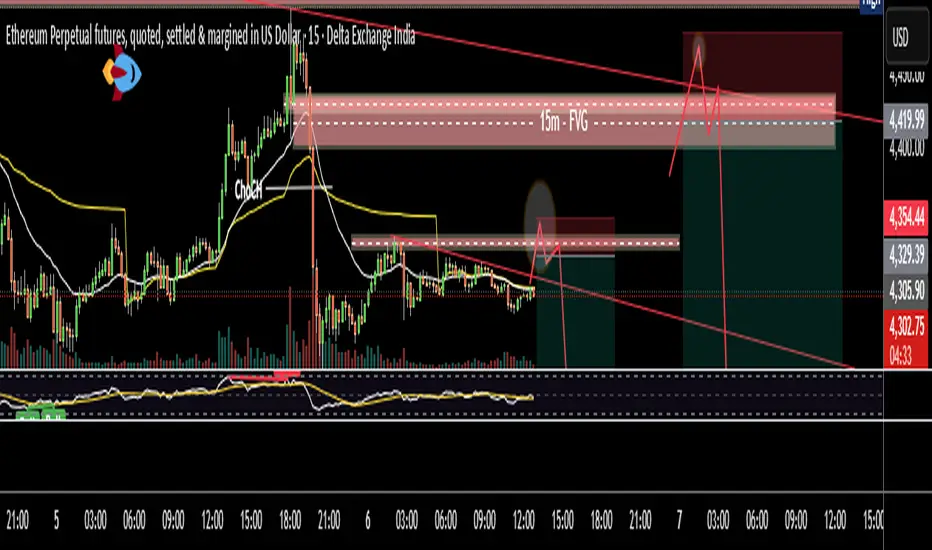
BTC developing a good sell opportunityBTC is moving in range for long time. Now it has shown a displacement after ChoCH and formed a bearish 15m FVG. There may be a good trade at sell side if price approach it. Well there are two trade scenarios are forming.
1. Price moves to 15m FVG and OTE overlap zone.
2. Most probably price will take liquidity of FVG and OTE zone and create MSS in LTF.
3. After breaking trend line it should pullback till FVG/trend line or any newly created OB/FVG.
All these combinations are signalling a high probability and high Risk and Reward (1:8) trade scenario.
Note – if you liked this analysis, please boost the idea so that other can also get benefit of it. Also follow me for notification for incoming ideas.
Also Feel free to comment if you have any input to share.
Disclaimer – This analysis is just for education purpose not any trading suggestion. Please take the trade at your own risk and with the discussion with your financial advisor.

ETH multiple Sell OpportunitiesETH is moving in range for almost a week time. Now it has shown a displacement after ChoCH and formed a bearish 15m FVG. There may be a good trade at sell side if price approach it. Well there are two trade scenarios are forming.
Trade # 1
1. Price is moving around a short term trend line and resistance.
2. If price breaks trend line and take the liquidity of resistance than it may be sell trade.
Trade # 2
3. Price moves to 15m FVG and OTE overlap zone.
4. Most probably price will take liquidity of FVG zone and break trend line.
5. After breaking trend line it should pullback till FVG/trend line or any newly created OB/FVG.
All these combinations are signaling a high probability and high Risk and Reward (1:8) trade scenario.
Note – if you liked this analysis, please boost the idea so that other can also get benefit of it. Also follow me for notification for incoming ideas.
Also Feel free to comment if you have any input to share.
Disclaimer – This analysis is just for education purpose not any trading suggestion. Please take the trade at your own risk and with the discussion with your financial advisor.
SOLUSD Short trade @205Overall Crypto market is under correction mode. After sharp fall SOLUSD showed some pullback @205 levels and that’s the best entry price to enter for a Short trade. Risk reward ratio is 1:2.5 in this trade.
Entry - 205
Target -198
SL - 207.80
