Introduction to Cryptocurrency and Digital AssetsBlockchain Technology: The Backbone
At the heart of cryptocurrencies is blockchain technology, a distributed ledger system that records all transactions across a network of computers. A blockchain consists of a chain of blocks, each containing transaction data, timestamp, and a cryptographic hash of the previous block. This design ensures:
Transparency: All transactions are visible to network participants.
Security: Cryptographic algorithms protect against fraud and unauthorized alterations.
Decentralization: No single entity controls the ledger, reducing the risk of manipulation.
Immutability: Once recorded, transactions cannot be changed or deleted.
Beyond just financial transactions, blockchain enables smart contracts—self-executing agreements coded into the blockchain—which expand the utility of digital assets into areas like decentralized finance (DeFi), supply chain management, and digital identity verification.
Types of Cryptocurrencies and Digital Assets
1. Cryptocurrencies:
Cryptocurrencies are digital currencies designed to work as a medium of exchange. They include:
Bitcoin (BTC): The first and most well-known cryptocurrency, used as a store of value and medium of exchange.
Ethereum (ETH): A platform cryptocurrency that enables smart contracts and decentralized applications (dApps).
Stablecoins: Cryptocurrencies pegged to fiat currencies like USD (e.g., USDT, USDC), designed to reduce volatility.
Altcoins: Alternative cryptocurrencies with varied purposes, such as Ripple (XRP) for cross-border payments or Cardano (ADA) for sustainable blockchain operations.
2. Digital Tokens:
These are blockchain-based units that can represent a variety of assets:
Utility Tokens: Provide access to a platform or service, like Binance Coin (BNB) for exchange fee reductions.
Security Tokens: Represent ownership of real-world assets such as shares, bonds, or real estate, regulated under securities laws.
Non-Fungible Tokens (NFTs): Unique tokens representing ownership of digital or physical items like art, music, or collectibles.
3. Tokenized Assets:
Blockchain allows real-world assets—stocks, real estate, commodities—to be converted into digital form, making them easier to trade, fractionalize, and secure.
Use Cases of Cryptocurrencies and Digital Assets
Financial Transactions and Remittances:
Cryptocurrencies enable peer-to-peer payments without intermediaries, reducing fees and transaction times for international transfers.
Decentralized Finance (DeFi):
DeFi platforms use smart contracts to offer banking services like lending, borrowing, and yield farming without traditional banks.
Digital Ownership and NFTs:
NFTs revolutionize digital ownership, allowing artists, gamers, and content creators to monetize their digital creations and maintain provable ownership.
Investment and Speculation:
Cryptocurrencies and digital assets are increasingly seen as investment vehicles, attracting both retail and institutional investors seeking diversification and high returns.
Cross-Border Payments and Financial Inclusion:
Cryptocurrencies provide access to financial systems for unbanked populations, offering secure and cost-effective cross-border transactions.
Supply Chain and Identity Verification:
Blockchain’s transparency ensures traceability of goods, anti-counterfeiting measures, and secure digital identities.
Advantages of Cryptocurrencies and Digital Assets
Decentralization reduces reliance on central banks and financial institutions.
Transparency and security make financial operations more trustworthy.
Efficiency in cross-border transactions and settlements.
Innovation potential with smart contracts and tokenization.
Financial inclusion, particularly in regions with limited access to banking.
Challenges and Risks
Despite their promise, cryptocurrencies and digital assets face significant challenges:
Volatility: Prices can fluctuate wildly, making them risky for investors and unstable as currencies.
Regulatory Uncertainty: Governments vary in their approach to regulation, ranging from outright bans to active adoption.
Security Concerns: Hacks, scams, and loss of private keys pose risks to users.
Scalability Issues: Popular networks like Ethereum have faced congestion and high transaction fees.
Environmental Impact: Proof-of-work-based cryptocurrencies, such as Bitcoin, consume enormous amounts of energy.
Adoption Barriers: Limited understanding, technological literacy, and infrastructure issues slow mainstream adoption.
Regulation and Legal Landscape
Governments worldwide are exploring how to regulate cryptocurrencies and digital assets to prevent fraud, money laundering, and market manipulation while enabling innovation. Regulatory approaches include:
Licensing cryptocurrency exchanges.
Taxation on transactions and holdings.
Oversight of stablecoins and digital banking platforms.
Creating central bank digital currencies (CBDCs) as regulated alternatives.
Countries like Japan and Switzerland have embraced crypto-friendly regulations, whereas others like China have restricted trading and mining activities.
Future of Cryptocurrencies and Digital Assets
The future of digital assets is promising but uncertain. Key trends include:
Integration with traditional finance: Banks and financial institutions are increasingly exploring crypto custody, trading, and payment systems.
Expansion of DeFi: More financial services may migrate to decentralized networks.
Tokenization of assets: Ownership of real-world assets will become more flexible, liquid, and transparent.
CBDCs and hybrid models: Central banks are exploring digital currencies that combine regulation with blockchain efficiency.
Greater mainstream adoption: Merchants, consumers, and enterprises may increasingly accept cryptocurrencies for payments and investments.
The evolution of cryptocurrency and digital assets could redefine how value is stored, transferred, and created globally, challenging traditional financial systems while opening new opportunities for innovation, inclusion, and efficiency.
Conclusion
Cryptocurrencies and digital assets represent a revolutionary shift in the way people perceive and interact with money, ownership, and digital ecosystems. While they bring enormous opportunities for financial innovation, inclusion, and efficiency, they also carry inherent risks related to volatility, security, and regulation. The continued development of blockchain technology, smart contracts, tokenization, and decentralized finance is likely to shape the future of global finance, making it more transparent, accessible, and efficient. As adoption grows, understanding the fundamentals, potential, and pitfalls of cryptocurrencies and digital assets is essential for investors, policymakers, and the general public alike.
Cryptonews
Crypto Trading Guide1. Understanding Crypto Trading
Crypto trading involves buying and selling digital assets such as Bitcoin (BTC), Ethereum (ETH), and thousands of altcoins with the goal of earning profits. Traders analyze price movements, market sentiment, liquidity, and technical indicators to make buy or sell decisions.
Unlike stock markets, crypto exchanges are decentralized and global. This means prices can fluctuate rapidly based on fundamentals, macroeconomic factors, regulatory developments, or even social media trends. Knowing how these factors affect token value is the first step toward successful trading.
2. Types of Crypto Trading
There are several popular trading styles, each suited for different personality types and risk appetites.
a) Day Trading
Day traders enter and exit positions within a single day. They rely on short-term price movements, chart patterns, and volume spikes. This style requires high attention, quick decision-making, and consistent strategy execution.
b) Swing Trading
Swing traders hold assets for days or weeks. They aim to capture price “swings” driven by broader trends. This style offers a balance—less stress than day trading yet more opportunities than long-term investing.
c) Scalping
Scalpers make numerous small trades throughout the day, profiting from minor price differences. It demands precision, discipline, and fast execution.
d) Position Trading
Position traders take long-term positions based on macro trends, technological developments, or fundamental analysis. They are less affected by short-term volatility.
e) Automated or Algorithmic Trading
Bots execute trades automatically based on predefined rules. This reduces emotional bias and allows 24/7 trading. However, setup and strategy optimization require knowledge and testing.
3. Choosing the Right Crypto Exchange
Selecting a reliable exchange is vital for safety and smooth trading. Compare platforms based on:
Security features (2FA, cold storage, proof of reserves)
Trading fees (maker/taker charges)
Liquidity (higher liquidity ensures smoother trades)
Supported crypto pairs (BTC/USDT, ETH/USDT, etc.)
User interface and tools
Customer support quality
Global exchanges include Binance, Kraken, and Coinbase, while several regional exchanges also offer local currency support.
4. Building a Trading Plan
A trading plan acts as your roadmap. It should answer:
Which coins will you trade?
What is your entry strategy?
What is your exit strategy?
How much capital will you risk per trade?
What indicators will you use?
How will you control emotions?
A strong trading plan prevents impulsive decisions and keeps you aligned with your long-term goals.
5. Fundamental Analysis (FA)
Fundamental analysis evaluates a crypto asset’s underlying value. Unlike stocks, cryptocurrencies don't have earnings or balance sheets. Instead, traders rely on:
Project whitepaper
Technology and blockchain model
Token utility and real use cases
Team and advisors
Partnerships and community size
Supply metrics (circulating and max supply)
Roadmap progress
Market sentiment (news, social media trends)
Strong fundamentals help identify long-term winners.
6. Technical Analysis (TA)
Technical analysis uses chart data to predict price movements. Common tools include:
a) Candlestick Patterns
Doji, engulfing, hammer, shooting star—these show buying or selling strength.
b) Support and Resistance
Support acts as a floor for prices; resistance acts as a ceiling.
c) Moving Averages (MA)
Popular trends include:
50-day MA
100-day MA
200-day MA
Bullish when price stays above key MAs.
d) RSI (Relative Strength Index)
Indicates overbought (70+) or oversold (30-) conditions.
e) MACD (Moving Average Convergence Divergence)
Shows momentum and potential trend reversals.
f) Volume Analysis
A price move with strong volume is more reliable than one with low volume.
A combination of these indicators gives clearer trading signals.
7. Risk Management
Crypto’s volatility can wipe out profits quickly if risk is not controlled. Effective risk management includes:
a) Position Sizing
Never allocate your entire portfolio to one coin. Use fractional position sizes (1–5% per trade).
b) Stop-Loss Orders
Automatically exit losing trades before losses escalate.
c) Take-Profit Levels
Lock in profits instead of waiting for unsustainable peaks.
d) Avoid Over-Leveraging
Futures trading may amplify gains, but also magnifies losses. Beginners should avoid high leverage.
e) Diversification
Hold a mix of large caps (BTC, ETH), mid-caps, and small caps to balance risk.
f) Keep Emotions in Check
Fear and greed are the biggest threats. A calm, rule-based approach wins long term.
8. Psychology of Crypto Trading
Market psychology plays a major role in crypto. Traders should understand:
Fear of Missing Out (FOMO)
Chasing pumps leads to buying at peaks.
Fear, Uncertainty, and Doubt (FUD)
Negative news often triggers panic selling—even when fundamentals remain strong.
Overconfidence
Winning streaks can cause reckless decisions. Stick to your plan.
Patience and Discipline
Waiting for perfect setups is key. Avoid forcing trades.
A successful trader masters both the charts and their mindset.
9. Common Crypto Trading Mistakes
Avoid the pitfalls that trap many beginners:
Trading without a plan
Using high leverage early
Investing money you cannot afford to lose
Blindly following social media influencers
Ignoring security practices
Overtrading
Not keeping trading journals
Holding losing positions out of hope
Learn from mistakes and review trades regularly.
10. Securing Your Crypto
Security should always be a top priority. Follow best practices:
Use hardware wallets for long-term storage
Enable 2FA authentication
Keep strong, unique passwords
Avoid trading on public Wi-Fi
Beware of phishing and fake websites
Backup seed phrases offline
A secure setup ensures your profits remain yours.
Conclusion
Crypto trading offers enormous potential, but success depends on knowledge, discipline, and strategic execution. By understanding trading styles, applying both fundamental and technical analysis, managing risk effectively, and controlling emotions, you can navigate the volatility of crypto markets with confidence. The key is to start slow, stay consistent, and treat trading as a long-term skill-building journey. With the right approach, crypto trading becomes not just profitable but also an enriching experience in the rapidly evolving world of digital finance.

Warning: $ETH Is About to Hit Its Most Critical Zone of 2025!Warning: CRYPTOCAP:ETH Is About to Hit Its Most Critical Zone of 2025!
Macro Structure
ETH remains macro bullish, currently in a healthy correction after rejecting the premium zone near $4,960.
The strong displacement from $1,577 (0.618 Fib) confirmed bullish structure, but price is now retracing into discount levels.
Key Fibonacci Levels
Measured from $879 → $4,960, ETH is deeply entering ICT discount territory:
0.382 – $3,048 (Tested)
0.500 – $2,622
0.618 – $2,256 ← Top probability zone
0.786 – $1,821
FVG & OB Zones (Major Decision Area)
1️⃣ Unfilled FVG → $2,875
👉 This is the most important decision point right now.
👉 High probability that ETH will fill this FVG.
👉 If price holds above this FVG, bullish continuation becomes very strong.
👉 If ETH fails to hold $2,875, expect the correction to deepen.
2️⃣ Next Major Support
Bullish OB: $2,622 – $2,256
→ Perfect confluence of Order Block + 0.5/0.618 Fib.
👉 This is the strongest demand zone on the entire chart and a top accumulation area.
Expectations
Most likely:
ETH fills the $2,875 FVG, then either bounces → resumes uptrend
or
breaks down → moves into $2,250–$2,620 OB to accumulate before the next macro leg.
Targets After Correction: $4,058 / $4,960 / $5,800 / $7,200 (1.618 extension)
Conclusion
ETH remains strongly bullish on HTF.
Watch $2,875 FVG as the key decision level.
If lost → $2,250–$2,620 OB becomes the premium accumulation zone before ETH heads toward new ATH.
NFA. DYOR.

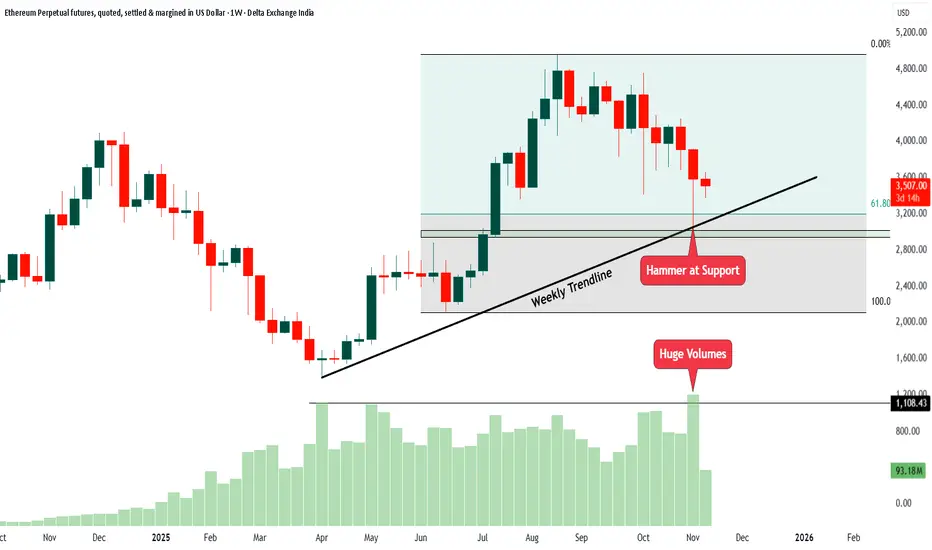
ETH Weekly Chart Analysis1. The price has been respecting a weekly trendline for many months. This trendline acts like a support line where buyers usually come in.
2. Recently, the price fell towards this same trendline and created a hammer candle. A hammer at support often shows that sellers pushed the price down, but buyers stepped in strongly and pulled it back up. This is usually a sign of buying interest.
3. The hammer candle formed exactly near the support zone and the Fibonacci 61.8 percent area. This area often works as a strong reversal point.
4. When the hammer candle formed, the volume was very high. Huge volume at support means big players were actively buying at lower levels.
5. The price is still inside a wide range between recent highs and lows. It has not broken out yet, but the support reaction is positive.
In simple words, the chart is showing a strong bounce setup from support with a hammer candle and high volume. This is a sign that buyers may try to take control again as long as the price stays above the trendline and support area.
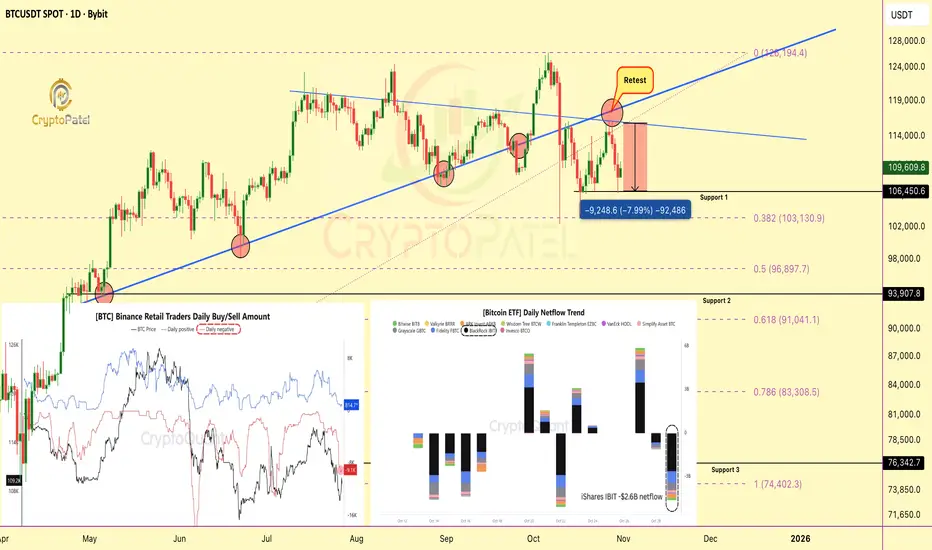
Retail Panic Meets ETF Outflows: $1B Bitcoin Sell-Off Hits MarkeRetail Panic Meets ETF Outflows: $1B Bitcoin Sell-Off Hits Markets
Bitcoin saw renewed selling pressure on Oct 30, as Binance retail traders dumped over 9,200 BTC (~$1B) around $107.7K, just days after another 12,000 BTC sell wave near $108.3K.
Technical View:
Retail traders are aggressively selling into weakness, while long-term holders remain largely inactive.
Historically, these sharp sell-offs from short-term players often form local bottoms, liquidity events where smart money quietly accumulates.
Fundamental Side:
Spot Bitcoin ETFs added more weight to the downside:
🔹 BlackRock: -$2.6B
🔹 Fidelity: -$790M
🔹 Grayscale: -$500M
These ETF outflows likely shifted capital to spot exchanges, amplifying short-term selling pressure.
Key Insight:
▶️ Retail capitulation + ETF outflows = short-term volatility
▶️ But remember, markets often bottom when retail panic peaks.
Note: NFA & DYOR
Bitcoin Under Pressure: Bearish Momentum BuildsBitcoin recently transitioned from a corrective decline into a consolidation phase, where price activity showed reduced volatility and market indecision. The breakout from this range has introduced renewed momentum, highlighted by strong bullish candles and a clear shift in trend dynamics. This move reflects fresh capital entering the market, suggesting growing investor confidence and positioning for potential continuation.
Despite this momentum, the structure also shows signs that rapid acceleration could invite short-term profit-taking, which may create phases of corrective retracement before the broader trend direction is reestablished. The market remains sensitive to global financial sentiment, liquidity cycles, and broader adoption narratives, meaning volatility should be expected even within an upward bias.
Overall, current conditions reflect a shift toward renewed optimism, with momentum favoring buyers while maintaining the likelihood of temporary corrections as part of a healthy market cycle.

From $1.38 to $0.50 Overnight – What Happened to $WCT?#WalletConnect Token ( NASDAQ:WCT ) just dropped from $1.38 to $0.50 in just 24 HOURS! 😳
From pumping hard to dumping even harder — here’s the REAL reason 👇
🔹 Early investors took profits after a huge 7x pump
🔹 Whales started booking profits
🔹 Panic selling hit hard — $500M+ traded on Upbit alone!
🔹 No new updates to support the hype
🔹 Futures trading went wild — $3.4B volume & extreme shorting
🔹 Chart broke major support – downtrend confirmed
$0.50 = Make or Break Level
If $0.50 holds 👉 bounce is possible
If it breaks 👉 we could see a deeper drop to $0.20
Fundamentals are still strong (Binance, Solana, Optimism, Airdrops),
But the hype ran faster than the project. Now the market is correcting.
⚠️ Don’t FOMO. Watch the key support. Trade smart.

BTC Bull Run Ending Soon?"September could mark the climax of Bitcoin’s bull rally, triggering a correction phase as smart money begins profit-taking — key levels like $74,457 and $48,888 may become attractive accumulation zones in the upcoming bear market."
Disclaimer : This content is for informational and educational purposes only and should not be considered financial or investment advice. Cryptocurrency trading involves significant risk and may not be suitable for all investors. Always do your own research (DYOR) and consult with a qualified financial advisor before making any trading decisions.

Bitcoin At Big Resistance level so What Next?#BTC/USDT Update – Price at Critical Resistance
The chart structure remains unchanged from our previous update.
🔸 After entry, price dipped ~5% below our zone, but has now printed a strong bullish candle, signaling potential upside momentum.
🔸 However, Bitcoin is currently trading at the upper boundary of the ascending channel, acting as resistance.
Key Level to Watch:
If the HTF candle closes above $99,500, it will signal strength, and I’ll consider closing short positions and initiating fresh long setups.
Important Note:
The current pattern resembles a liquidity trap, not a clean bullish continuation. That’s why I remain cautious.
✅ Plan:
🔸 Wait for confirmation > $99,500
🔸 Use tight stop-loss – no blind trades.
Stay sharp, monitor price action closely.

Bitcoin OutLook for Next Week BTCUSDT.pMarket Outlook (BTC/USD):
I’m currently observing the ₹94,125 level on the daily timeframe. A daily candle close below this level would significantly increase the probability of Bitcoin retracing toward the imbalance zone around ₹90,000.
However, there is a key demand zone near ₹86,000, which could act as a strong support and potentially push the market back upward. This area will be crucial in determining whether the bearish momentum continues or a reversal is triggered.
Let’s see how the market reacts around the ₹94,125 level. I’ll post the next update after Monday’s daily candle closes.
Thank you for your continued support — it's truly appreciated.
BTC 97800, Red Balloon Area, Buy Above this onlySince 24 hours after breakout of 95700 zone BTC is struggling to get more attraction and halted near 97800 for a time being where weekly chart is showing higher high candles but in daily chart last 24 hours red candle is obstructing the further uprally for time being, some shorts has been built near 97800, and fresh longs only once these liquidity is squeezed else will watch this BTC Ping Pong show, downside 95000 is crucial support bed, any breach of either zone will decide the fate for next week.
Happy Trading and Investing
~10x Bulls
Courtesy: 10x Bulls (An educational platform for investors and traders to find the best investment decisions, faculty trained by ex-fund managers, such as JP Morgan Chase and Goldman Sachs)
Classic Forecast:
COINBASE:BTCUSD
$15000 to $100000 in 2021 completed in 2024.

BITCOIN , BTCUSD
Bitcoin is currently finding support at the trend-line. Let's see whether it moves up from this support or breaks down. We should wait for the candle close this week for a clearer indication.
The stock market is unpredictable and can be influenced by large players. In recent years, we've seen significant struggles, like the COVID-19 pandemic and the Russia-Ukraine war, along with political events like Trump's actions. Although the market tends to recover quickly after crashes, it can also drop suddenly, as Newton's law suggests: what goes up fast can come down fast.
After the pandemic, many people wanted to invest in stocks, which attracted big investors and social media influencers promoting specific stocks that they wanted to sell. Many investors believe it's always good to buy the dip, but how much you invest matters. It's wise not to put all your money into the market; instead, diversify your investments across at least three different areas.
Don’t invest blindly just because the market is down. Additionally, governments often regulate the stock market in ways that benefit large investors while imposing higher taxes on ordinary people. I don’t blame the wealthy or those in power, as they were once normal people too; it's how we change with more money that can lead to different behaviors.

BTCUSD Buy setup Bitcoin (BTC) - A Brief Description
Bitcoin (BTC) is the world's first and most widely recognized cryptocurrency. It was created in 2009 by an anonymous person or group known as Satoshi Nakamoto. Bitcoin operates on a decentralized, peer-to-peer network using blockchain technology, which ensures transparency, security, and immutability of transactions.
Unlike traditional currencies issued by governments (fiat money), Bitcoin is not controlled by any central authority such as banks or governments. Instead, it is maintained by a distributed network of computers (nodes) through a process called mining, where transactions are verified and recorded on the blockchain.
Key Features of Bitcoin:
1. Decentralization – No single entity controls Bitcoin.
2. Limited Supply – Only 21 million BTC will ever exist, making it scarce.
3. Security – Uses cryptographic techniques to ensure safe transactions.
4. Transparency – Transactions are recorded on a public ledger (blockchain).
5. Fast and Borderless Transactions – Can be sent anywhere in the world without intermediaries.
6. Store of Value – Often referred to as "digital gold" due to its potential as a hedge against inflation.
Bitcoin is widely used for investment, trading, and online payments, and it has influenced the creation of thousands of other cryptocurrencies.

Standard Glass Lining#SGLTL Standard Glass Lining looks bullish for a reversal
Entry can be above 182
Target is 200
Buy on dips till 164
the price-to-earnings (P/E) ratio for Standard Glass Lining Technology Ltd (SGLTL) was 55.85. This is higher than the peer average of 40.3x.
Additional information about SGLTL
The face value of SGLTL is ₹10.
The earnings per share (EPS) for SGLTL is ₹2.93.
The market cap of SGLTL is ₹3,264 Cr.
The 52-week low for SGLTL is ₹153.70.
The 52-week high for SGLTL is ₹213.80.
The beta for SGLTL is 0.75.
The dividend yield for SGLTL is 0.00%.
The price-to-book ratio for SGLTL is 4.80.

Bitcoin will reach at $78K BTCUSD is looking for short opportunity aft making 100K will expect a short term correction to make a movement to the downside

SOL Eyes 40% Surge: Strong Technical PatternsKey Observations:
1. All-Time High (ATH): Marked at 259.59, indicating a significant resistance level.
2. Bullish Patterns Identified:
• Higher High (HH) and Higher Low (HL) Structure:
• This indicates a bullish market structure where price is making consistent higher highs and higher lows.
• Fair Value Gap (FVG):
• An imbalance or inefficiency in the price that could act as a magnet for price to revisit before continuation.
• Bullish Triangle Pattern:
• Suggests price consolidation within narrowing ranges, typically preceding a breakout to the upside.
3. Support Zone:
• A green box around the 175–180 region shows a strong demand zone where price could reverse upward if retested.
Projection:
• A breakout is expected either towards the resistance zone (near ATH) or lower if the support fails.
Actionable Steps:
• For Bulls:
• Watch for bullish confirmation (e.g., bullish engulfing candles) near the FVG/support zone.
• Target the ATH as the first major resistance, with a potential breakout higher.
• For Bears:
• Monitor price action for a break below 175. This could signal bearish momentum towards lower price targets.
DISCLAIMER- THIS IS FOR EDUCATIONAL PURPOSES ONLY, PLEASE DO YOUR RESEARCH BEFORE INVESTING

Bitcoin Analysis (30 Minutes Time Frame)This article analyzes potential future price movements for Bitcoin. My analysis indicates that a breach of the $94,000 support level would likely trigger a downward trend, with the next support zone anticipated at $92,500.

$MONG USDT$MONG USDT LOOKING VERY JUICY EASY 1000X into the horizon consolidation end nearing ....soon MOON mission on $MONG

Excellent Setup , Short/Sell TAOHH Formation is formed on 1HR TF.
Can go with small SL to Short/Sell TAO.
Can go below 575. Plan your risk accordingly.
This is not a Buy/Sell Recommendation. Pls DYOR Always.

TAO/USDT Ready to fly toward $1000 ?TAO/USDT Chart Analysis
GETTEX:TAO is 68% down from ATH in 3 months but up 750% in a year, giving 26x returns from the bottom!
- May 7, 2023: $29
- Current: $236
- ATH: $777
Analysis:
- Bounced from bullish OB1, targeting $350-$400.
- Breaking the red box bearish OB could lead to $1000.
- Falling below $200 support may drop to OB2 ($130-$150) – best entry zone.
#Altcoins #bittensor

FTX Sells $230M in Solana Tokens Amid Recovery EffortsSOLANA Urgent Update: FTX Sells $230M in Solana Tokens Amid Recovery Efforts
➡️ SOL Sale Details:
▪️Amount Sold: 1.8 million #Solana tokens
▪️Buyers: Galaxy Trading and Pantera Capital
▪️Price Range: $95 to $110 per token
▪️Unlocking Period: 4 years
➡️ Market Chart Analysis Update:
▪️Current Chart Analysis: CRYPTOCAP:SOL is showing bearish signs, struggling to maintain above $127.
▪️Potential Downside: If it breaks below $127, prices could drop to between $70-$80.
▪️Historical Note: #SOL was priced at just $8 about a year ago.
▪️Important Note: Keep an eye on the red trend line; crossing it could mean Solana becomes super bearish.
➡️ Discussion Point:
Could Solana hit $50? What are your thoughts given the current market conditions and recent sales?
Join the discussion and share your views!

Reaching at 3400ETTHUSD is looking for long opportunity and expecting to reach at 3400$ and has forming correction on higher timeframe

Reaching at 67500BTCUSD is forming corrective formation for a movement to the downside after reaching at 67500
