Bearish Continuation Setup After Dead-Cat Bounce (1H)
What the chart is saying:
Clear bearish trend: Price has been making lower highs and lower lows. The broader structure is decisively bearish.
Range breakdown: The blue box shows a consolidation range that broke to the downside, confirming continuation rather than accumulation.
Strong sell-off into demand: Price aggressively dropped into the red support zone (~62k–64k), where buyers stepped in hard, creating a sharp bounce.
Relief rally, not reversal: The current move up is a retracement, not a trend change. Momentum looks corrective, not impulsive.
Key resistance zone (~71k–72k):
This green area is previous support turned resistance
It aligns with the breakdown level → classic short opportunity
Planned trade idea (as drawn):
Entry: Into resistance (green zone)
Invalidation: Clean acceptance above resistance
Target: Prior support / liquidity pool around 63k
R:R: Favorable if rejection confirms
Bias:
📉 Bearish below resistance
Only a strong breakout + hold above 72k would weaken the short thesis
What to watch next:
Rejection wicks, bearish engulfing, or momentum divergence at resistance
Volume drying up on the push into the green zone
Failure to reclaim broken structure
⚠️ This setup assumes trend continuation, not a bottom. Until structure flips, rallies are sell-the-rip candidates.
Cryptos

ETHUSD 45-Min Chart — Counter-Trend Long From Demand After Major
Chart Analysis:
Market Structure:
Ethereum broke decisively below the 2,855 resistance zone, confirming a bearish structure shift. The move down was impulsive, followed by weak consolidation — classic distribution → continuation behavior.
Support / Demand Zone:
Price is reacting around 2,485–2,520, a highlighted demand area. This zone aligns with the first strong base formed after the sell-off, making it a high-interest reaction level.
Current Price Action:
ETH is printing long lower wicks into support, suggesting seller exhaustion and early dip-buying. However, structure is still bearish until a reclaim occurs.
Entry Logic:
The marked entry near ~2,490–2,510 assumes:
Support holds
A short-term higher low forms
Momentum flips on lower timeframes
Upside Targets:
TP1: ~2,690 (range equilibrium / liquidity grab)
TP2: ~2,740 (previous consolidation + minor resistance)
Final Target: ~2,855 major resistance (breakdown origin)
Invalidation:
A clean breakdown and close below 2,480 invalidates the long bias and opens continuation toward lower liquidity.
Bias Summary:
Trade Type: Counter-trend bounce
Risk Profile: Higher risk, higher R:R
Trend Context: Bearish until 2,855 is reclaimed

Bitcoin Monthly Support Test — Next Target $58,419 ?Key support sits at $81,933. A clean break and close below this zone could expose Bitcoin to a deeper retracement toward the next major support around $58,419.
However, $81,933 is also a strong monthly support level, so the market’s reaction here is critical.
Keep an eye on whether this level holds or fails — it will likely dictate the next major move.
Share your view in the comments: Do you think BTC will defend this monthly support, or are we heading lower?

HYPER-LIQUID COIN – Rebound from Key FlipZone | 3D AnalysisAfter an extended correction, HYPE has reacted strongly from the major demand zone between $30–$35, which previously acted as the breakout base earlier this year.
The recent bullish candle shows clear demand absorption and a possible shift in momentum back to the upside.
Technical Highlights:
• 📊 Demand Zone: $30–$35 — tested and respected
• 📈 Structure: Higher timeframe bullish market structure still intact
• 🧭 Short-term EMAs: Price reclaiming both 9EMA and 21EMA on 3D
• 💪 RSI: Recovering from mid-range, signaling renewed strength
• 🎯 Targets:
• TP1: $62.8 (intermediate resistance)
• TP2: $75 (major swing target)
• ❌ Invalidation: Daily/3D close below $30
If price continues to hold above the midrange and the EMAs flip supportive, the next leg of the uptrend could unfold toward the $70+ zone.
Bias: Bullish continuation as long as $30 holds
Timeframe: 6 to 9 months

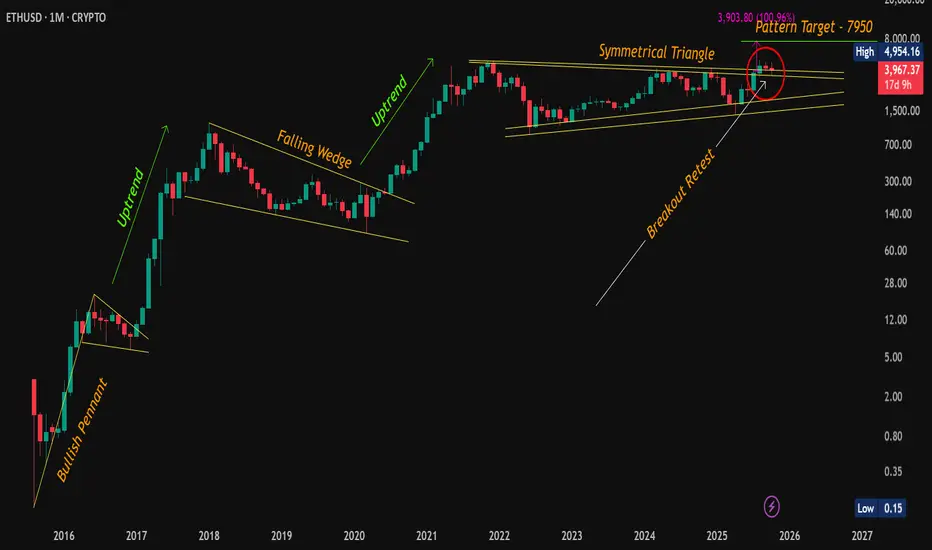
ETH Retest Confirmed – Bullish Momentum Intact!CMP: $3,968
Ethereum is holding strong above the symmetrical triangle breakout zone after a textbook breakout + retest . Despite the recent consolidation, the structure remains bullish , and the bigger pattern is still in play.
🔶 Technical Highlights:
✅ Symmetrical Triangle Breakout: ETH successfully broke out and retested the upper trendline (see red circle). This retest confirms the breakout validity.
✅ Consolidation Above Resistance: ETH is consolidating in a tight range above previous resistance , forming a potential bull flag .
✅ Pattern Targets Remain Active:
📍 Symmetrical Triangle Target: ~$7,950
📍 Bull Flag Target (if breakout confirms): ~$7,365+
📈 Market Structure:
📍 Previous breakouts (Bullish Pennant in 2016, Falling Wedge in 2019) led to strong uptrends .
📍 Current consolidation mirrors historical patterns that preceded major rallies.
🟢 Key Level to Watch:
📍 A monthly close above $4,954.16 (previous ATH) would mark the next major confirmation, likely attracting breakout traders and institutions.
💡 ETH is showing maturity in structure – breakouts, retests, and consolidations are happening on higher timeframes with clear technical precision. The longer this base holds, the stronger the eventual move could be.
📌 Disclaimer: This analysis is shared for educational purposes only. It is not a buy/sell recommendation. Please do your own research before making any trading decisions.
#ETH | #Ethereum | #Crypto | #Breakout | #ChartPatterns | #SymmetricalTriangle | #BullFlag | #PriceAction
Crypto Trading Guide1. Introduction to Crypto Trading
Cryptocurrency trading involves buying, selling, and exchanging digital assets in order to profit from price fluctuations. Unlike traditional markets, crypto trading operates 24/7 due to the decentralized nature of blockchain technology. The crypto market is highly volatile, which presents both opportunities and risks for traders. Popular cryptocurrencies include Bitcoin (BTC), Ethereum (ETH), Ripple (XRP), Cardano (ADA), and many more altcoins.
Crypto trading is divided into two main categories:
Spot Trading: Buying and selling cryptocurrencies for immediate settlement.
Derivatives Trading: Using financial contracts like futures and options to speculate on price movements without owning the underlying asset.
2. Understanding the Crypto Market
2.1 Market Structure
The crypto market is unique in its decentralized, borderless structure. Unlike traditional markets with centralized exchanges, crypto operates via:
Centralized Exchanges (CEX): Platforms like Binance, Coinbase, and Kraken. These offer high liquidity but require trust in the platform.
Decentralized Exchanges (DEX): Platforms like Uniswap and SushiSwap. These run on smart contracts and allow peer-to-peer trading.
2.2 Market Participants
Crypto market participants include:
Retail Traders: Individual traders buying or selling for personal gain.
Institutional Traders: Hedge funds, banks, and large investors.
Market Makers: Entities that provide liquidity by simultaneously placing buy and sell orders.
2.3 Market Hours
Unlike stock markets, crypto markets operate 24/7, which allows traders to react to news and events instantly. However, this also increases the risk of impulsive decisions.
3. Types of Crypto Trading
3.1 Spot Trading
Spot trading is the simplest form of crypto trading where traders buy crypto at current market prices. Key considerations include:
Order Types: Market orders (buy/sell immediately), limit orders (buy/sell at a specific price), and stop-loss orders (automated exit at a set loss level).
Portfolio Diversification: Spreading investments across multiple assets reduces risk.
Risk Management: Setting strict entry and exit rules is critical due to high volatility.
3.2 Margin Trading
Margin trading allows traders to borrow funds to increase exposure. For example, with 10x leverage, a $100 trade controls $1000 worth of assets.
Risks: Margin trading amplifies both profits and losses. Liquidation occurs if losses exceed collateral.
3.3 Futures and Options Trading
Derivatives trading enables speculation on price movements:
Futures Contracts: Agreements to buy or sell an asset at a future date at a predetermined price.
Options Contracts: Rights (but not obligations) to buy or sell at a fixed price within a certain time.
Perpetual Contracts: Futures with no expiry, commonly used in crypto derivatives markets.
3.4 Algorithmic and Bot Trading
Automated trading uses algorithms to execute trades based on predefined strategies:
Trend-following bots: Buy in uptrends, sell in downtrends.
Arbitrage bots: Exploit price differences between exchanges.
Market-making bots: Provide liquidity while capturing spreads.
4. Fundamental Analysis (FA) in Crypto
FA evaluates a cryptocurrency’s intrinsic value based on technology, adoption, and market dynamics. Key factors include:
Whitepapers: Technical documents explaining the coin’s purpose, roadmap, and use cases.
Development Activity: Active GitHub commits and project updates indicate sustainability.
Network Metrics: On-chain data like transaction volume, wallet addresses, and staking rates.
Regulatory Environment: Government policies can significantly affect prices.
5. Technical Analysis (TA) in Crypto
TA uses historical price data to predict future trends. Key tools and concepts include:
5.1 Chart Patterns
Triangles, Head & Shoulders, Double Tops/Bottoms: Patterns indicate potential reversals or continuations.
Support and Resistance Levels: Price points where buying or selling pressure is strong.
5.2 Indicators and Oscillators
Moving Averages (MA): SMA, EMA help identify trends.
Relative Strength Index (RSI): Measures overbought or oversold conditions.
MACD (Moving Average Convergence Divergence): Trend and momentum indicator.
Bollinger Bands: Measure volatility and potential breakout points.
5.3 Volume Analysis
High trading volume confirms price trends, while low volume may indicate weak moves.
6. Risk Management
Effective risk management is crucial in crypto due to volatility:
Position Sizing: Risk only a small percentage (1–3%) of your capital per trade.
Stop-loss Orders: Limit potential losses automatically.
Diversification: Spread investments across multiple coins and strategies.
Avoid Overleveraging: Using excessive leverage increases the chance of liquidation.
7. Trading Strategies
7.1 Day Trading
Traders buy and sell within the same day to profit from short-term price movements. Requires constant monitoring.
7.2 Swing Trading
Holding positions for days or weeks to capture medium-term trends. Combines TA and FA.
7.3 Scalping
Quick trades lasting seconds to minutes. Focuses on small price changes with high frequency.
7.4 HODLing
Long-term strategy where traders hold assets regardless of market fluctuations. Common with Bitcoin and Ethereum.
8. Psychology of Crypto Trading
Emotional discipline separates successful traders from losers:
Avoid FOMO (Fear of Missing Out): Impulsive buying during rapid price surges can lead to losses.
Control Greed: Exiting trades too late can reverse profits.
Patience and Discipline: Following a strategy consistently is more important than predicting the market perfectly.
9. Security and Safety
Crypto security is critical due to hacks and scams:
Wallets:
Hot Wallets: Online wallets for active trading; convenient but vulnerable.
Cold Wallets: Offline storage; highly secure for long-term holdings.
Two-Factor Authentication (2FA): Adds an extra security layer.
Exchange Reputation: Use reputable exchanges with insurance and strong security protocols.
10. Taxes and Regulations
Crypto trading is subject to tax in most countries. Regulations vary widely:
Taxable Events: Selling crypto, converting to fiat, or trading one coin for another.
Reporting Requirements: Maintain transaction records for audits.
Regulatory Compliance: Know your country’s laws to avoid legal issues.
11. Tools and Resources
Traders rely on tools for research, trading, and risk management:
Trading Platforms: Binance, Coinbase, Kraken.
Charting Tools: TradingView, Coinigy.
News Sources: CoinDesk, CoinTelegraph, CryptoSlate.
Portfolio Trackers: Blockfolio, Delta App.
12. Common Mistakes to Avoid
Ignoring risk management rules.
Overtrading or excessive leverage.
Falling for pump-and-dump schemes.
Neglecting security practices.
Blindly following social media tips.
13. Emerging Trends in Crypto Trading
DeFi (Decentralized Finance): Lending, borrowing, and yield farming.
NFTs (Non-Fungible Tokens): Digital collectibles and gaming assets.
Layer 2 Solutions: Faster, cheaper transactions on Ethereum (e.g., Polygon).
AI-Powered Trading: Leveraging artificial intelligence for predictive analytics.
14. Conclusion
Crypto trading offers immense profit potential but comes with high risk. Success requires a combination of:
Strong technical and fundamental analysis skills.
Effective risk and money management.
Psychological discipline and patience.
Staying updated with market trends, news, and regulatory changes.
By developing a systematic trading plan, diversifying strategies, and prioritizing security, traders can navigate the volatile crypto markets more confidently.

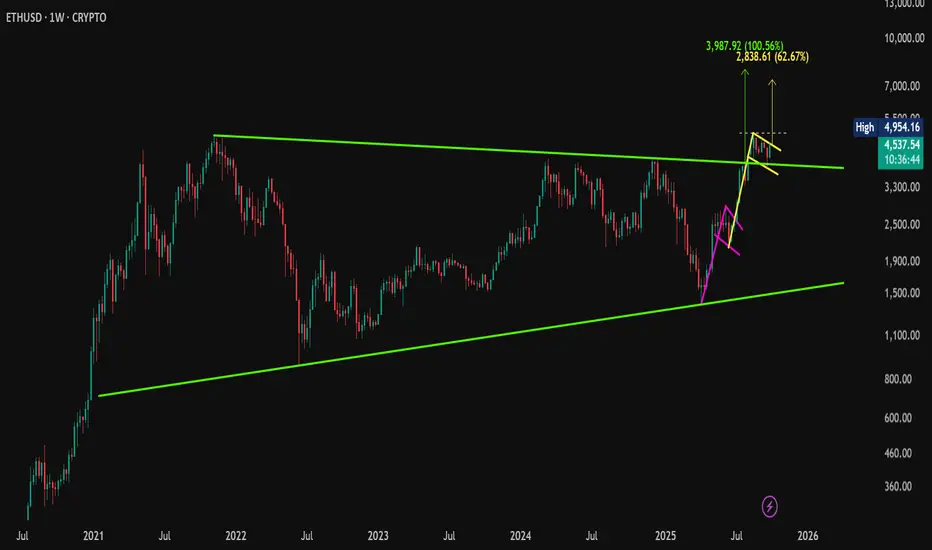
ETH Triangle Breakout + Bull Flag Setup – Is $8K Next?CMP: $4,540
Ethereum has broken out of a long-term symmetrical triangle , retested the trendline, and is now moving higher — signaling strong bullish momentum.
🔹 Breakout Retest Done – ETH completed a clean breakout and retest of the triangle resistance.
🔹 Bull Flags – Two bullish continuation flags have formed. The second flag is on the verge of breaking out , hinting at another potential leg up.
🔹 Pattern Targets –
• Bull Flag target: $7,365 +, if breakout confirms.
• Symmetrical Triangle target: $7,950 , which is over 62% above current price.
🟢 Key Level to Watch: A weekly close above $4,954.16 (previous ATH) would further validate the bullish structure.
#ETH | #Ethereum | #Crypto | #Breakout | #ChartPatterns | #SymmetricalTriangle | #BullFlag | #PriceAction
📌 Disclaimer: This analysis is shared for educational purposes only. It is not a buy/sell recommendation. Please do your own research before making any trading decisions.
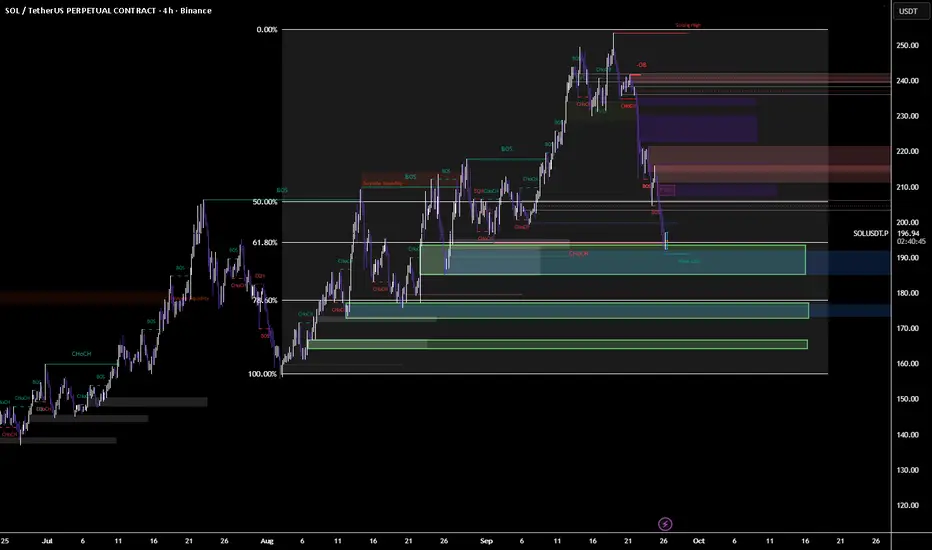
SOL Ready TO Ignite from Demand - Eyeing $240 Supply “SOL Ready to Ignite from Demand – Eyeing $240 Supply”
📌 Description:
Solana swept liquidity into the $192–195 demand zone and is showing signs of strength. As long as $185 holds, bulls may drive price into the $210–240 supply zones. First target sits at $210 (FVG close), with higher objectives at $225 and $240. If demand fails, watch for a rejection short from $210.
Long Setup (Buy Idea)
Entry Zone: $192 – $195 (current demand + weak low + 61.8 retracement support)
Stop Loss (SL): $185 (below demand zone + liquidity sweep area)
Take Profit (TP):
TP1: $210 (FVG imbalance zone)
TP2: $225 (OB resistance zone)
TP3: $240 (supply zone / strong high)
⚖️ Risk–Reward: Around 1:3 to 1:4 if TP2 or TP3 hits.
🔴 Short Setup (Sell Idea, only if rejection occurs)
Entry Zone: $210 – $215 (FVG imbalance / supply)
Stop Loss (SL): $222 (above imbalance zone)
Take Profit (TP):
TP1: $195 (back to current demand)
TP2: $180 (major demand below)
⚖️ Risk–Reward: Around 1:2 to 1:3.
📌 Bias: Currently, price tapped demand and bounced — so long setup looks stronger unless $185 breaks.
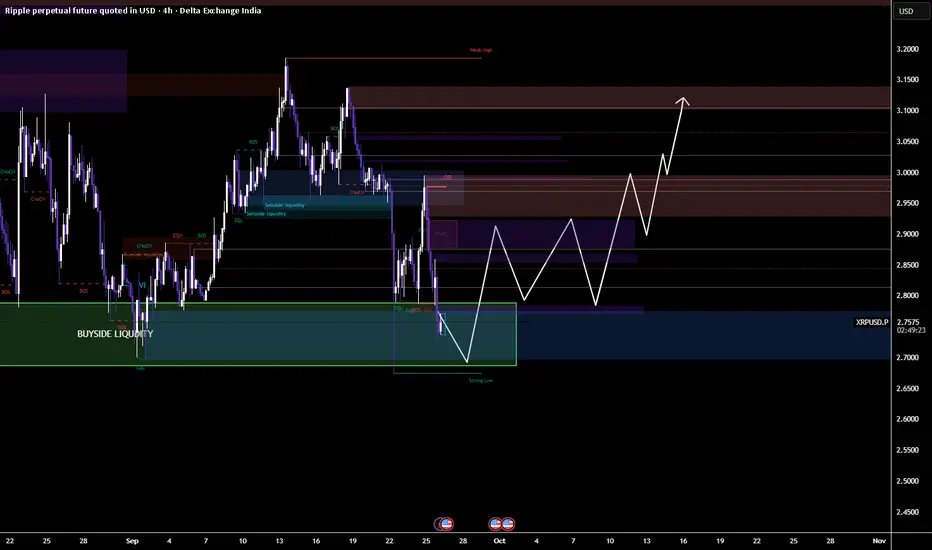
XRP Ready for a Liquidity Sweep & Explosive RallyXRP Ready for a Liquidity Sweep & Explosive Rally
XRP has tapped into deep buyside liquidity near $2.70, forming a strong low. If this level holds, expect a bullish reversal targeting the $2.95–$3.10 supply zones, with potential continuation to new highs. Watch for FVG fills and OB retests along the way.
📈 XRP Trade Plan (4H Chart)
🔹 Entry Zone (Long):
Around 2.70 – 2.74 (buyside liquidity / demand zone).
This is where price just tapped, showing strong reaction potential.
🔹 Stop Loss (SL):
Below 2.62 – 2.65
Safe SL under the Strong Low marked on your chart.
🔹 Take Profit (TP):
TP1: 2.90 (FVG / minor resistance)
TP2: 2.95 – 3.00 (OB + mid supply zone)
TP3: 3.10 – 3.15 (major supply / liquidity grab area)
🎯 Risk-to-Reward (approx):
Entry: 2.72
SL: 2.63 (≈ -0.09 / -3.3%)
TP1: 2.90 (≈ +0.18 / +6.6%) → RR ≈ 1:2
TP2: 3.00 (≈ +0.28 / +10.3%) → RR ≈ 1:3.5
TP3: 3.10 (≈ +0.38 / +14%) → RR ≈ 1:5
⚡ So the setup is a bullish long from liquidity sweep, very clean ICT-style.
TATAMOTOR 1H Tata Motors – 1 Hour Chart Analysis
🔹 Trend Overview
On the 1-hour chart, Tata Motors is currently showing bullish momentum with higher highs and higher lows.
However, price is also facing some resistance near the upper range, so intraday swings are possible.
🔹 Key Levels to Watch
Immediate Support Zone: around ₹706 – ₹709
Stronger Support: near ₹700
Immediate Resistance Zone: around ₹717 – ₹721
Major Resistance: around ₹734 – ₹735
🔹 Intraday Trading View
If price holds above ₹709, bulls may push towards ₹721 – ₹734.
If price slips below ₹706, a retest of ₹700 – ₹695 is possible.
Consolidation is likely in the ₹709 – ₹721 range before any major breakout.
🔹 Indicators (1-Hour Chart)
Moving Averages → Price trading above 20 EMA and 50 EMA, showing short-term strength.
RSI → Near the 60–65 zone, still bullish but close to overbought.
Volume → Slightly increasing on up-moves, showing buyers are active.
🔹 Summary
Bias: Bullish to range-bound
Support Levels: ₹706 / ₹700
Resistance Levels: ₹721 / ₹734
Intraday traders should watch the ₹709 – ₹721 band for breakout or breakdown trades.

Bitcoin – Short-Term Trend ScenarioBitcoin – Short-Term Trend Scenario
Hello Traders,
Bitcoin is maintaining a bullish tone in the short term while still moving within a corrective structure on the medium-term horizon.
Chart Patterns
On the chart, a double-bottom formation has already completed and confirmed.
In a broader view, the market appears to be progressing towards a potential inverse head-and-shoulders pattern, with the current wave contributing to its completion. This structure would be confirmed if price retests the 117k zone.
Elliott Wave Outlook
From an Elliott Wave perspective, the current structure suggests that wave C has not yet been completed, leaving room for further upside.
MACD & Volume
MACD signals, along with trading volumes holding above average, continue to support the buying side, strengthening the bullish bias.
Trading Strategy
Long positions remain the preferred approach.
The 111k level stands out as a favourable intraday buying zone today, with higher probability of success if price pulls deeper into the rising trendline.
Conclusion
Technical signals collectively favour the bullish case for BTC in the short term. Monitoring reactions at the 111k zone and along the trendline will be essential for optimising entries. This is my perspective on the current market – feel free to share your own views in the comments.

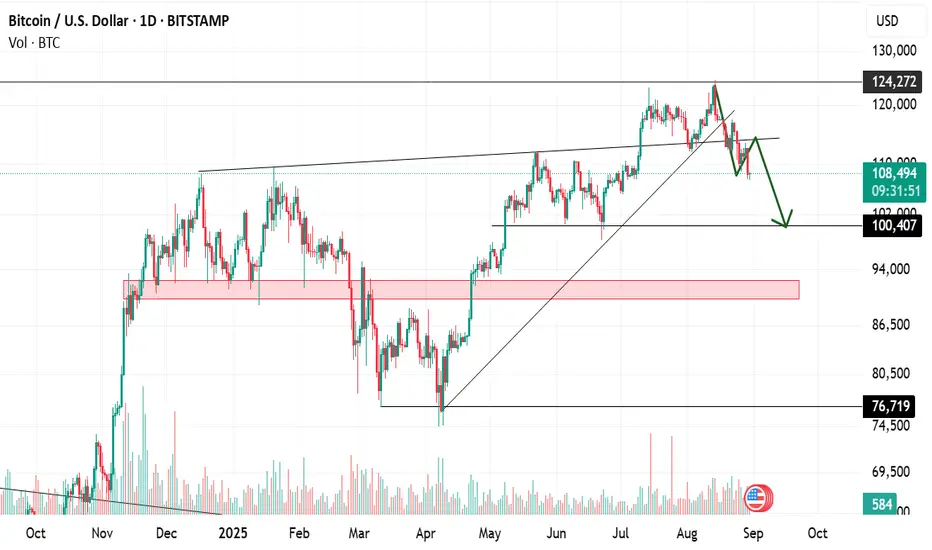
Bitcoin Analysis – Support Break & Next LevelsBitcoin has broken below its key ascending trendline and also lost the horizontal support around 111k–112k.
The breakdown was followed by a retest of the trendline, which got rejected, confirming the weakness.
🔑 Key Levels to Watch
124,272 → Major resistance (recent swing high).
111k–112k → Broken support, now acting as resistance.
100,407 (~100k)→ Next important support zone to test.
92k–90k (red zone) → Strong demand area if 100k fails.
76,719 → Deeper support if selling continues.
📊 Possible Scenarios
1. Bearish Continuation (Base Case):
Price likely to move toward 100k support. A bounce is possible here, but if Bitcoin closes below 100k on daily timeframe, next downside targets are 96k → 92k–90k.
2. Bullish Invalidation:
If BTC reclaims 112k and sustains above it, short-term bearish outlook weakens.
A break above 120k could reopen the path toward 124k.
✅ Conclusion
Right now, the bias remains bearish below 112k, with 100k as the immediate support to watch. Reaction at 100k will decide whether we see a bounce back to 111k or a deeper correction into the 90k zone.
SOLUSD Short trade @205Overall Crypto market is under correction mode. After sharp fall SOLUSD showed some pullback @205 levels and that’s the best entry price to enter for a Short trade. Risk reward ratio is 1:2.5 in this trade.
Entry - 205
Target -198
SL - 207.80

ETH HnSA Head N Shoulder is being made in ETH in 4hr tf. It is also break a rising trendline support.
Entry- 4395-4400
SL- 4550
Target- One can look to book after one is to one or can also target the recent low it made that is 4200.
Disclaimer- This is just for educational purpose. Please take advice before making any decision.
Jai Shree Ram.

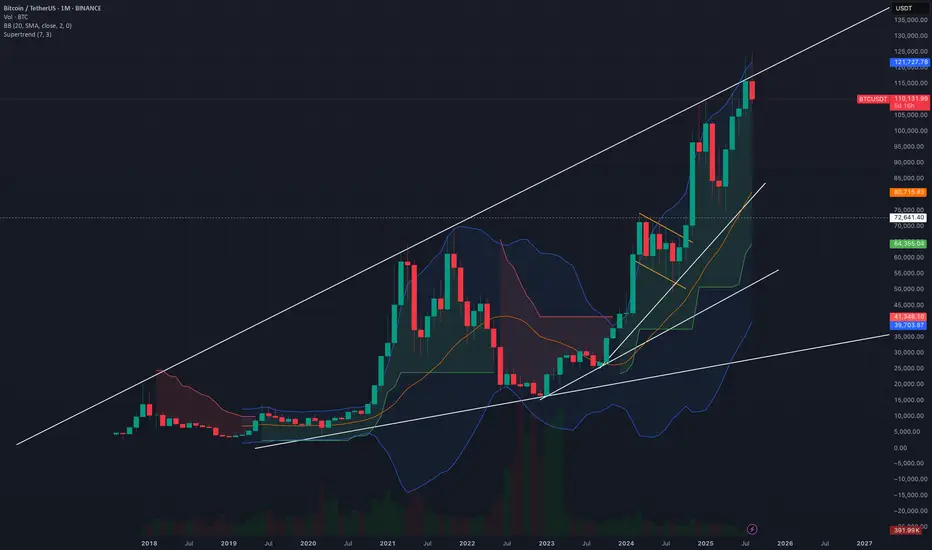
BitCoin? a bit down or big downBitcoin is loosing it fizz now and rally may be about to end.
as per chart reading i can see that it is on the resistance levels
and as now world economies are also settling it should be possible that crypto frenzy get no hype and for that Bitcoin may see a down pludge
Possibly for next 2-2.5 Years Bitcoin won't cross the recent highs and may be retesting 72K level or more downside.
Up move will only continue after breaking and closing above this trendline.
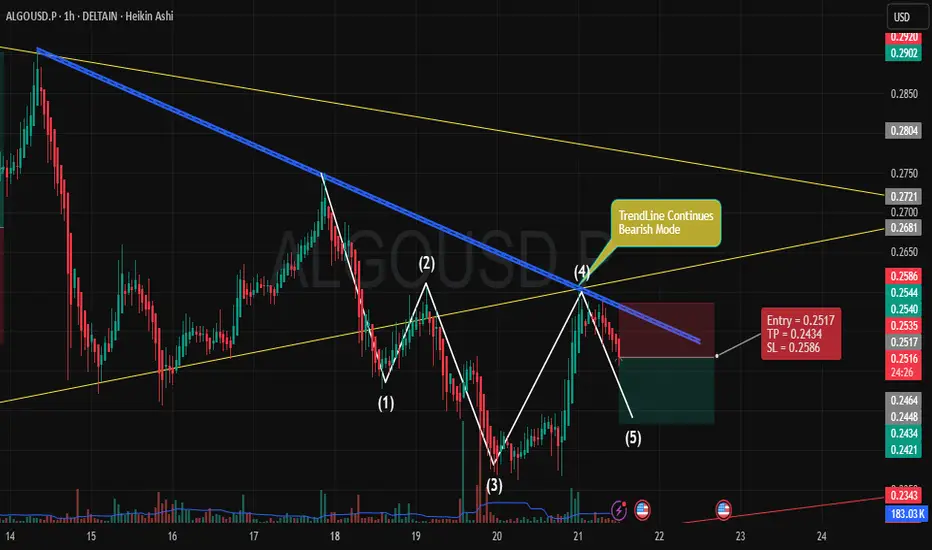
Bearish Continuation for ALGOUSD** IF you like my observation, please boost and follow for more content."
Trade Overview:
Entry: 0.2517
Stop Loss (SL): 0.2586
Take Profit (TP): 0.2434
Key Points:
Trend Analysis:
The price is currently under a bearish trend as indicated by the downward sloping blue trendline. This trendline shows consistent resistance, rejecting price rallies and continuing the bearish bias.
The yellow trendlines represent key support and resistance zones, highlighting the consolidation range where the price has been fluctuating within a defined pattern.
Market Structure:
Price has formed a lower high (marked as point 4), followed by a lower low (point 5), confirming the continuation of the downtrend. This suggests that the market is likely to keep pushing lower towards the target.
The price has retraced upwards but has failed to break the bearish trendline, reinforcing the idea of further downside potential.
Entry Strategy:
Entry Point: We are entering at 0.2517, just below the recent resistance, anticipating the price to continue downward after failing to breach the trendline.
The price action at point (4) suggests weakness in the upward movement, making this a prime opportunity to capitalize on further downside movement.
Risk-Reward Setup:
The Stop Loss is set at 0.2586, just above the last swing high, giving room for minor retracements while protecting against a breakout above the trendline.
The Take Profit is set at 0.2434, targeting the next level of support where the price could potentially find buying interest. This gives a favorable Risk-Reward Ratio of about 2:1.
Volume Confirmation:
Notice the increase in volume during the downward movement, suggesting that sellers are in control. A drop in volume during price retracements further validates the weak bullish momentum and confirms the expected continuation to the downside.
Why This Setup?
The bearish trend, price action, and trendline rejection all align with a continuation trade setup.
The risk-reward is favorable, with a clear structure to exit the trade if the price moves against the position.
The broader market context is also in line with a bearish outlook, making this a high-probability trade setup for the next few hours.
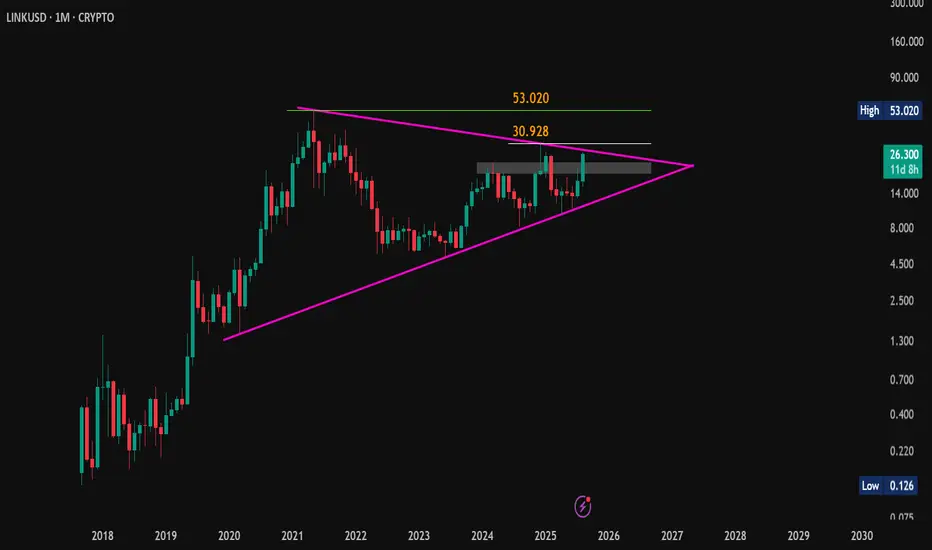
LINKUSD: Symmetrical Triangle Signals Possible Breakout#LINKUSD – Technical Analysis
CMP: $26.30
Chart Pattern: Symmetrical Triangle
Key Observations:
LINKUSD is currently trading within a symmetrical triangle formation, indicating a phase of consolidation. A breakout from this pattern may potentially lead to directional movement, depending on volume and broader market conditions.
Support Levels:
Immediate Support Zone: $22.87 – $19.29
Strong Support (long-term): $10.11
Upside Reference Levels (Post Breakout):
Potential resistance or price reference levels to watch on the upside:
$30.90
$53.00
$92.00
$110.00
$125.00
$145.00
Extreme bullish scenario: $250+
Disclaimer:
This post is for educational purposes only and does not constitute investment advice. Crypto assets are subject to high market risk and volatility. Please #DYOR before making any investment decisions.
#Crypto | #LinkUSD | #LINK | #TechnicalAnalysis | #ChartPatterns | #SymmetricalTriangle | #Altcoins | #Cryptocurrency | #PriceAction | #CryptoMarket | #CryptoCharting
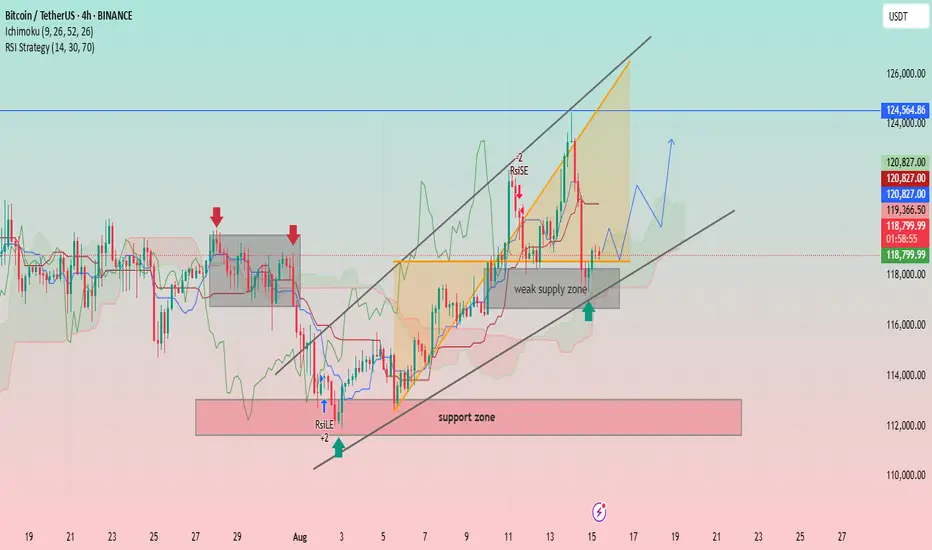
BTC/USDT: Bullish Momentum and Key Support LevelsUptrend Channel: The price is trading within an ascending channel, denoted by two parallel black trendlines. This suggests a bullish trend is in play.
Support and Resistance:
A significant support zone is identified between approximately 112,000 and 114,000 USDT.
A weak supply zone is marked around 118,000 USDT. The price has recently tested this area and found some support.
A strong resistance level is visible at approximately 124,564.86 USDT.
Indicators:
Ichimoku Cloud (9, 26, 52, 26): The price is currently trading above the cloud, indicating a bullish sentiment. The cloud itself appears to be thin and slightly bullish, suggesting potential for continued upward movement.
RSI Strategy (14, 30, 70): The Relative Strength Index (RSI) is used as a strategy, with a "RSILE" signal (likely "RSI Low Entry") marked with a "+2" and a red arrow, suggesting a potential buy signal near the support zone in early August. A "-2" signal is marked near the top of the channel, indicating a potential overbought condition or reversal signal.
Price Action and Projections:
The price recently experienced a sharp decline from the upper trendline, indicating profit-taking or resistance at that level.
The price is currently near the lower trendline and the "weak supply zone," which appears to be acting as support.
A potential future price path is drawn with a blue arrow, suggesting that the price may consolidate or bounce off the current support area and move higher towards the upper boundary of the channel.
Another potential path is drawn with a red arrow, showing a possible further drop towards the lower trendline before a bounce.
Part 4 Institutional Trading Option Pricing: The Greeks
Option pricing is influenced by various factors known as Greeks:
Delta: Measures how much the option price changes for a ₹1 move in the underlying.
Gamma: Measures how much Delta changes for a ₹1 move.
Theta: Measures time decay — how much the option loses value each day.
Vega: Measures sensitivity to volatility.
Rho: Measures sensitivity to interest rates.
Time decay and volatility are crucial. OTM options lose value faster as expiry nears.
Options Trading Strategies
For Beginners:
Buying Calls: Bullish on the stock/index.
Buying Puts: Bearish on the stock/index.
For Intermediate Traders:
Covered Call: Holding the stock + selling a call for income.
Protective Put: Holding stock + buying a put to limit losses.
For Advanced Traders:
Iron Condor: Neutral strategy with limited risk/reward.
Straddle: Buy a call and put at the same strike; profits from big moves.
Strangle: Buy a call and put at different strikes.
Spreads:
Bull Call Spread: Buy a lower call, sell a higher call.
Bear Put Spread: Buy a higher put, sell a lower put.
These strategies balance risk and reward across different market outlooks.
Advantages of Options Trading
Leverage: Small capital can control larger positions.
Risk Defined: Buyers know their maximum loss (premium).
Flexibility: Strategies for bullish, bearish, or neutral markets.
Income Generation: Selling options can earn premiums regularly.
Hedging Tool: Protect portfolios from downside risks.

YFI Long SetupYFI has shown a strong rebound from a well-respected support zone after multiple rejections from the lower range. The price recently broke out of a descending channel, signaling a potential reversal from the bearish structure. This breakout was accompanied by a decisive bullish candle with strong body and increased volume—hinting at institutional buying. After the breakout, YFI has formed a tight consolidation (bullish flag) just above the breakout zone, suggesting strength and continuation potential. A clean push above the flag resistance or a retest of the breakout zone with bullish confirmation can offer a high-probability long opportunity.

KOTAKBANK 1D TimeframeHow You Can Use These Levels
On Dips
Buy first around ₹2,168–₹2,170
If market softens, look to ₹2,149–₹2,150
For long-term entries, accumulate near ₹2,117–₹2,120
On Rallies
Consider partial portfolio blackening near ₹2,220–₹2,225
If it clears ₹2,252, additional gains may follow → consider selling gains near ₹2,272
Breakout/Bearish Triggers
A close below ₹2,117 signals potential short-term downtrend
A breakout above ₹2,272 with strong volume opens the path to higher highs
✅ Bottom Line (in simple terms)
Buy dips around ₹2,168, with stronger buying near ₹2,149 and ₹2,117.
Take profits roughly between ₹2,220–₹2,252.
If resistance breaks with conviction, expect more upside.
Conversely, if it drops below ₹2,117, be cautious.

GBPUSD BUY LONG!!!!!As per my view,
Price retrace to 0.618 area and shows good support from that area.
So the upside liquidity areas are 1.3729 and 1.3789.
Plan your trade according to this with your own risk.
Bonus point ----- if today candle close bullish means then the target will definitely reach.

Institutional Trading ProcessInstitutional Trading Process
1. Research and Strategy Development
Extensive quantitative research.
Backtesting models.
Scenario analysis using risk management software.
2. Trade Execution
Executing trades via dark pools to prevent market impact.
Using smart order routers for best price execution.
3. Risk Management
Continuous monitoring of positions.
Real-time adjustments using delta-hedging.
Portfolio diversification to spread risk.
4. Reporting and Compliance
Institutional trades are heavily regulated.
Detailed reporting to regulatory bodies like SEBI, SEC, etc.
