BREV/USDT Crypto Futures – Buy Stop SetupBREV/USDT, a Buy Stop order is recommended at 0.1433, anticipating upward momentum. The trade targets are set at 0.1457 for TP1 and 0.1479 for TP2, offering potential profit zones as the price moves higher. To manage risk, a stop-loss is placed at 0.1397, ensuring controlled exposure in case of a market reversal. This setup suggests a bullish bias, and traders should monitor price action closely to confirm the momentum before entry.
BREV/USDT
Buy Stop
Entry: 0.1433
Target 1 (TP1): 0.1457
Target 2 (TP2): 0.1479
Stop Loss (SL): 0.1397
Bias: Bullish – expecting upward momentum
⚠️ Disclaimer:
This trade setup is for educational and informational purposes only. Trading cryptocurrencies involves high risk, and past performance does not guarantee future results. Always do your own research (DYOR) and trade responsibly. Never invest money you cannot afford to lose.
Cryptosignals

$BNB Technical Analysis: Why $10,000 Is On The RadarBNB Technical Analysis: Why $10,000 Is On The Radar
1️⃣ Historical Precedent
2021 Bull Run: +1,950%
2027 Projection: +1,900% (based on same chart pattern & price structure)
Repeating patterns suggest massive green candles could follow.
2️⃣ Key Support Zones
Strong long-term support: $500 & $200 ( Accumulation zone )
Support is holding, signaling a high-probability base for a breakout.
3️⃣ Price Targets
Short-term: $2,000 → $5,000
Long-term: $10,000 🎯
This aligns with historical price mechanics and measured growth potential.
4️⃣ Risk Management
Accumulate gradually; avoid FOMO buys
Always DYOR & understand support/resistance levels before entering
TA Insight:
BNB shows a pattern identical to previous bull cycles. Breaking current resistance levels could trigger an explosive upward trajectory.
CRYPTOCAP:BNB is technically primed. If you’re strategic now, you’re positioning for multi-year gains.
NFA & DYOR

Is $MONAD Bullish? Technical Structure Suggests 10x PotentialPrice is Consolidating in a range-bound Structure Between Well-Defined Support and Resistance, indicating active Accumulation.
🟦 Demand Zone: $0.020–$0.022
🟥 Supply Zone: $0.025–$0.027
A Confirmed Breakout and close above Resistance Would signal a Bullish Structure Shift and Continuation of the Uptrend.
Trend Remains Bullish above $0.016, the recent swing low. A breakdown below invalidates the setup.
Based on Structure and Expansion Potential, 10x Upside is possible in a Strong Altseason.
Volatility remains High, Risk Management is Mandatory.
NFA & DYOR

POWRX/USDT (Crypto Setup)
POWRX/USDT is showing bullish continuation strength, indicating a potential upside breakout. A Buy Stop is placed at 0.08373, confirming entry only after price acceptance above resistance. The first upside objective is 0.08463, followed by an extended target at 0.08573, where partial or full profit booking can be considered. The trade remains valid as long as price holds above the defined risk level, with a stop loss at 0.08237 to protect capital in case of a failed breakout. This setup aligns with momentum-based continuation and favors disciplined risk management.
⚠️ Disclaimer:
This analysis is for educational and informational purposes only and does not constitute financial advice. Crypto markets are highly volatile and involve substantial risk. Please do your own research (DYOR) and consult a financial advisor if needed. The author is not responsible for any profit or loss arising from the use of this information.

"ETH/USDT Forecast""ETH/USDT Forecast"
The market shows evidence of strong participation earlier, where price moved with speed and consistency, reflecting clear intent. That phase established direction and control without prolonged hesitation.
As price progressed, momentum began to ease. Movement slowed, reactions became more frequent, and volatility compressed. This change indicates a shift from active pressure to evaluation, where participants reduced aggression and allowed price to stabilize.
The subsequent recovery unfolded in a measured and uneven manner. Advances were short, overlapping, and lacked continuation, suggesting limited commitment behind higher prices. Opposing flow remained active, preventing expansion.
Currently, price behavior is defined by balance and compression. Activity reflects positioning rather than resolution. Until behavior shifts from overlap to decisive movement, the market remains in a waiting state, with continuation favored once imbalance returns.

ACTUSDT – Sell Setup (Futures | Intermediate)ACTUSDT – Sell Setup (Futures | Intermediate)
ACTUSDT is showing clear signs of weakness after failing to sustain above the recent resistance zone. Price action suggests sellers are regaining control, with lower highs forming and momentum shifting to the downside. A sell-stop entry at 0.02797 is planned to confirm continuation below support. If bearish momentum accelerates, price is expected to move toward 0.02739 as the first target, followed by 0.02677, which aligns with the next demand zone. The stop loss at 0.02884 is placed above the invalidation level to protect against false breakdowns. Overall, the structure favors continuation selling as long as price remains below resistance and broader market sentiment stays neutral to bearish.

$BTC: Technical Breakdown (High-Probability Bearish Setup)CRYPTOCAP:BTC : Technical Breakdown (High-Probability Bearish Setup)
Market Structure Shift
Bitcoin has Already lost $107000 major bullish support and is sustaining below it, confirming a bearish market phase.
The Head & Shoulders distribution pattern is fully validated.
Head & Shoulders Measurement
As per classical H&S rules, the 162% extension target of the pattern has already been achieved on the downside, indicating:
🔹 Pattern completion
🔹 Cycle top likely formed
🔹 Transition from bull to bear phase
Fibonacci Retracement (Macro Bear Framework)
Measured from bear-market low → cycle top, Fibonacci levels project:
0.382 Fib: ~$56,700
0.5 Fib: ~$44,000 → key bear market acceptance zone
0.618 Fib: ~$35,000 → strongest macro support / worst-case scenario
Current price action still reflects a healthy macro retracement, not capitulation.
Liquidity & Imbalance
Despite the bearish structure, a Fair Value Gap (FVG) remains unmitigated in the $98,000–$100,000 range.
This level may act as a liquidity magnet before the next impulsive leg down.
Bias & Scenarios
Primary bias: Bearish
Relief rally possibility: $98K–$100K (FVG fill)
Next downside leg: $70K–$60K, then deeper Fib supports
Conclusion
With H&S 162% target completed and structure broken, BTC remains bearish by technical definition.
Trade only with confirmation, manage risk, and respect all valid scenarios.
NFa & DYOR

BTC Breakdown Confirmed – Here’s Where BTC Could Surge NextBTC Breakdown Confirmed – Here’s Where BTC Could Surge Next
1️⃣ Long-Term Trendline Breakdown Confirmed
🔹 BTC has decisively broken the multi-year ascending trendline supporting price since Nov 2022.
🔹 The Breakdown + Retest at ~$104k-$108k confirms bearish structure ✅.
🔹 Retest failed in Oct 2025, confirming sellers are in control.
2️⃣ Fibonacci Levels Highlight Strong Demand
🔹 Price is now hovering between 0 Fib ($125,647) and 0.382 Fib ($56,494).
🔹 Measured move Targets: Strong Demand Zone $34,477 - $56,494 (0.618 - 0.382 Fib)
🔹 This is the accumulation zone for long-term positions, historically providing strong bounce potential.
3️⃣ Critical Support / Resistance Zones
🔹 Immediate Support: $85k-$87k (psychological)
Major Support:
🔹 $56,494 (0.382 Fib, upper demand)
🔹 $44,133 (0.5 Fib, middle demand)
🔹 $34,477 (0.618 Fib, “Golden Pocket”, lower demand)
Resistance: Broken trendline now acting as key supply
4️⃣ Potential Scenarios
Bearish (High Probability)
🔹 Continuation down to Strong Demand Zone ($34k-$56k)
🔹 Represents 38-61% retracement from ATH, typical after trendline breakdown + retest
Bullish (Needs Reclaim)
🔹 Reclaim broken trendline (~$95k-$100k)
🔹 Close above $104k = false breakdown, continuation to new highs
Why I’m Watching $56,500 - $34,500 for Longs
🔹 Historical accumulation zone with high probability of a strong bounce
🔹 After breakdown + retest, price often retraces to 0.5 or 0.618 Fib before resuming bull trend
🔹 Perfect long-term entry for those aiming for multi-year BTC upside
BTC may test the $56k-$34k demand zone soon. For long-term holders, this is a prime accumulation area before the next bull cycle. Stay patient and strategic – $1M BTC dreams require discipline, not FOMO.
Guys, don’t judge me: I’m a Bitcoin lover too. I’m just reading what the chart is showing. Even if the short-term looks bearish, I see the setup for a massive long-term move toward $1M 🚀
NFA & DYOR

BITCOIN JUST DID EXACTLY WHAT WE DISCUSSED: CURRENT UPDATEBITCOIN JUST DID EXACTLY WHAT WE DISCUSSED: CURRENT UPDATE
CRYPTOCAP:BTC bounced perfectly from the 0.786 Fib ($83,308), The FINAL bullish support.
Now trading above $86,500, already +5–6% up from the exact level I alerted.
As long as BTC holds $83,308, upside relief rally remains active:
$88,000 (FVG)
$93,000 (Bearish OB)
$98,000 (FVG inefficiency)
But… if BTC loses $83,000, say hello to the $66,000 demand zone, The next real bullish orderflow.
For now: Structure is bullish above 0.786, cautious below it.
(NFA / DYOR)

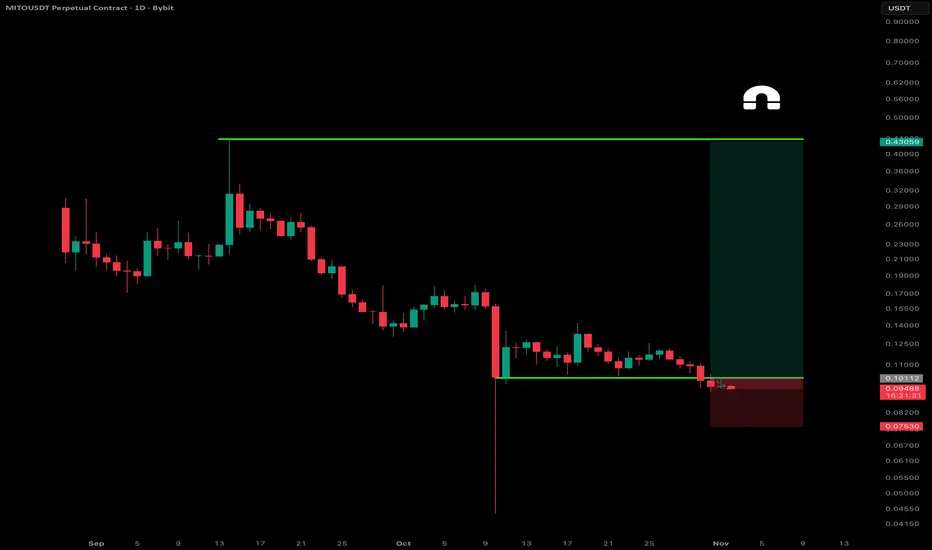
MITO – Quiet Accumulation Before the Storm?SEED_ALEXDRAYM_SHORTINTEREST2:MITO has been bleeding for weeks, but this chart setup looks like it’s quietly loading for something bigger. After the steep drop in early October, price found a base around the 0.09 zone and has been hovering there with tight-bodied candles — a classic sign of accumulation after capitulation.
The green range on the chart highlights a clear breakout box — a move above that short-term resistance could easily trigger a relief rally. What’s interesting is how the downside has started to lose momentum even as overall sentiment stays bearish. That kind of decoupling often precedes sharp mean reversion moves.
Volume has cooled off massively from the highs, which means a fresh wave of buying could move this fast. If bulls manage to reclaim that 0.10 area decisively, the setup opens up room for a sustained move toward the previous liquidity cluster near 0.14 and beyond.
Let’s see if this quiet base turns into a breakout spring.
👉 Check out my profile and follow me for more trade setups like this — I post fresh charts whenever there is a fresh opportunity in the market.
$XPL ALERT: Bearish Now, Massive Accumulation Ahead?AMEX:XPL ALERT: Bearish Now, Massive Accumulation Ahead?
Current Chart View:
AMEX:XPL (Plasma) is showing bearish momentum at current levels. Expect a potential 30%-50% downside, which could create a high-probability accumulation zone for strategic investors.
Key Resistance: $0.32 (blue trendline)
Only a close above $0.32 on higher timeframes (HTF) will trigger a bullish trend reversal. Until then, bears are in control.
Targets if Bullish Breakout Occurs:
Short-term: Price clears $0.32 → bullish momentum resumes
Long-term: $2 possible if price sustains above $0.32
Trading Strategy:
Accumulate in the lower support zone for maximum risk-reward
Wait for HTF confirmation above $0.32 for safer long positions
Watch volume & momentum for breakout validation
Market Insight:
AMEX:XPL offers strategic accumulation potential now, but patience is key. The next bullish move depends entirely on HTF breakout confirmation.
NFA & DYOR

This $4 Token Could Hit $20 And Nobody's Talking About ItThis $4 Token Could Hit $20 And Nobody's Talking About It
Support: $3.70-$4.00 (holding)
HTF Target: $20 (5x potential)
Why it matters:
✅ Exchange tokens outperform in bull cycles
✅ Clear support zone + bullish structure
✅ 500% upside if base holds
While everyone chases pumps, smart money accumulates at support with 5:1 risk-reward.
IF this holds $4 Support, NYSE:BGB could be the millionaire-maker nobody saw coming.
DYOR. Not financial advice.

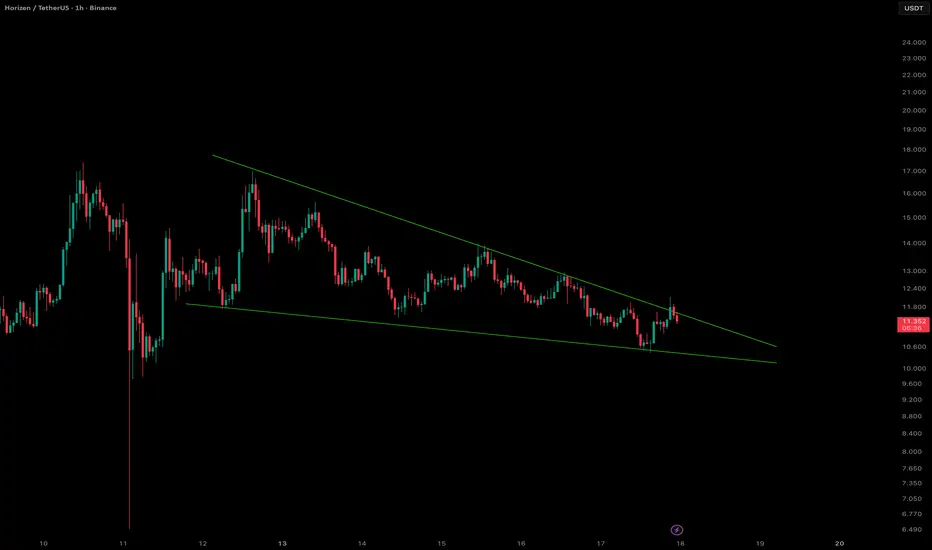
ZENUSDT Breaking Out of the Falling Wedge??HORIZEN (ZENUSDT) Analysis - 1 Hour Time Frame
Looks like ZEN is trying to break out of the falling wedge pattern. A candle close with decent volume or a successful retest above the falling wedge could confirm the bullish breakout.
In any case, Iam keeping an eye on this one, added to my watch list.
Dont forget to like and follow me to for more trade opportunities.
Ethereum’s Next Move: $3,000 Buy Zone or $10,000 Breakout?Ethereum’s Next Move: $3,000 Buy Zone or $10,000 Breakout?
Current Market Overview:
Ethereum is currently trading below $4,000, indicating short-term weakness as bulls struggle to regain control. The $4,000 level remains a key pivot point, holding above it is essential for any sustained move toward higher targets.
Key Levels to Watch:
🔹 Immediate Resistance: $4,000
🔹 Major Support Zone: $3,000 – $2,600 (ideal accumulation area)
🔹 Upside Targets: $8,000 – $10,000 (if $4,000 is reclaimed)
Bullish Scenario:
If Ethereum breaks and holds above $4,000, it confirms bullish momentum and opens the path toward $8,000–$10,000 in the mid to long term.
Bearish / Accumulation Scenario:
If ETH remains below $4,000, expect a possible retracement toward $3,000 – $2,600. This zone could act as a strong accumulation area for long-term investors.
Outlook:
The broader structure remains long-term bullish despite short-term pullbacks. Dips into major support zones should be viewed as opportunities for strategic accumulation.
⚠️ Note: Always DYOR (Do Your Own Research) before making any investment decisions. This analysis is for educational purposes only.

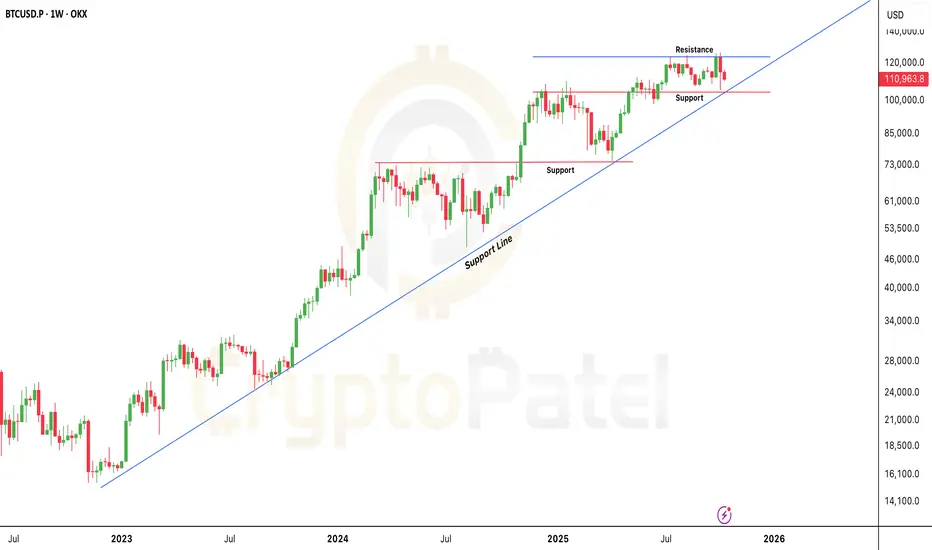
If Bitcoin Loses This Level: Expect the Biggest Correction YetIf Bitcoin Loses This Level: Expect the Biggest Correction Yet
Current Market Overview:
Bitcoin is trading above $110,000, maintaining a bullish stance for now. However, short-term momentum looks weak as the market tests crucial support levels.
Key Support Zone:
The most critical area to watch is $104,000 – $105,000.
This zone aligns with the long-term bullish trendline, which has held firm through multiple market corrections.
As long as price stays above this trendline, the broader trend remains bullish.
Bullish Scenario:
If Bitcoin holds above the $104,000 support level, it signals strength and potential continuation of the uptrend.
In that case, the next upside target remains around $150,000 in the coming months.
Bearish Scenario:
If the $104,000 trendline breaks decisively, Bitcoin may enter a deeper correction phase.
Downside targets could extend to below $100,000, and in a worst-case scenario, even toward $80,000.
Technical Summary:
🔹 Immediate Resistance: $110,000 – $112,500
🔹 Major Support Zone: $104,000 – $105,000
🔹 Trend Bias: Bullish above $104,000 | Bearish below $104,000
🔹 Long-Term Target: $150,000 (if support holds)
Trading Insight:
This is a decisive zone for Bitcoin. Bulls must defend $104k to maintain structure.
Below it, expect volatility and potential trend reversal signals.
NFA & DYOR
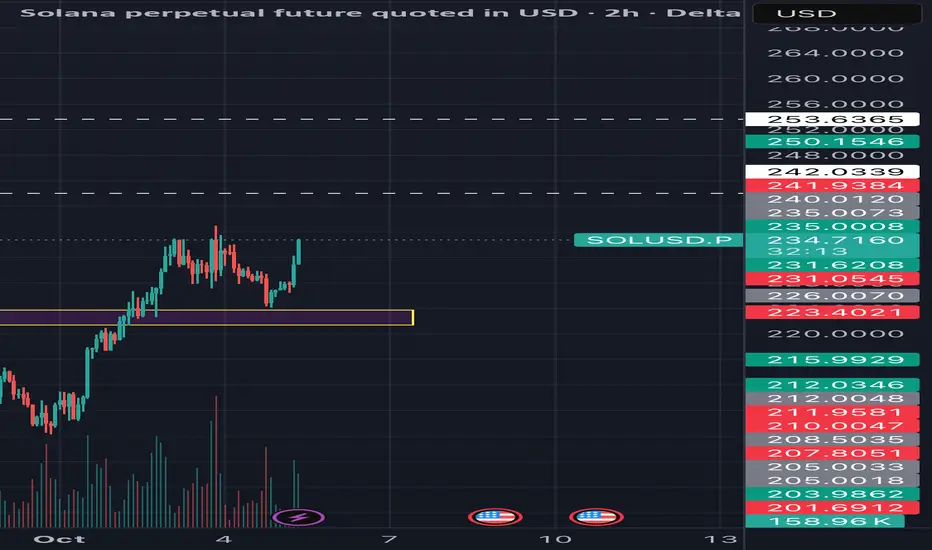
Breakout Play: Demand Zone Reversal with High R:R TargetOverview :
This idea focuses on a breakout trade for Solana (SOLUSD), leveraging recent price action and volume signals at a key demand zone. The setup is designed for a high risk-to-reward ratio based on technical structure and confirmation tools.
Trade Setup & Logic:
• Entry: Price retraced to retest the 225–230 support zone, which previously acted as resistance and now converts to demand. Entry is triggered by a strong bullish candle closing above 231.5 with an uptick in volume, confirming renewed buyer interest.
• Stop Loss: Placed below 225, the lower bound of the highlighted demand area, to minimize risk if support fails immediately.
• Targets:
Target 1: 241 (first major supply zone and prior swing high).
Target 2: 253.70(multi-week trend resistance, aligns with fib extension and liquidity clusters).
• Risk-Reward: A minimum R:R of 1:2 is targeted. Stop loss is tightly managed once price moves in favor, with trailing stop as price approaches Target 1.
Technical Factors:
• Support/Resistance: The purple highlighted zone shows a confluence of prior reversal points and volume spikes, indicating strong institutional activity.
• Structure Confirmation: Entry is only valid upon a clear bullish reversal signal above the support zone and confirmation of above-average volume.
• Market Context: Recent downtrend is breaking, with higher lows and higher highs. Supply absorption observed at the retest supports the bullish thesis.
Trading Plan:
• Wait for price to close above 231.5 with volume confirmation before entering.
• Adjust stop loss to breakeven after Target 1.
• Take partial profits at Target 1, let remainder ride up to Target 2.
Final Notes:
Discipline and patience are essential—trade only on confirmation to avoid false breakouts. Self-research is recommended, and risk should always be managed per personal capital allocation protocols
Disclaimer: This is a technical analysis idea, not financial advice. Please perform your own due diligence before trading.
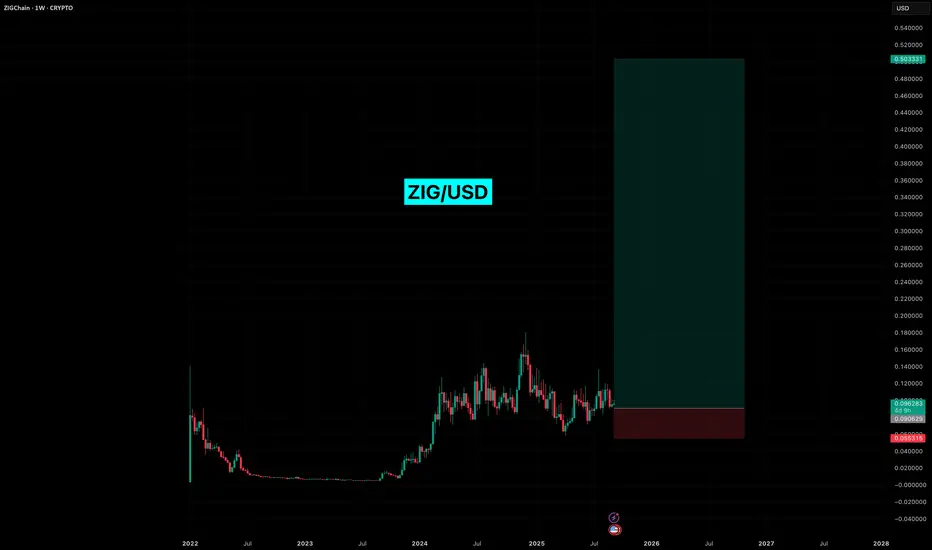
ZIG Getting Ready For The Blast!ZIG coin has proven extreme resilience since its launch and with its new partnership announcement with APEX Global Group, which is one of the largest asset management firms with over $3.4 Trillion USD, this beast is just getting started.
Buying a decent bag here for 1 to 2 years hold.
ENJOY and dont forget to thank me later.
XRP/USD Trade Setup: Bearish Position on Technical AnalysisTimeframe: 1 Hour
Entry Price: 3.0229
Take Profit (TP): 2.8769
Stop Loss (SL): 3.1199
1. Market Overview
XRP is currently in a bearish phase, and the price action indicates that a downward continuation is likely. The market has been rejecting higher levels, with strong resistance at the 3.1777 zone, and now the price appears to be moving lower.
2. Entry Criteria:
The entry point is set at 3.0229, just below the current price level, where we anticipate the market to continue its downward movement after facing resistance at higher levels.
The recent price action shows a clear rejection from the upside, and we are expecting further downside once the price breaks below the immediate support near the entry.
3. Technical Indicators:
Heikin Ashi Candles: The chart uses Heikin Ashi candles, which help smooth the price action. The red candles indicate a bearish sentiment, confirming the continuation of downward pressure.
Volume Analysis: The increase in volume during the recent selling phase is confirming that the bears are in control and the trend may continue to the downside.
4. Support & Resistance Levels:
Resistance: The price is facing resistance around 3.1777, which has proven to be a significant level of rejection.
Support: The main support zone is located near the 2.8769 level, which coincides with our take profit (TP). This is a logical target as it aligns with previous lower levels and current trend structure.
5. Risk-Reward Ratio:
The Stop Loss is placed at 3.1199, just above the recent swing highs and resistance level, ensuring we limit risk in case of a market reversal.
The Take Profit is set at 2.8769, offering a solid risk-reward ratio of 1:1.5. This level is where we expect the price to find support and potentially reverse after hitting the target.
6. Trade Management:
Monitor Resistance Level: If the price fails to break below the entry and starts moving upward, consider adjusting the stop loss or exiting the position to limit losses.
Trailing Stop: Once the price starts moving in your favor, consider implementing a trailing stop to lock in profits as the price moves lower.
7. Potential Risks:
False Breakdown: A false breakdown is always a risk, where the price could temporarily dip below the support and reverse, hitting the stop loss before continuing lower.
Market Volatility: Be mindful of the inherent volatility in the crypto market, which can lead to sudden reversals due to news or other external factors.
8. Conclusion:
This trade setup is based on a bearish market structure, where price is showing clear resistance and the potential for further downward movement. The setup is logical with a strong risk-reward ratio and a clear target for profits. As always, risk management is crucial, and it's important to monitor price action closely for any signs of reversal.
Good luck, and trade carefully!

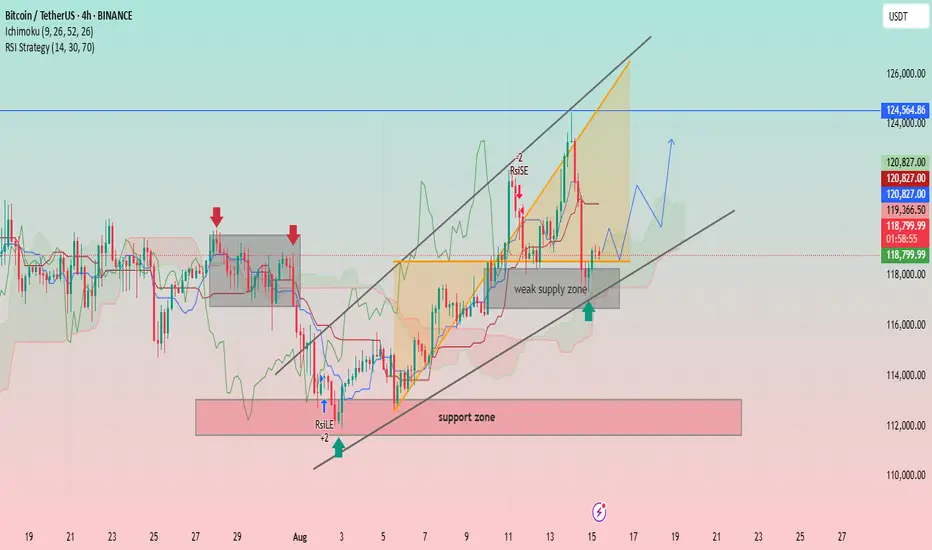
BTC/USDT: Bullish Momentum and Key Support LevelsUptrend Channel: The price is trading within an ascending channel, denoted by two parallel black trendlines. This suggests a bullish trend is in play.
Support and Resistance:
A significant support zone is identified between approximately 112,000 and 114,000 USDT.
A weak supply zone is marked around 118,000 USDT. The price has recently tested this area and found some support.
A strong resistance level is visible at approximately 124,564.86 USDT.
Indicators:
Ichimoku Cloud (9, 26, 52, 26): The price is currently trading above the cloud, indicating a bullish sentiment. The cloud itself appears to be thin and slightly bullish, suggesting potential for continued upward movement.
RSI Strategy (14, 30, 70): The Relative Strength Index (RSI) is used as a strategy, with a "RSILE" signal (likely "RSI Low Entry") marked with a "+2" and a red arrow, suggesting a potential buy signal near the support zone in early August. A "-2" signal is marked near the top of the channel, indicating a potential overbought condition or reversal signal.
Price Action and Projections:
The price recently experienced a sharp decline from the upper trendline, indicating profit-taking or resistance at that level.
The price is currently near the lower trendline and the "weak supply zone," which appears to be acting as support.
A potential future price path is drawn with a blue arrow, suggesting that the price may consolidate or bounce off the current support area and move higher towards the upper boundary of the channel.
Another potential path is drawn with a red arrow, showing a possible further drop towards the lower trendline before a bounce.
$BANANAS31 Dumped 58% — Hope You Took Profits, Not Pain.$BANANAS31 Dumped 58% — Hope You Took Profits, Not Pain.
It just dumped 58% within hours. Brutal.
Yesterday: $0.016–$0.018
Now: $0.0071 and still sliding…
Hope you enjoyed huge profit with $BANANAS31 short trade —
and not by buying the top.
This is why I always say:
Never chase green candles.
Don’t be exit liquidity.
Learn the game or pay the price. What’s your biggest FOMO trade?👇

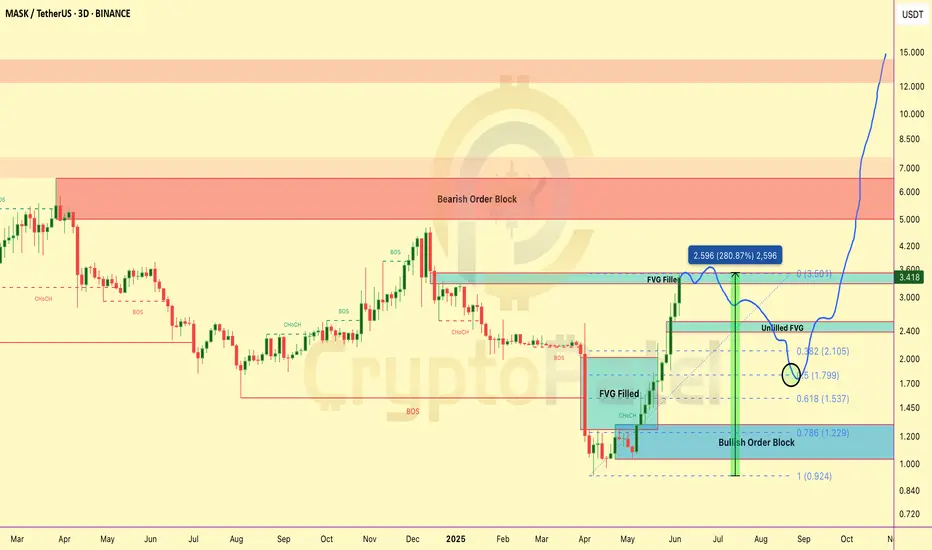
MASK 3.7x PUMP — Is a BIG DIP Coming?MASK 3.7x PUMP — Is a BIG DIP Coming?
MASK just delivered a MASSIVE rally from the Bullish Order Block at $1.2–$1.3 — and filled the FVG around $3.5.
Here’s what’s next 👇
🟢 Short-Term Outlook:
👉 After pumping from $0.927 → $3.50 → that’s a 3.7x move WITHOUT any major retracement.
👉 High chances of a healthy pullback next.
👉 Strong Accumulation Zone: If price drops towards 0.5 Fib retracement at $1.80 → This will be a key area for Smart Money to re-enter.
🟢 Mid-Term Potential:
👉 Once accumulation is done → breakout above $3.5 highly likely.
👉 First big target → Bearish Order Block at $5–$7.
🟢 Long-Term Vision:
👉 If BTC supports and MASK maintains bullish structure → can aim for $15/$30/$50 🚀
👉 Huge upside still left on higher timeframes.
Key Levels to Watch:
✅ $3.5 → Resistance
✅ $2.1–$1.5 → Retracement buy zone (Unfilled FVG + Fib confluence)
✅ $1.80 → 0.5 Fib — Strong Accumulation Zone
✅ $5–$7 → Major target zone
✅ $15/$30/$50 → Long-term moonshot
My Play → Waiting patiently for retracement → looking to accumulate in $2.1–$1.5 zone, ideally around $1.80 → position for next rally!
👉 What’s YOUR strategy on MASK? Buying the dip or waiting higher? Comment below 👇👇👇
NFA & DYOR
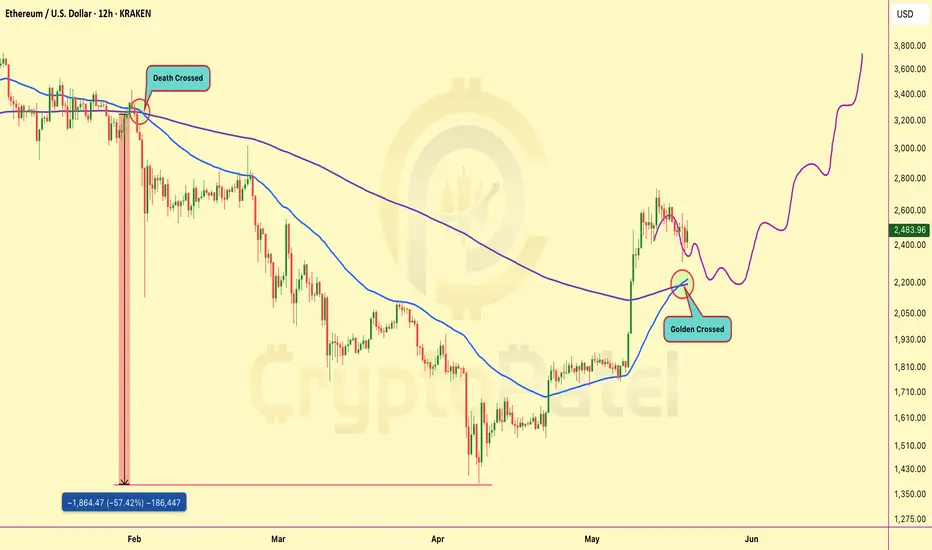
Ethereum Golden Crossed so What Next? $5000?🚨 CHART ALERT: CRYPTOCAP:ETH just flashed a GOLDEN CROSS on the 12H after months of bleeding!
Last time we saw a DEATH CROSS, #Ethereum crashed -57%.
Now it's doing the opposite — this could be the start of a massive pump! 🚀
TARGET? Maybe $3,800-$5000+ soon! 📈
Will Bitcoin Test $65000 level soon ?🚨 #BTC/USDT SMC Update and Fresh Analysis 🚨
Our previous short setup played out perfectly with a solid -21% move from the $94,000 region, catching the local top and dumping all the way to $75,000.
What’s next?
From a Smart Money Concepts (SMC) perspective, current PA suggests another local top might be in.
🔹 Bearish Order Block just got tapped
🔹 Strong Resistance seen near the $86,000 level
🔹 Price forming LL (Lower Low) and LH (Lower High) structure
If this setup plays again, we may see a new low below $75,000.
Key Level to Watch:
If a HTF candle closes above $88,200, the short thesis is invalidated — and in that case, we may be looking at a bullish continuation toward the $100,000 zone.
Reminder:
Don’t enter blindly. Wait for confirmations and respect risk management—protect your capital at all costs.
