Intraday Long Setup | Oct 26th 2025 | Valid Until Daily ClosePrice might retrace to a strong pivot zone.
Structure remains bullish with potential for continuation after pullback.
Tight risk control.
Watch for price reaction within the red zone. Entry only if confirmation appears
The setup expires at end of the daily candle close.
Cryptotrading

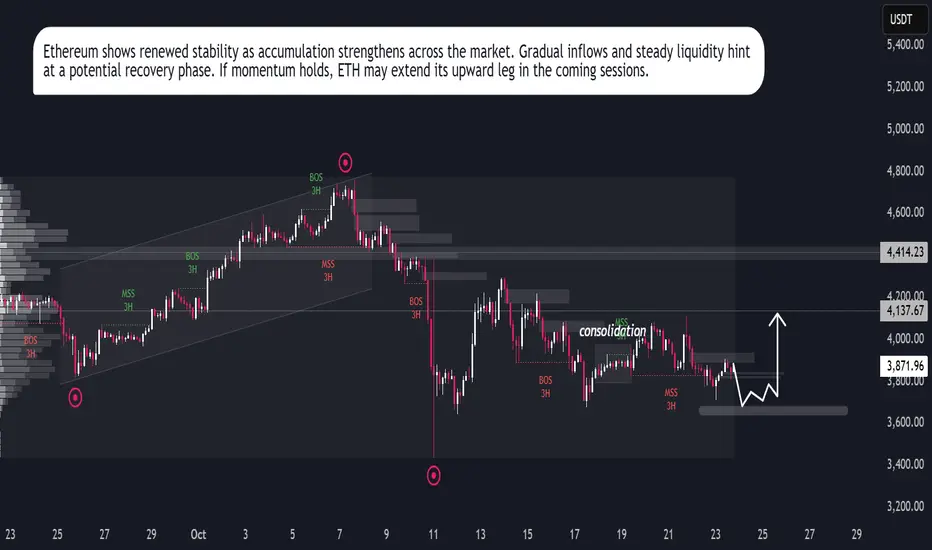
ETH Eyes Upside RunEthereum shows signs of regaining strength after a prolonged corrective phase. The asset is currently stabilizing, supported by gradual inflows from institutional participants and renewed investor accumulation. Market behavior indicates controlled volatility, suggesting a preparation phase before a potential expansion.
Network data reflects consistent transaction activity, while liquidity concentration hints at sustained participation from long-term holders. The recent stabilization in funding rates and improved open interest add weight to the recovery outlook.
If momentum continues to build under these conditions, Ethereum could enter a structured growth cycle in the coming sessions.
Bitcoin – Buying the Trendline, Not the HypeBitcoin (BTCUSD) continues to respect its rising trendline structure , showing consistent demand on every retest. This type of price action often reveals where smart money is quietly adding positions, not chasing, but accumulating near support.
Each of the highlighted points shows how price has respected this trendline multiple times, forming a clean series of higher lows. As long as this level holds, the broader direction remains bullish.
Currently, BTC is testing this key support once again. I’m positioning near the trendline because the risk is clearly defined , and the potential reward toward 111K+ remains wide open.
Short-term volatility can still appear, but structure beats emotions . As long as buyers defend this zone, we may see another impulsive leg forming soon.
Disclaimer: This analysis is for educational purposes only. It’s not investment advice. Always do your own research before trading.

Bitcoin Market Preparing for Upside MoveBitcoin is currently stabilizing after a sharp corrective phase.The market is showing early signs of demand re-entry near the liquidity base,indicating potential exhaustion of selling pressure.Recent structural reactions hint that buyers are preparing to reclaim control,which could initiate a short-term recovery leg toward the mid-range inefficiency zone.If momentum sustains,Bitcoin may expand higher,confirming a potential buy phase aligned with institutional accumulation signals.Overall,the outlook remains cautiously bullish as long as the market holds above its newly formed demand area.

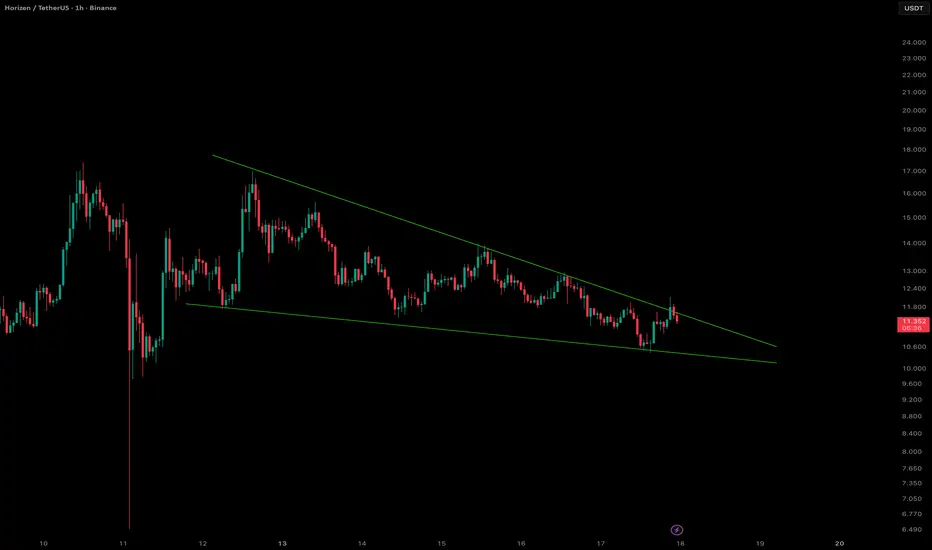
ZENUSDT Breaking Out of the Falling Wedge??HORIZEN (ZENUSDT) Analysis - 1 Hour Time Frame
Looks like ZEN is trying to break out of the falling wedge pattern. A candle close with decent volume or a successful retest above the falling wedge could confirm the bullish breakout.
In any case, Iam keeping an eye on this one, added to my watch list.
Dont forget to like and follow me to for more trade opportunities.
Crypto Trading Feels Like a Game – But It’s a Psychological War!Hello Traders!
Let’s be honest, trading crypto feels thrilling. Charts move fast, screens flash green and red, and every click feels like a win or loss in a video game.
But the truth is, this isn’t a game. It’s a psychological war , against greed, fear, and your own impulses.
Only those who master their minds survive long enough to win the real rewards.
1. The Illusion of Control
In games, you control the outcome, skill equals victory.
In trading, you control only your actions not the result.
Many traders lose because they think they can “beat” the market like a boss level.
You can’t control outcomes, but you can control decisions. That’s where real skill begins.
2. Emotional Triggers Are the Real Opponents
Greed makes you overtrade.
Fear makes you exit early.
Ego makes you hold losses longer than you should.
Every emotional decision takes you one step further from rational trading. The market punishes impatience, not intelligence.
3. The Endless Loop of Dopamine
Winning a trade releases dopamine, the same chemical that games and gambling use to keep you hooked.
This is why traders often feel “addicted” even when losing.
The key is not avoiding dopamine, but managing it through discipline and routine.
4. How to Turn the Game Into a Profession
Set clear rules and stick to them like a professional athlete follows training.
Don’t chase trades, wait for setups that fit your plan.
Detach emotions from results. Treat losses as tuition fees, not failures.
When you start thinking like a risk manager instead of a gamer, everything changes.
Rahul’s Tip:
The market doesn’t reward excitement, it rewards patience and control.
Every trader is fighting the same battle, but only those who master psychology turn chaos into consistency.
Conclusion:
Crypto trading might look like a game with flashing charts and instant rewards, but in reality, it’s a war within yourself.
Winning here isn’t about beating others, it’s about mastering your reactions when emotions take over.
If this post gave you a reality check, like it, share your thoughts in comments, and follow for more deep trading psychology lessons!
Ethereum Accumulation Before BreakoutEthereum has regained bullish momentum after a recent correction phase, supported by improving sentiment in the broader crypto market. The asset is displaying early signs of stabilization as traders begin accumulating around value zones, indicating renewed confidence among market participants.
From a macro perspective, Ethereum continues to benefit from increasing network activity, particularly within the DeFi and Layer-2 ecosystems. The sustained growth in on-chain transactions and staking participation reflects long-term investor interest, adding strength to the current recovery phase.
Market data also shows that institutional inflows into major crypto assets are on the rise, with Ethereum standing out due to its strong fundamentals and ecosystem resilience. This inflow supports the likelihood of a continued price rebound, as liquidity and trading volume remain consistent.
Overall, ETHUSDT is showing a constructive recovery setup. The combination of improving sentiment, strong fundamentals, and gradual accumulation suggests a potential medium-term bullish continuation, provided global market conditions remain favorable.

FOMO Trading – The #1 Killer in Crypto Market!Hello Traders!
Every bull run, the same story repeats, people buy when prices are high, panic when they drop, and wonder why they always lose.
It’s not the strategy or the market that fails, it’s FOMO (Fear of Missing Out) .
FOMO is the most powerful psychological trap in the crypto world, and it silently destroys more accounts than any other mistake. Let’s break it down.
1. What is FOMO in Trading?
FOMO happens when you see others making profits, and you jump in late out of fear of missing out.
You don’t analyze, you react emotionally.
By the time you buy, smart money is usually exiting, leaving you to hold the bag.
2. How FOMO Starts
Social media hype, influencer tweets, or fast-moving green candles create excitement.
Your brain says, “I’m missing this move, I need to enter now.”
That emotion makes you forget your plan, position sizing, and stop loss.
This is exactly when professionals take advantage, because they know retail is chasing.
3. The FOMO Cycle
You see price pumping → You buy high.
Price drops → You panic and sell low.
Price recovers → You feel regret and chase again.
Repeat, until your capital is gone.
4. How to Break the FOMO Habit
Remind yourself: the market will always give another opportunity.
Set rules, if a trade has already moved 5–10% without you, skip it.
Focus on setup quality, not speed.
Plan your trades when the market is calm, not when your heart is racing.
Rahul’s Tip:
The best traders are not the fastest, they’re the most patient.
Every missed trade teaches discipline; every forced trade teaches pain. Choose your lesson wisely.
Conclusion:
FOMO is not just a bad habit, it’s emotional trading disguised as “opportunity.”
The moment you stop chasing, your trading transforms from desperate to disciplined.
In crypto, the patient trader always outlasts the impulsive one.
If this post helped you see how FOMO affects your trading, like it, share your thoughts in comments, and follow for more real-world trading psychology insights!

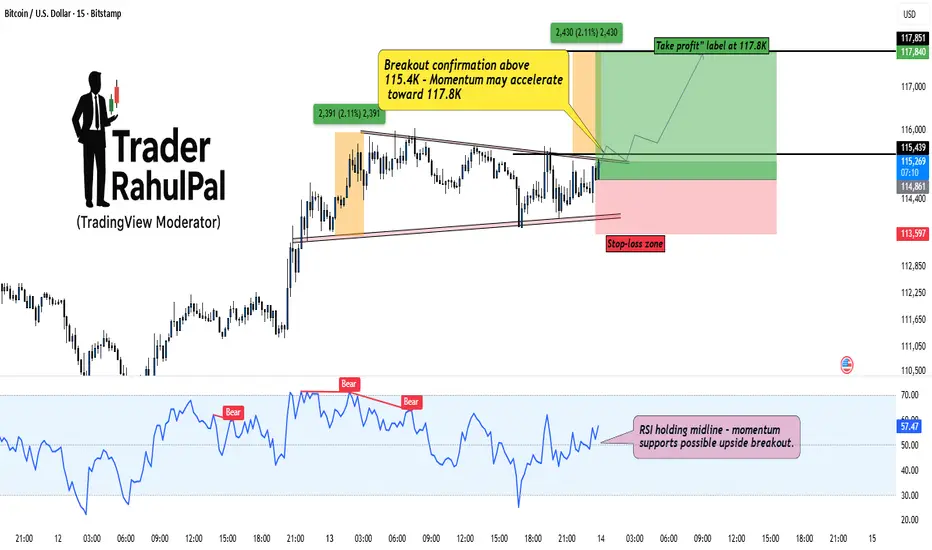
BTC – Building Discounted Longs Before the Breakout?Bitcoin (BTCUSD) is currently consolidating within a tight compression zone, showing signs of accumulation near 114.8K–115.4K . The market is coiling up right under resistance, hinting that a potential breakout could be around the corner.
As seen on the chart, structure remains bullish with a well-defined base and higher low formation. The key breakout confirmation lies above 115.4K , which could trigger a momentum push toward 117.8K , aligning with previous swing projections.
However, I’m personally building a small discounted entry position even before the confirmed breakout. The reason? When momentum starts expanding, it rarely gives clean entries, so catching early positioning near support provides better R:R potential.
RSI is holding above the midline, reflecting sustained buyer strength, while volume compression suggests a volatility expansion phase ahead. If price manages to sustain above the upper trendline, expect quick upside continuation.
Stop-loss remains below 113.6K to stay protected against fakeouts.
Rahul’s Tip:
Smart money often positions early when the crowd hesitates — timing matters, but conviction matters more.
Analysis By @TraderRahulPal (TradingView Moderator)
If this helped you spot the setup early, like and follow for more real-market insights.
Disclaimer: This analysis is for educational purposes only and should not be taken as financial advice. Please do your own research or consult your financial advisor before investing.
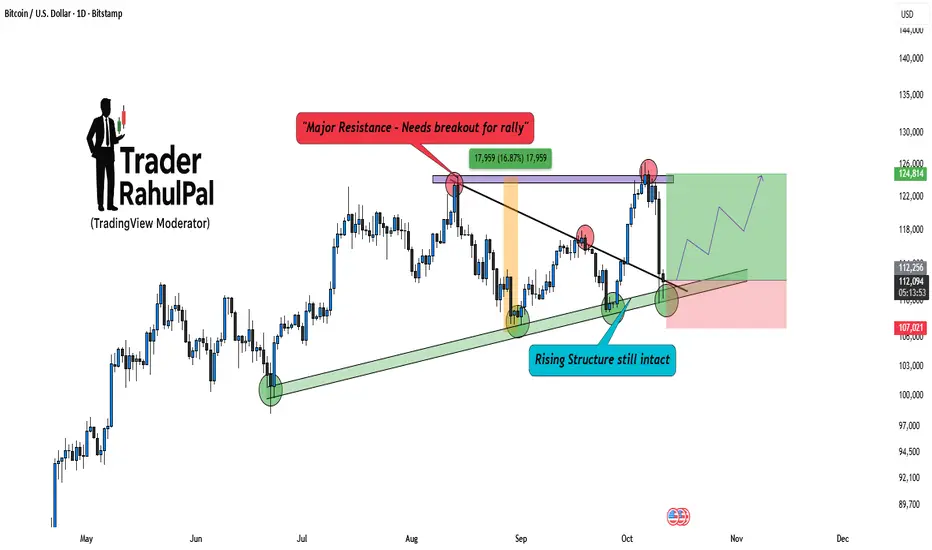
Bitcoin – Rising Structure Still Intact, Bulls Aren’t Done YetBitcoin (BTCUSD) continues to respect its rising structure , even after a sharp pullback from the resistance zone near 125K. While short-term traders might see this as weakness, price action tells a different story, the overall structure is still intact and favors the bulls.
Notice how BTC once again bounced from the ascending trendline support, confirming that institutional buyers are still active around these zones. The recent rejection was from a well-defined major resistance area , but as long as Bitcoin holds above the rising support band, the bias remains positive.
A breakout above 125K will open the doors for another impulsive leg toward 130K+ levels . On the downside, any sustained drop below 107K could temporarily shift momentum, but so far, there’s no structural damage visible.
Analysis By @TraderRahulPal (TradingView Moderator)
If this structure analysis helped you, like and follow for more insights on BTC’s long-term cycles.
Disclaimer: This analysis is for educational purposes only and should not be taken as financial advice. Please do your own research or consult your financial advisor before investing.
Bitcoin Correction = Smart Money Opportunity, ready for 3% move!Bitcoin (BTCUSDT) has been consolidating inside a well-defined descending channel , reflecting a healthy correction phase after the recent rally. While many traders panic in these phases, experienced players know that corrections are temporary, structures define direction.
Notice how price is approaching a key zone between 117K–116K, which aligns perfectly with both the lower channel boundary and the prior breakout retest zone. This area acts as a high-probability reversal zone , where strong hands are likely waiting for confirmation candles to re-enter the trend.
Psychologically, the 120K round level remains crucial. Expect volatility near this zone, as retail traders get trapped while smart money positions itself quietly before the breakout.
Once the breakout sustains above 121K, short-term traders could target levels around 122.5K–123K , while positional traders may aim for much higher structural targets.
Rahul’s Tip:
Never fear a pullback when structure stays intact, institutions use these dips to accumulate while the public exits too early. Stay patient, let the structure play out.
Analysis By @TraderRahulPal (TradingView Moderator)
If this breakdown and re-entry logic helped you, don’t forget to like and follow for regular updates.
Disclaimer: This analysis is for educational purposes only and should not be taken as financial advice. Please do your own research or consult your financial advisor before investing.

SOL | Network Strength Meets Market MomentumSolana (SOLUSDT) continues to show resilience as both technical and fundamental factors align for potential upside. On the technical side, the market has completed a controlled correction phase, suggesting liquidity buildup below recent lows. The structure remains bullish, with increasing volume and price stability hinting that buyers are regaining control. Fundamentally, Solana’s network growth and strong developer activity have reinforced investor confidence, supported by rising on-chain activity and ecosystem expansion in DeFi and NFTs. This combination of solid fundamentals and technical structure indicates the possibility of another bullish leg, with SOL positioning itself for a gradual climb toward the $240–$250 range in the near term.

Bitcoin – Rising Higher, But the Real Battle Is Yet to Begin!Bitcoin continues to trade inside a rising structure , respecting both its long-term support and resistance channels. The trend remains healthy as long as price holds above the 116,000–116,500 support zone , which has been tested multiple times with strong buying reactions.
Currently, BTC is approaching a major resistance confluence zone . The chart clearly shows that every previous rejection near this zone has led to profit-booking, but this time the structure looks different, buyers are more confident, and momentum is building from the base levels .
If Bitcoin manages to sustain above the minor resistance area , the road opens towards 131,500 levels and beyond . However, traders should remember, such breakouts demand patience, not prediction. The stronger hands will always think in cycles, not candles .
The psychology of the market here is simple: every pullback to the rising support attracts accumulation by smart money , while emotional traders exit too early. This phase often separates investors from speculators.
Rahul’s Tip : Don’t fear the dips. Fear missing the structure that defines the entire bull leg. If the support holds, this could be the foundation of the next major BTC wave.
Disclaimer: This analysis is for educational purposes only and should not be taken as financial advice. Please do your own research or consult your financial advisor before investing.
Analysis By @TraderRahulPal (TradingView Moderator) | More analysis & educational content on my profile
👉 If you found this helpful, don’t forget to like and follow for regular updates.

BTC/USD Analysis: Bullish Continuation in FocusBitcoin continues to demonstrate strength following its recent recovery. After periods of consolidation and controlled retracement, the market shows clear signs of accumulation, with buyers maintaining momentum. Each upward leg has been supported by liquidity absorption, reflecting steady confidence in higher valuations.
The current structure suggests that even if retracements occur, they are likely to serve as a foundation for further expansion. Market behavior highlights resilience, with the broader trend still pointing toward bullish continuation. Bitcoin remains positioned for progressive growth, with sentiment and structure both aligning in favor of buyers.

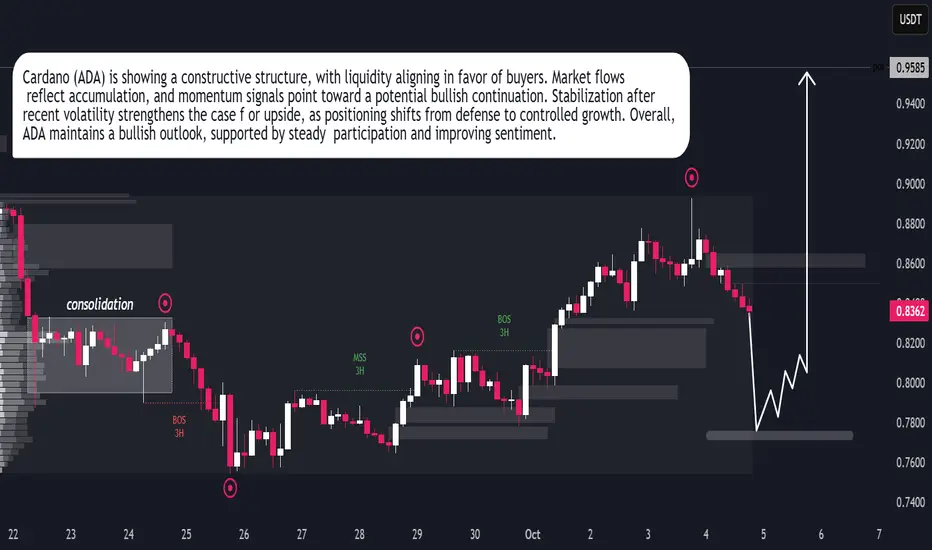
Cardano (ADA) Ready for Bullish ExpansionCardano (ADA) Ready for Bullish Expansion
Cardano (ADA) is building strength as market conditions favor accumulation over distribution. Liquidity behavior shows steady inflows, suggesting participants are positioning for upward continuation. The recent stability reflects confidence, with sentiment gradually tilting toward growth. Momentum indicators align with this view, reinforcing the prospect of a bullish expansion phase. ADA’s structure signals resilience, and the market tone supports the case for sustained upside in the near term.
XRP Price Action – Accumulation Before GrowthXRP is currently navigating a phase defined by liquidity-driven swings and rapid sentiment shifts. After the market endured a heavy decline, buyers have re-emerged, showing resilience through aggressive rebounds. This behavior reflects a deeper pattern: sellers are losing efficiency in driving the market lower, while buyers are treating each dip as an opportunity to accumulate.
In the short term, the market appears to be balancing between two forces — the need for a corrective retracement to secure liquidity, and the desire of participants to push price into higher zones. This tug-of-war often results in shallow pullbacks, where temporary declines are quickly absorbed. Such behavior highlights that speculative capital is rotating back into XRP, aligning with broader risk-on sentiment across digital assets.
If this pattern holds, the near-term trajectory favors gradual expansion, with the asset likely aiming for higher valuations. However, investors should remain aware that short-term corrections are less about trend reversals and more about the mechanics of liquidity collection.

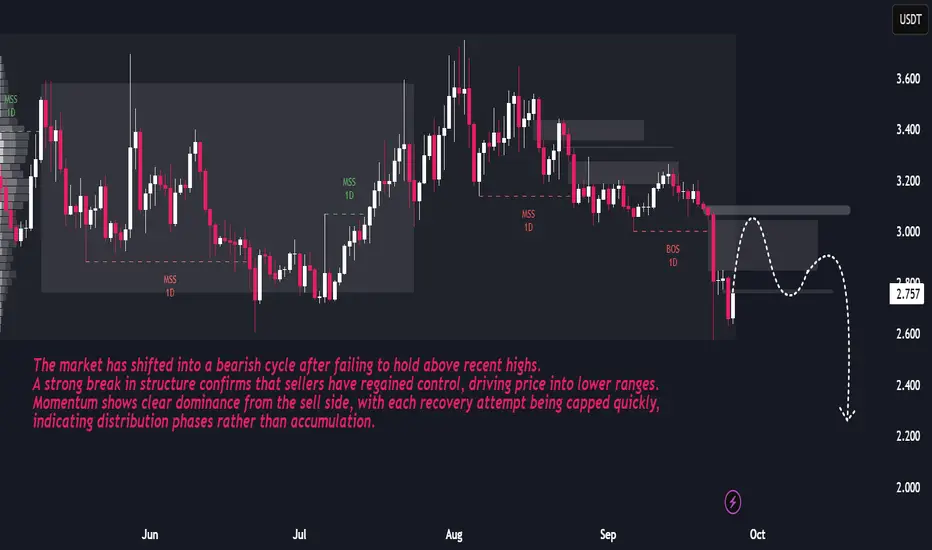
Toncoin Market Report: Bearish Pressure vs Potential ReboundThe market has entered a clear distribution phase after repeated failures to sustain higher levels. Recent structure shifts on the daily timeframe highlight strong bearish control, with downside momentum accelerating as buyers continue to lose strength. The sharp breakdown signals that liquidity has shifted toward lower zones, creating pressure for further declines.
While short-term rebounds may emerge, these are more likely to serve as corrective pullbacks rather than true trend reversals. The overall flow indicates that sellers remain in command, and price is expected to gradually seek lower value areas as part of an extended bearish cycle
BTC Crashes to 3-Week Low: A True Nerve Test for TradersHello fellow traders, Bitcoin has entered an extremely tense phase!
BTC has slipped below 109,000 USD, marking its lowest point in three weeks. The main pressure comes from the looming expiry of a massive 22-billion-USD options contract at the end of the month, which is driving strong short-term selling.
On the daily chart, prices keep getting rejected at the downtrend line and the Ichimoku cloud, confirming that bears still hold the upper hand.
The current scenario points to further downside, with key support zones at 104,000 USD (TP1) and 98,900 USD (TP2).
These are the critical “do-or-die” levels to watch closely — only if BTC manages to hold above them can we expect a recovery once the options-driven selling pressure eases.
In short: Bitcoin is at a make-or-break moment. Traders, keep your stops tight and stay alert!

ETHUSDT: Strong Uptrend with Solid SupportETHUSDT is currently experiencing a strong uptrend driven by the stability of the cryptocurrency market and strong fundamental factors. Despite some recent pullbacks, the primary trend remains bullish, supported by a solid foundation and positive investor sentiment.
Technical Analysis: ETHUSDT is currently testing a key support level at 3,985. If this level holds, there is a high probability of a rebound and continued upward momentum. The next resistance level is expected at 4,215.
Trading Strategy: If the price stays above the support level at 3,985, ETH is likely to continue rising towards the next resistance levels.
Outlook: Given the current fundamentals and technical indicators, ETHUSDT is likely to maintain its upward trajectory and target the 4,215 resistance level in the near future.

BTC/USD: Bearish Trend After Flash Crash and Key NewsThe BTC/USD chart shows a strong bearish trend following the "flash crash" event and contract liquidations. Currently, BTC is moving within a downward channel with support levels at 110,300 USD and 108,000 USD.
News Impact:
Morgan Stanley to Offer Crypto Trading: Morgan Stanley’s partnership with Zerohash to provide crypto trading on E*Trade could boost cryptocurrency acceptance, but it's not enough to reverse the bearish trend in BTC.
Fed Chairman Jerome Powell on Interest Rates: Jerome Powell's statements regarding the possibility of maintaining high interest rates have increased uncertainty, negatively impacting the cryptocurrency market.
Conclusion: The bearish trend of BTC/USD may continue. Traders should pay attention to support levels and stay updated with economic news to make informed trading decisions.

BTC/USDT Outlook – Volatility Rises After Sharp DeclineBTC/USDT Market Report
Bitcoin recently faced heavy selling pressure, pushing the market into a sharp decline. This drop reflects a shift in sentiment where earlier stability has been replaced by increased volatility and downside momentum.
Price action shows signs of exhaustion after the fall, suggesting the possibility of a short-term rebound attempt. However, broader behavior still reflects uncertainty, with buyers needing stronger participation to shift momentum back in their favor.
If downward pressure continues, deeper corrections could emerge before any meaningful recovery. In the near term, traders should expect sharp swings as the market tries to stabilize.

Solana Price Forecast | SOLUSDT Market OutlookSOLUSDT has completed a strong upward cycle and is now unwinding through a structured retracement. This phase is not showing disorderly selling but rather a controlled reset, where liquidity is being cleared to prepare for the next expansion.
The chart reflects a market that is cycling through accumulation, breakout, and pullback phases with consistency. Current downside movement is shaping a foundation zone that could serve as the springboard for renewed upward momentum.
Overall, the asset is displaying a constructive trajectory: corrections are functioning as fuel rather than weakness, pointing toward continuation of its broader growth path once this reset stabilizes.

BTC Price Action: Bulls vs BearsBTC Price Action: Bulls vs Bears
Bitcoin has shown a gradual recovery after a prolonged corrective phase, with market structure leaning toward a constructive buildup. Fundamentally, sentiment is influenced by global macro conditions—investors are watching U.S. monetary policy signals, while stable demand from institutions and long-term holders continues to provide a supportive backdrop. On-chain activity remains steady, with balanced exchange inflows and outflows suggesting no extreme directional pressure in the near term.
From a technical perspective, the market has shifted momentum from bearish flows into a developing bullish sequence. The recent break of structure on the 4H timeframe highlights strengthening upside intent, though price is still moving within a broader accumulation phase. Current flows suggest the possibility of a short-term dip for liquidity before continuation to higher levels, aligning with the overall constructive weekly outlook.
