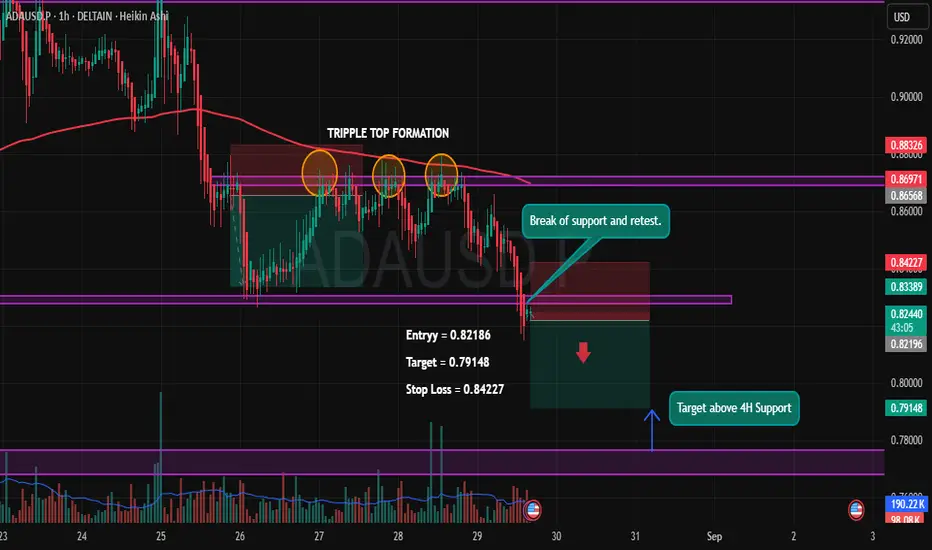
ADA/USDT – Triple Top Breakdown Play🔎 Setup Insight:
ADA has formed a Triple Top pattern near the 0.869 zone, confirming strong rejection from resistance. After multiple failed attempts to break higher, price finally broke down key support and is now retesting it, giving a clean short opportunity.
✨ Trade Plan:
Entry: 0.82186
Target: 0.79148 (Above 4H support zone)
Stop Loss: 0.84227
✅ Reasons for Short Bias:
Triple Top Formation ➝ Strong bearish reversal signal.
Break & Retest of Support ➝ Previous demand now acting as supply.
Confluence with 200 EMA rejection ➝ Trend remains bearish.
Volume Confirmation ➝ Selling volume stronger than buying.
🎯 Targeting the next major support on the 4H timeframe, with a favorable Risk-Reward setup.
⚠️ Disclaimer: This analysis is for educational purposes only and not financial advice. Always manage your risk before entering any trade.
Cryptotrading
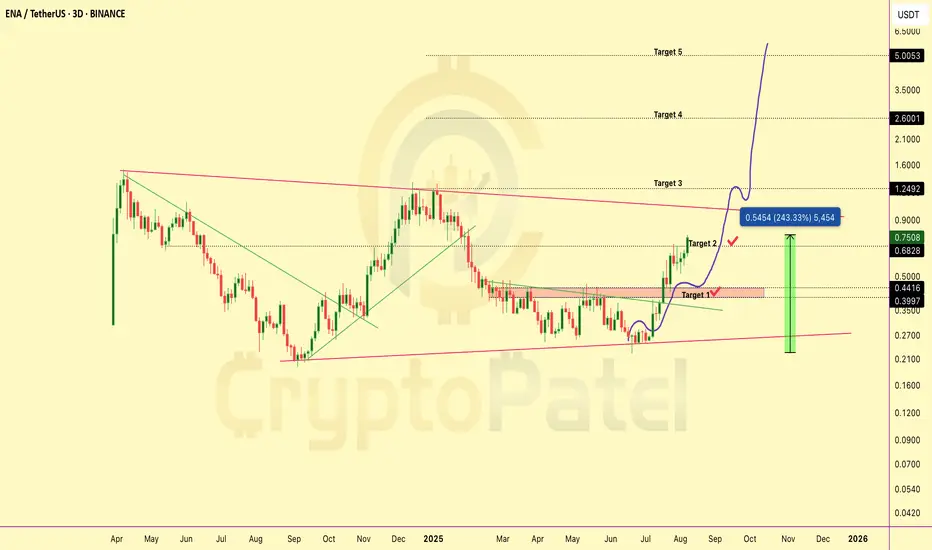
$ENA Up 243% From My $0.25 Entry And I’m Still BullishMIL:ENA Up 243% From My $0.25 Entry And I’m Still Bullish
Now MIL:ENA is trading at $0.75 and up 243% from our $0.25 entry ✅
TP1 and TP2 hit ✅ and I’m still super bullish, eyeing $1 / $2 / $5 next.
But remember, Greed has no limits.
Smart traders book partial profits and ride the rest with house money.
NFA & DYOR
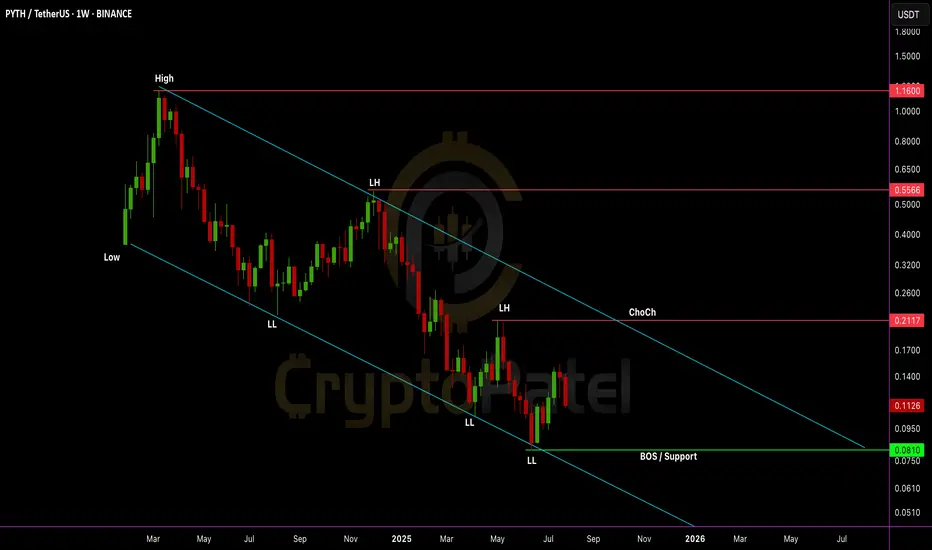
Will $PYTH go to $1 or drop even lower?Will EURONEXT:PYTH go to $1 or drop even lower?
Chart is still bearish with LL + LH structure.
But $0.0810 is a key level. If it holds, a trend reversal is possible. Accumulation zone: $0.085–$0.110
Risky entry, but R:R is huge. Hold = 10x potential to $1+
Break below $0.0810 = new LL incoming.
NFA & DYOR
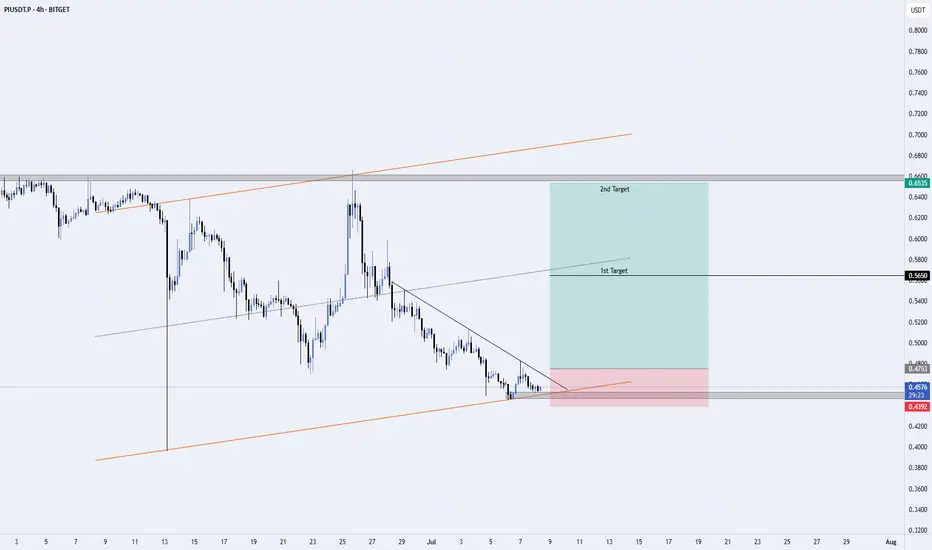
PIUSDT – Potential Long Setup from Ascending Channel Support (4HI’m watching PIUSDT closely as it approaches a significant confluence of technical levels on the 4-hour chart:
🔹 Key Highlights:
Ascending Channel Support: Price is testing the lower boundary of the channel (orange trendline).
Descending Trendline Resistance: Creating a wedge structure—breakout potential if momentum builds.
Bullish Structure: Clear rejection wicks and consolidation near support suggest accumulation.
✅ Trade Plan:
Entry Trigger: Confirmed breakout and close above the descending trendline.
Targets:
🥇 1st Target: 0.5650 (local resistance)
🥈 2nd Target: 0.6550 (major horizontal resistance)
Stop Loss: Below 0.4392 (breakdown invalidates the setup)
⚠️ Risk Management:
Always use proper position sizing and a disciplined stop loss. This setup is shared for educational purposes—do your own research before entering any trades.
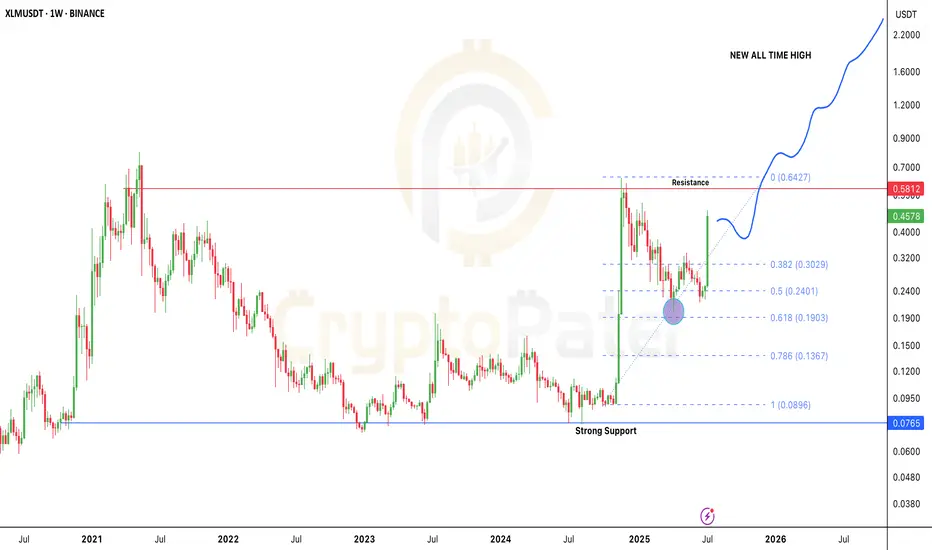
Stellar Breakout: Is $XLM the Next 10x Altcoin of 2025?After months of sideways action and accumulation, Stellar is finally showing real strength.
In the last 4 weeks alone, CRYPTOCAP:XLM has pumped over 120%, bouncing perfectly from the key 0.618 Fibonacci level near $0.19 — a classic reversal zone.
Here’s what’s really going on 👇
🔹 Back in Nov 2024, CRYPTOCAP:XLM went from $0.09 to $0.6374 in just 30 days — that’s a 600% move!
🔹 After that huge rally, price corrected nearly -68%, landing right at the golden Fib zone.
🔹 And guess what? Buyers stepped in hard, flipping the trend back to bullish.
Could we see a pullback?
Sure — maybe a small dip toward $0.30 (0.382 Fib). That’s normal. But the overall structure looks super bullish right now.
Major Resistance: $0.58
If that breaks and flips into support — we’re likely headed toward $2–$5 in the next wave.
This is one of the cleanest macro charts in the altcoin market right now.
👇 Drop your XLM target for this bull run in the comments!
Let’s see who’s aiming for the moon.
Note: DYOR & NFA
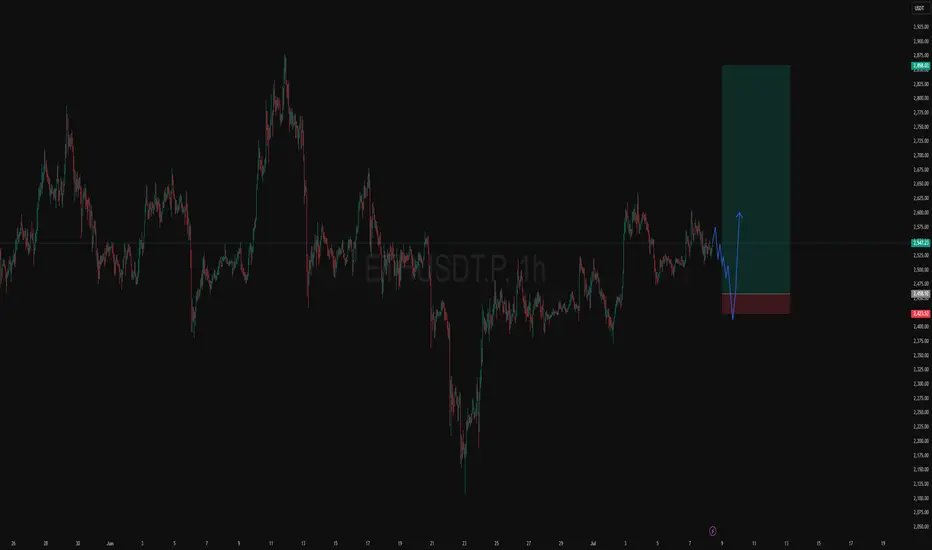
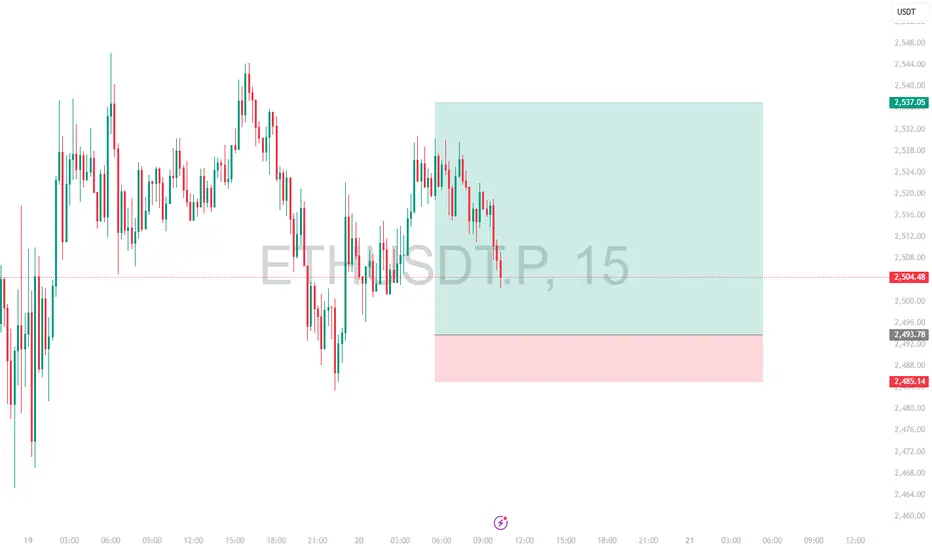
Weekly Long Setup | Jul 8th 2025 | Valid Until Weekly ClosePrice might retrace to a strong pivot zone (marked by the red box).
Structure remains bullish with potential for continuation after pullback.
The green box represents a high-probability long opportunity with tight risk control.
Watch for price reaction within the red zone. Entry only if confirmation (e.g., bullish engulfing, strong wick rejections) appears.
The setup expires at end of the weekly candle close.
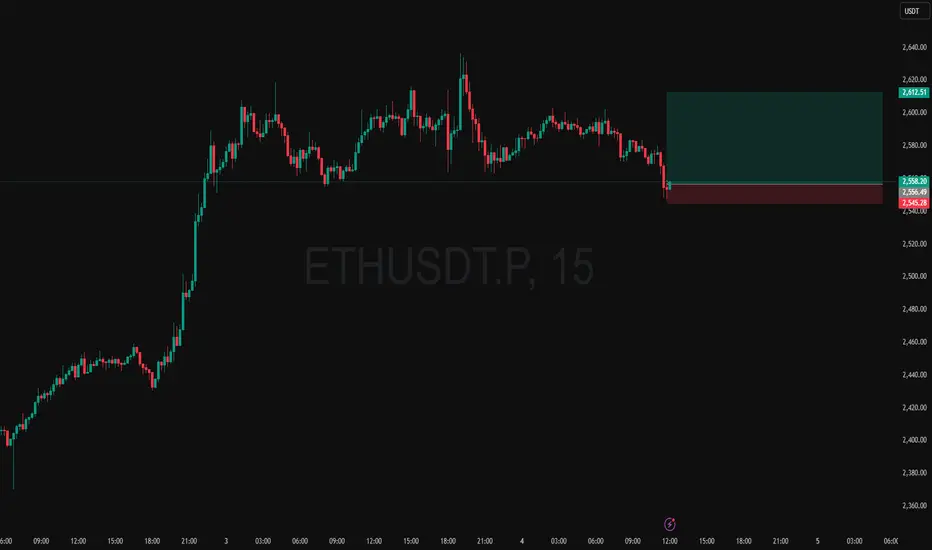
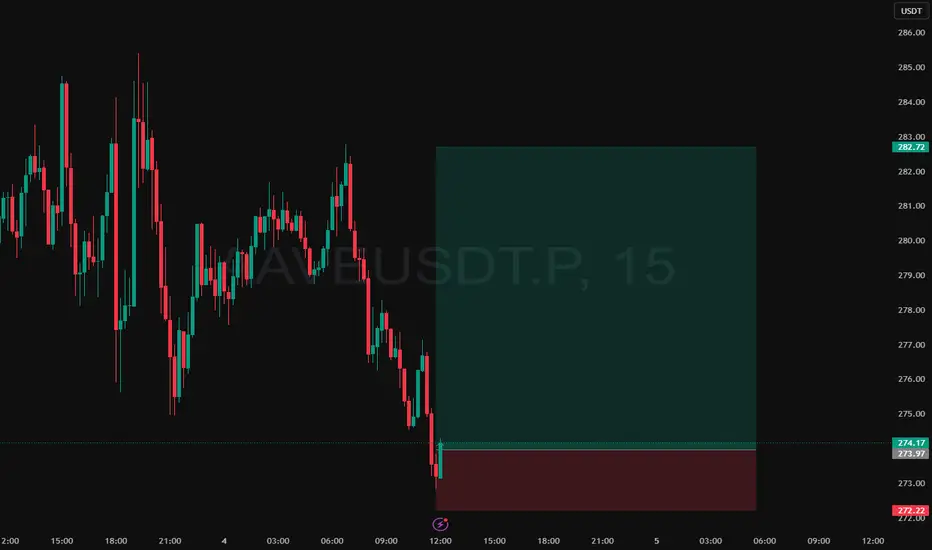
Intraday Long Setup | July 4th 2025 | Valid Until Daily ClosePrice retraced to a strong pivot zone.
Structure remains bullish with potential for continuation after pullback.
Tight risk control.
Watch for price reaction within the red zone. Entry only if confirmation appears
The setup expires at end of the daily candle close.
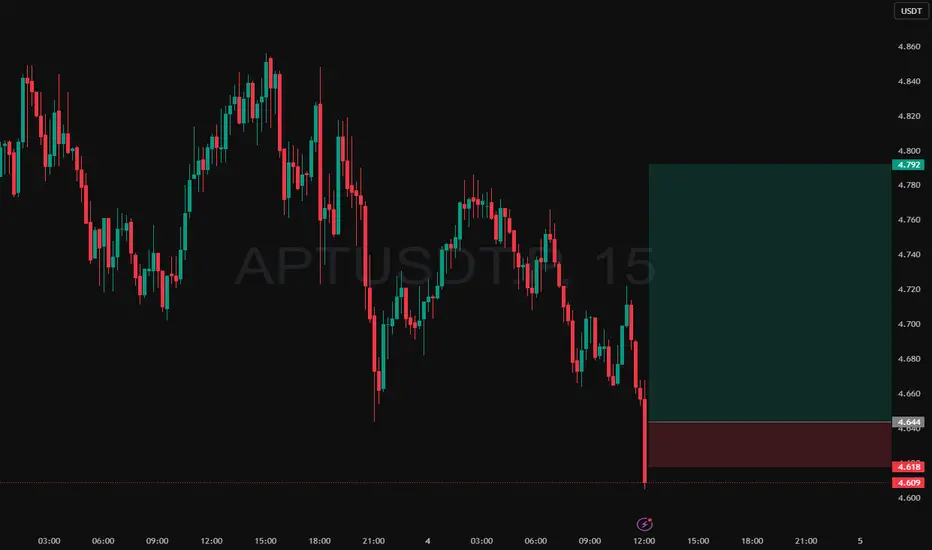
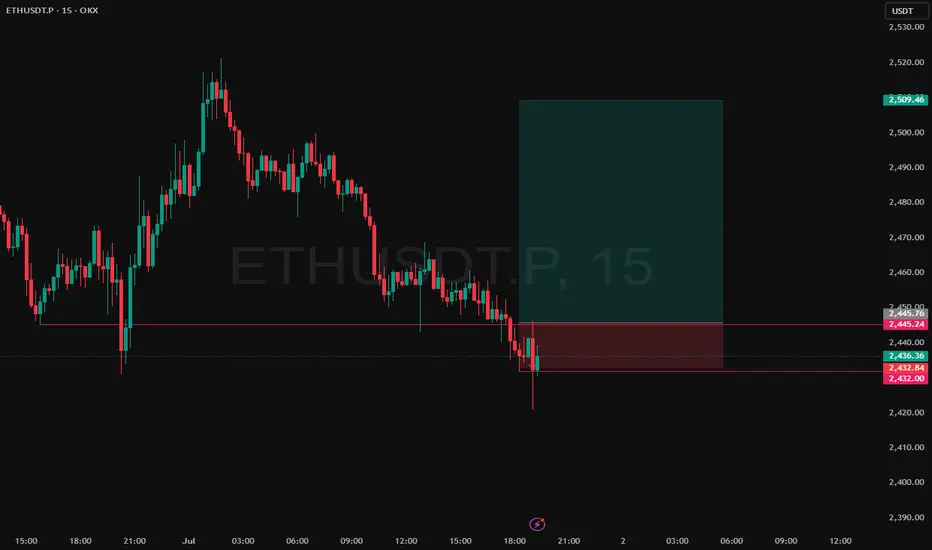
Intraday Long Setup | July 1st 2025 | Valid Until Daily ClosePrice retraced to a strong pivot zone.
Structure remains bullish with potential for continuation after pullback.
Tight risk control.
Watch for price reaction within the red zone. Entry only if confirmation appears
The setup expires at end of the daily candle close.
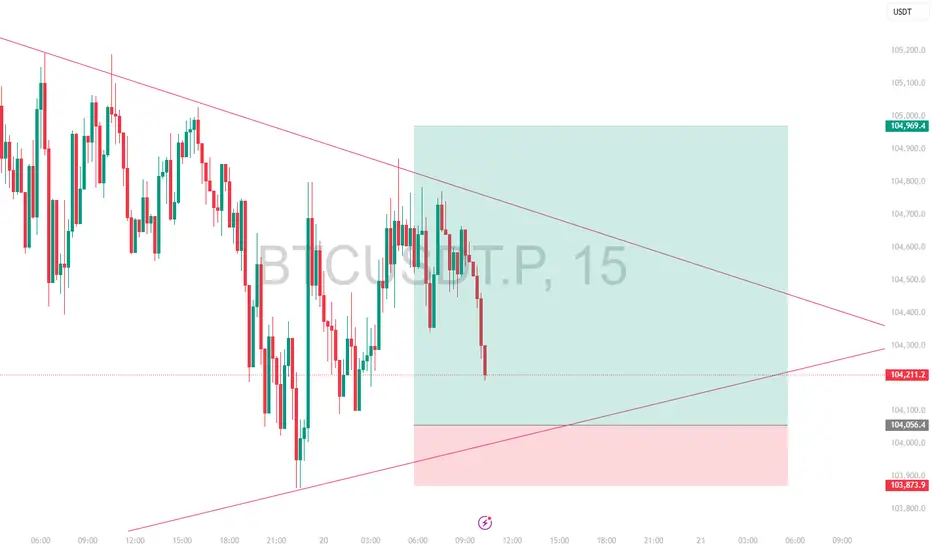
Shorting BTCUSD After Trendline Failure & Bearish RetestPlanning to short BTCUSD as price has rejected from the descending trendline resistance after breaking the minor ascending trendline support. The confluence of trendline rejection and bearish retest suggests potential downside continuation.
Entry Zone: ~107,300–107,350
Stop-Loss: Above 107,550 (recent high)
Target: 106,550 support area
Risk-to-Reward Ratio: ~1:2 (Min) 1:4 (Final Target)
Quote:
"Trendline confluence and failed bullish continuation often lead to deeper pullbacks."
📊 Summary of the Idea
✅Reason for Entry: Multiple rejections at trendline + structure breakdown.
✅Confirmation: Retest rejection candle.
✅Invalidation: A clean breakout and hold above the descending trendline.

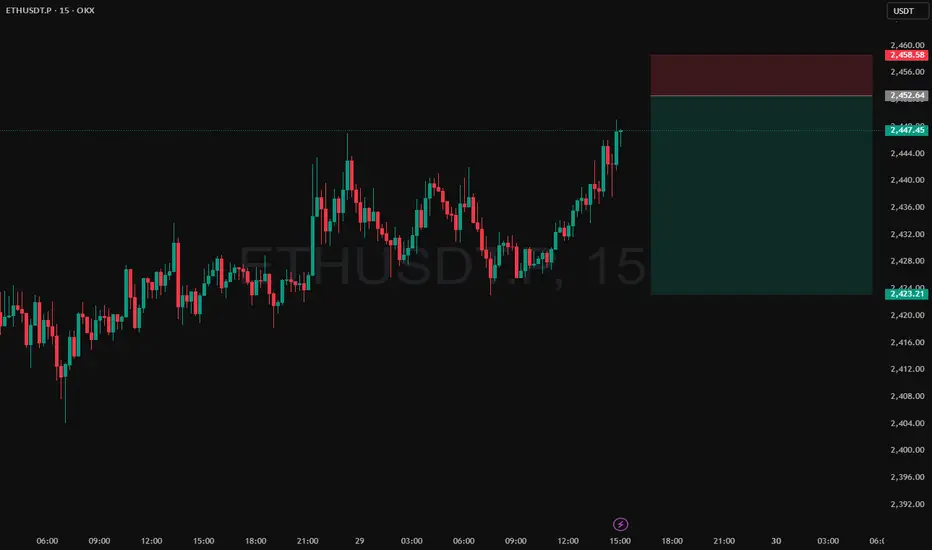
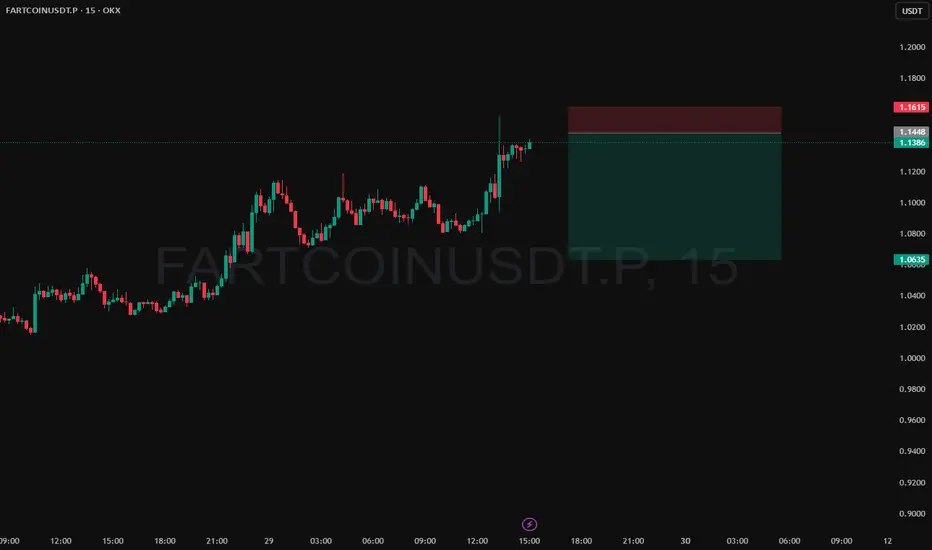
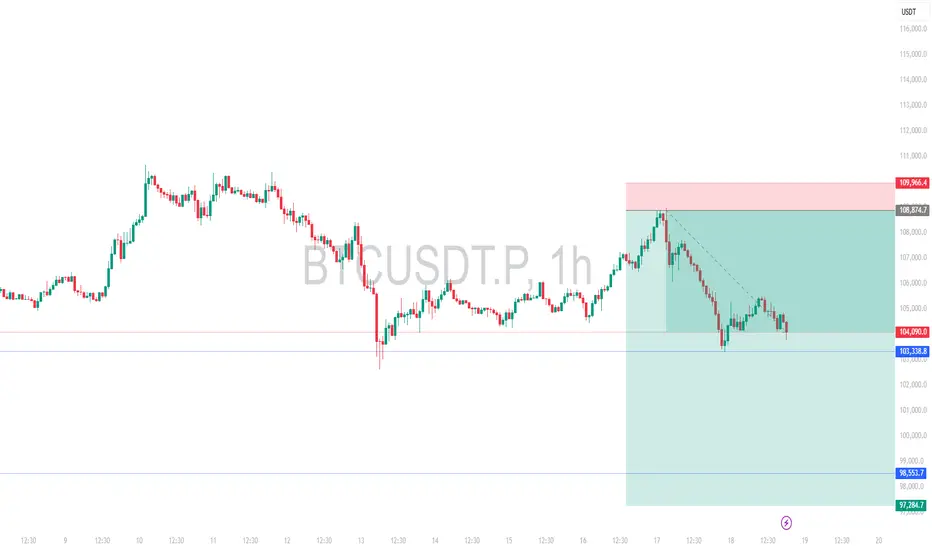
Intraday Short Setup | June 29th 2025 | Valid Until Daily ClosePrice has pushed into a potential intraday Pivot supply zone (red box) where sellers may step in. This trade is based on the expectation of a rejection from this area.
Entry: Red box — a short entry zone aligned with overhead supply
Stop Loss: Above the red zone (invalidates the setup)
Target: Green box — area to consider partial/full exit based on momentum
Risk-reward is favorable with a tight invalidation and clean downside target
Price may stall or reverse near the red box, creating short opportunity
Note:
This is an intraday trade idea that expires at 00:00 UTC (Daily Candle Close). Re-evaluate the setup if price remains indecisive near the entry zone close to that time.
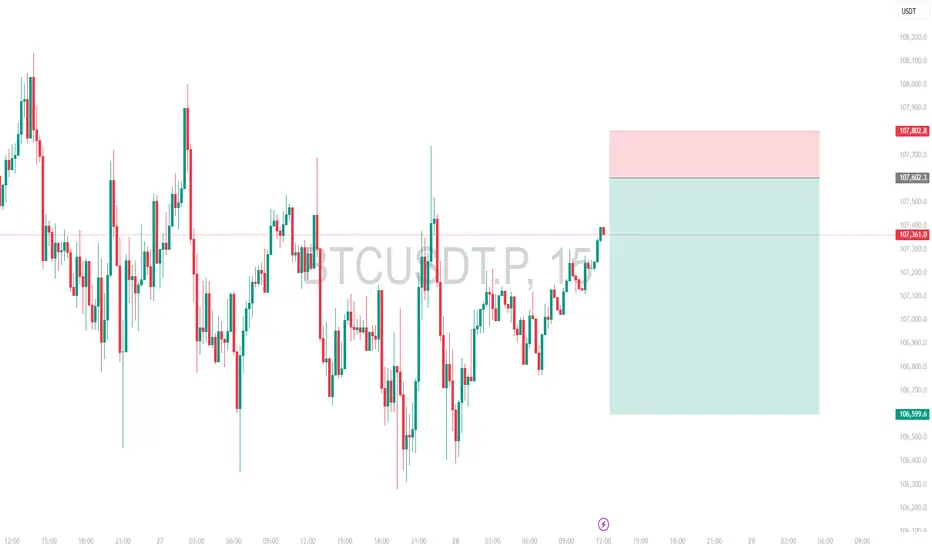
Intraday Short Setup | June 28th 2025 | Valid Until Daily ClosePrice has pushed into a potential intraday Pivot supply zone (red box) where sellers may step in. This trade is based on the expectation of a rejection from this area.
Entry: Red box — a short entry zone aligned with overhead supply
Stop Loss: Above the red zone (invalidates the setup)
Target: Green box — area to consider partial/full exit based on momentum
Risk-reward is favorable with a tight invalidation and clean downside target
Price may stall or reverse near the red box, creating short opportunity
Note:
This is an intraday trade idea that expires at 00:00 UTC (Daily Candle Close). Re-evaluate the setup if price remains indecisive near the entry zone close to that time.
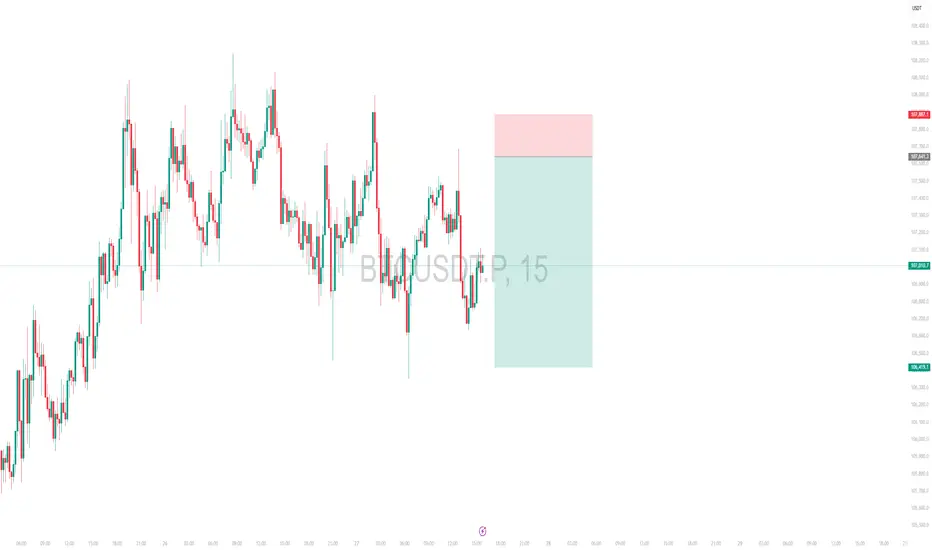
Intraday Short Setup | June 27th 2025 | Valid Until Daily ClosePrice has pushed into a potential intraday Pivot supply zone (red box) where sellers may step in. This trade is based on the expectation of a rejection from this area.
Entry: Red box — a short entry zone aligned with overhead supply
Stop Loss: Above the red zone (invalidates the setup)
Target: Green box — area to consider partial/full exit based on momentum
Risk-reward is favorable with a tight invalidation and clean downside target
Price may stall or reverse near the red box, creating short opportunity
Note:
This is an intraday trade idea that expires at 00:00 UTC (Daily Candle Close). Re-evaluate the setup if price remains indecisive near the entry zone close to that time.
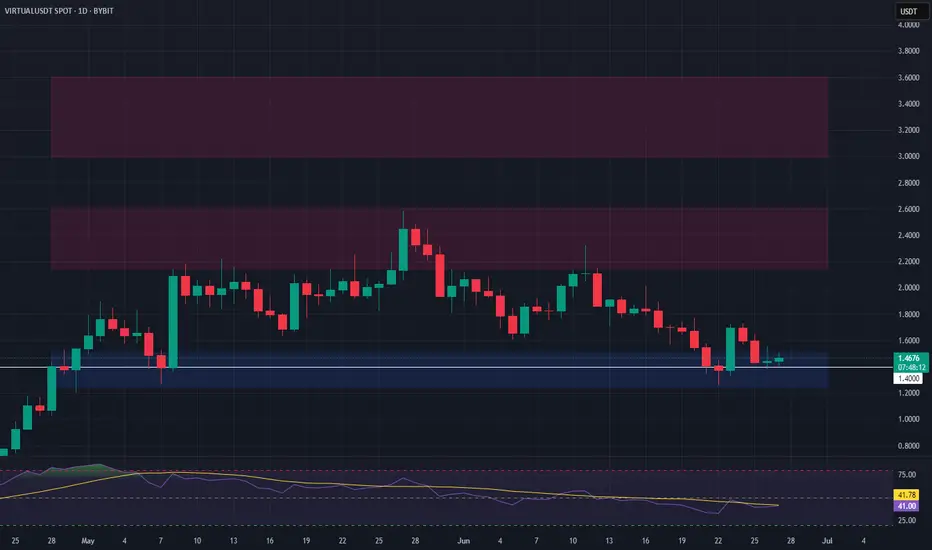
VIRTUAL Long Setup – Watching Key Support with BTC CorrelationVIRTUAL is approaching a major support zone, with a potential long spot entry dependent on Bitcoin stability. We’ll be looking to enter around the $1.50 level, provided it holds as support.
📌 Trade Setup:
• Entry Zone: Conditional on $1.50 holding as support
• Take Profit Targets:
o 🥇 $2.15 – $2.60
o 🥈 $3.00 – $3.60
• Stop Loss: Tight stop, daily close below $1.40
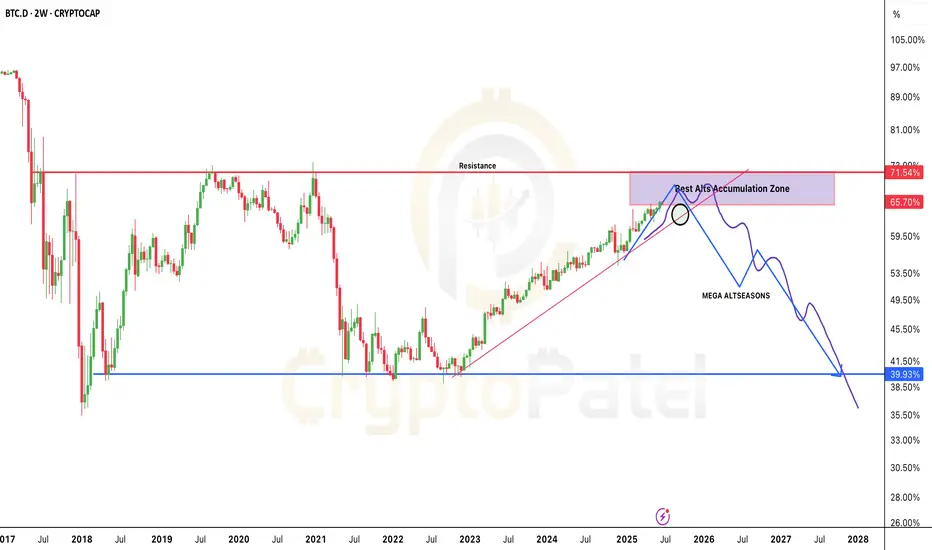
Ready for Big Altcoin season and Why?BREAKING: CRYPTOCAP:BTC Dominance is about to DUMP hard!
And that means one thing…
👉 A MASSIVE #Altseason is coming.
We’ve all been bleeding, waiting, questioning.
But this dip right now? It’s your golden ticket.
📉 Dominance is topping between 65%–72%
📈 Next stop? 40% — and altcoins will fly.
This is your chance to accumulate 10x–20x gems before the real move begins.
You may not see these prices again.
This is the final test of patience.
Survive now, thrive later.
Are you ready or still sleeping on alts?
Retweet if you're stacking.
NFA & DYOR
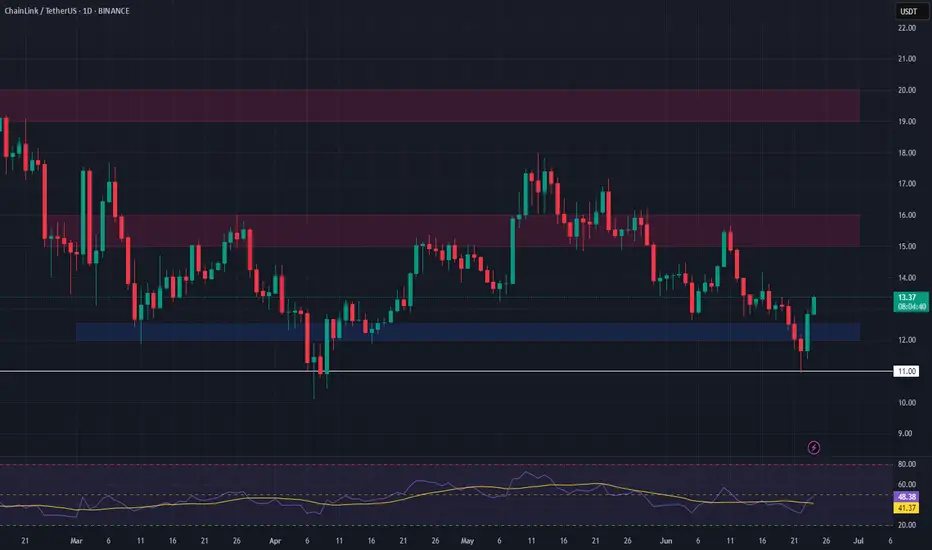
LINK Long Swing Setup – Higher Low Retest at Key SupportLINK has shown strong relative strength in recent weeks and is now retesting the $12 support zone. With broader markets stabilizing, this level could confirm a higher low and set the stage for continued upside.
📌 Trade Setup:
• Entry Zone: Around $12.00
• Take Profit Targets:
o 🥇 $15.00 – $16.00
o 🥈 $19.00 – $20.00
• Stop Loss: Daily close below $11.00
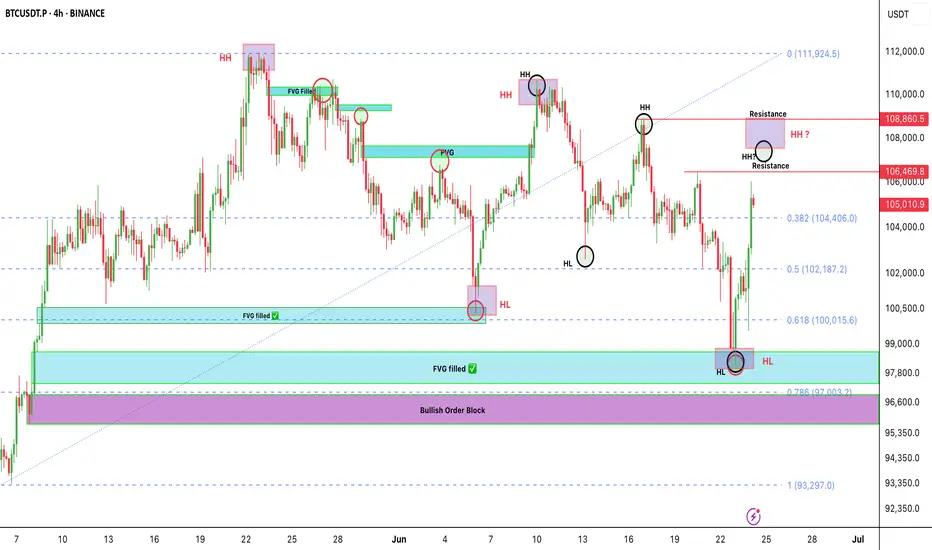
Bitcoin isn’t fully bullish yet — most people are falling for thBitcoin isn’t fully bullish yet — most people are falling for the trap
BTC just bounced beautifully from the $97.8K–$98K demand zone.
It tapped into key confluences:
✅ FVG filled
✅ 0.618-0.786 Fib level
🟪 Bullish Order Block just above 0.786
But let’s be real — we’re not in full bullish mode yet.
This looks more like a short-term pullback, not a trend reversal.
What I'm Watching Closely:
🔹 BTC is forming two HH & HL patterns.
🔹 Super important for us to track both — they’ll guide the next big move.
🟥 LTF last HH = $108,900
🟥 HTF last HH = $110,654
As long as BTC stays below these, the structure is still bearish.
We only flip bullish when candles break and close above them.
If Bullish Breakout happens? We’re eyeing new ATH targets toward $150K 🚀
My Plan Right Now:
🔹 Watching $107K & $109K levels for clean short setups.
Why?
👉 Low-risk entries
👉 Tight SL
👉 Big reward — Targeting around $100K
Stay alert, don’t chase. Let the levels come to us.
Let me know in the comments 👇 Are you flipping bullish, or still cautious?
NFA & DYOR
Weekly Long Setup | June 23rd 2025 | Valid Until Weekly ClosePrice is retracing to a strong pivot zone (marked by the red box).
Structure remains bullish with potential for continuation after pullback.
The green box represents a high-probability long opportunity with tight risk control.
Watch for price reaction within the red zone. Entry only if confirmation (e.g., bullish engulfing, strong wick rejections) appears.
The setup expires at end of the weekly candle close.

Weekly Short Setup | Valid Until Weekly CloseI have been in this trade for sometime now with first TP taken. Due to uncertainty globally, I am not posting any intraday charts.
Stay safe, save capital is the motto right now.
Note:
This is an weekly setup and idea that expires at Weekly Candle Close. Re-evaluate the setup if price remains indecisive near the entry zone close to that time.
Intraday Long Setup | June 20th 2025 | Valid Until Daily ClosePrice retraced to a strong pivot zone.
Structure remains bullish with potential for continuation after pullback.
Tight risk control.
Watch for price reaction within the red zone. Entry only if confirmation appears
The setup expires at end of the daily candle close.