Weekly Short Setup | Valid Until Weekly CloseI have been in this trade for sometime now with first TP taken. Due to uncertainty globally, I am not posting any intraday charts.
Stay safe, save capital is the motto right now.
Note:
This is an weekly setup and idea that expires at Weekly Candle Close. Re-evaluate the setup if price remains indecisive near the entry zone close to that time.
Cryptotrading
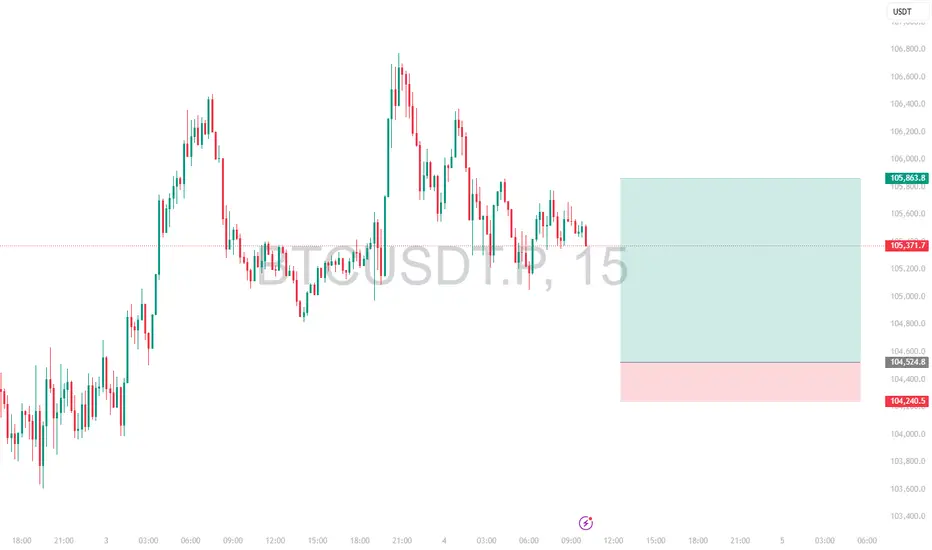
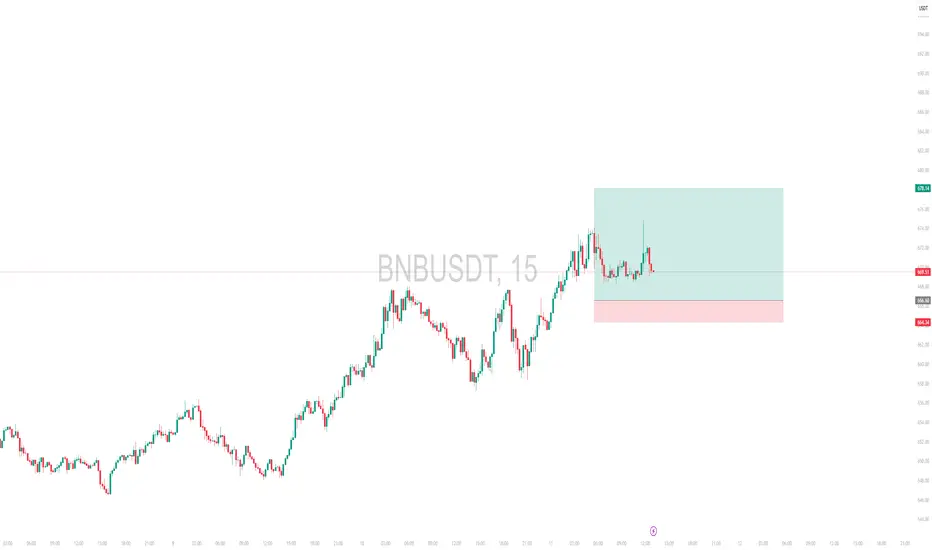
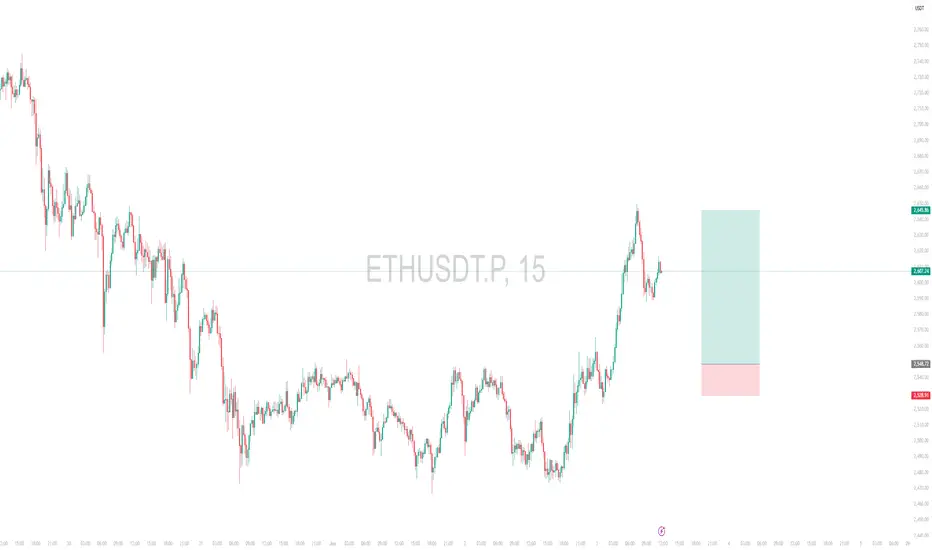
Intraday Long Setup | June 20th 2025 | Valid Until Daily ClosePrice retraced to a strong pivot zone.
Structure remains bullish with potential for continuation after pullback.
Tight risk control.
Watch for price reaction within the red zone. Entry only if confirmation appears
The setup expires at end of the daily candle close.
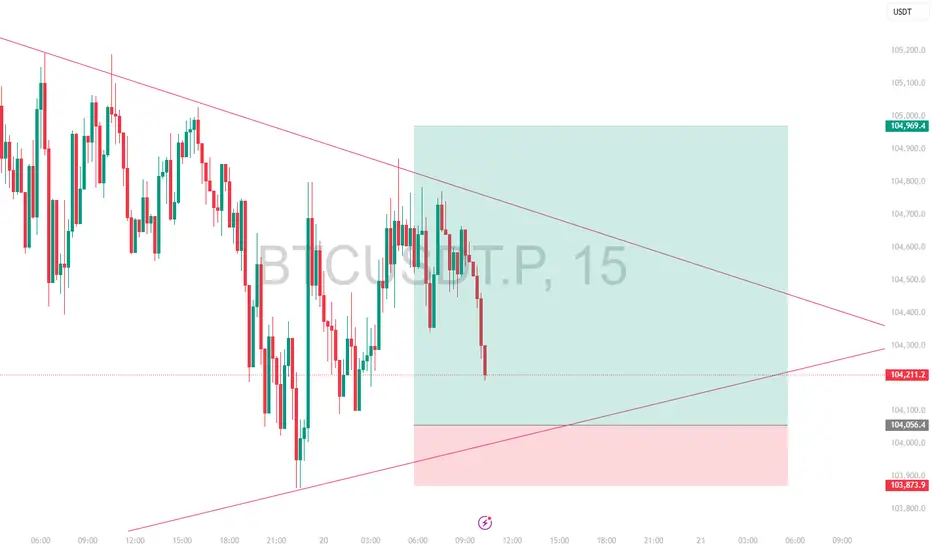
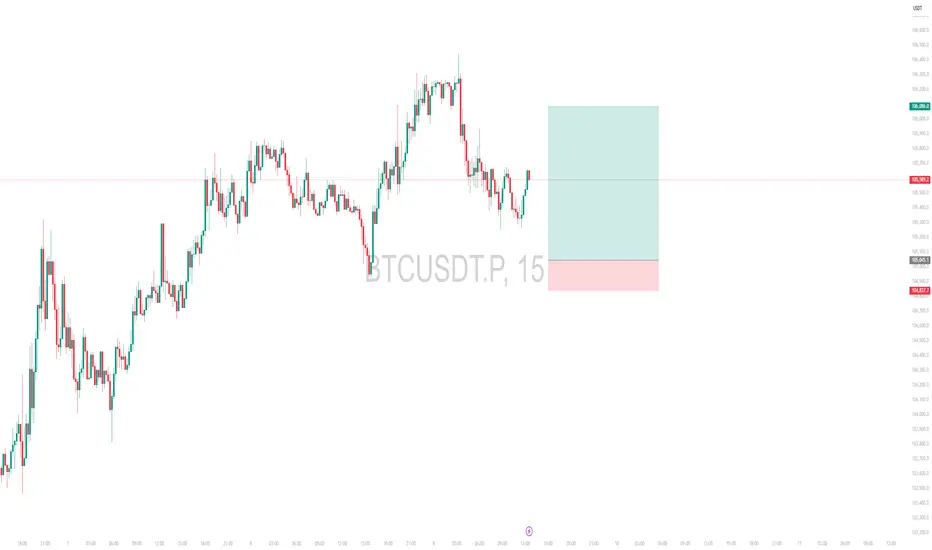
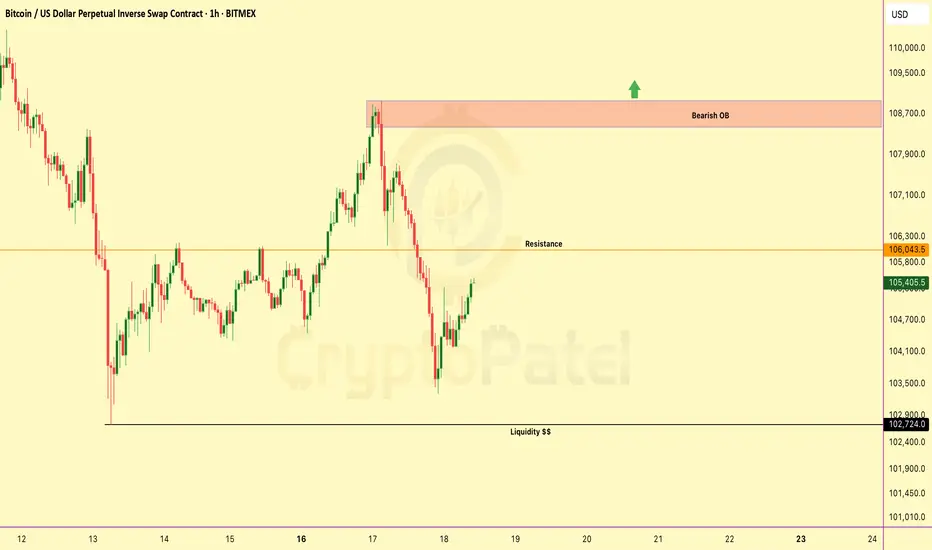
Bitcoin Ready to Blast or Waiting under $100k?BTC is currently trading near $105,399, showing a corrective bounce after a recent sell-off.
Resistance Ahead – $106k:
Price is approaching a key resistance level. A break above could lead to a short-term move toward the Bearish Order Block at $108000–$108950.
🟥 Bearish Order Block (OB):
This is the supply zone that initiated the previous drop. If price fails to break and hold above this OB, we could see renewed selling pressure and continuation of the downtrend.
🔻 Liquidity Pool – $102k:
This level holds resting sell-side liquidity. A failure to hold this area may trigger a sweep — and if $102K breaks, it could unlock deeper downside potential, possibly sending BTC below $100K.
Summary Outlook:
▪️ Rejection from OB = strong bearish continuation
▪️ Break of $106K = short-term bullish move toward OB
▪️ Break of $102K = high probability of sub-$100K levels
▪️ Overall bias remains bearish unless price reclaims and holds above the OB zone with strength.
NFA & DYOR
HYPE Long Swing Setup – Approaching Key Support ZoneHYPE is under pressure but now nearing a major support level, presenting a potential opportunity for a bounce. We’re eyeing the $39.00–$40.00 zone for a long entry as buyers may step in at this key area.
📌 Trade Setup:
• Entry Zone: $39.00 – $40.00
• Take Profit Targets:
o 🥇 $42.18
o 🥈 $43.90
• Stop Loss: Daily close below $38.31

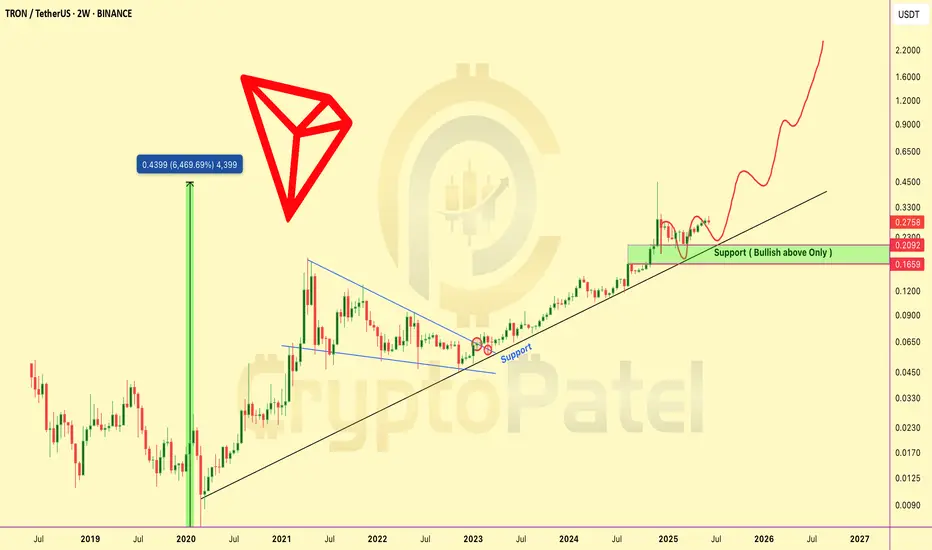
TRX NEXT EXPLOSION INCOMING? TRX NEXT EXPLOSION INCOMING?
TRX is showing a strong bullish setup after breaking out of a long-term consolidation pattern.
🔹 Price has cleanly broken out of a multi-year descending structure
🔹 Retested the key support zone around $0.21–$0.23
🔹 Still respecting the long-term ascending trendline from 2020
🔹 Historical move: 6,469% rally in the previous cycle — current structure suggests similar potential
Key Technical Levels to Watch:
🟩 Support Zone: $0.209–$0.230
🟩 As long as TRX holds above this level, bias remains bullish
🟩 This is a breakout + retest scenario.
🟩 Potential Upside Targets: $0.65 → $1.20 → $2.20+
The chart structure is indicating the possibility of a strong uptrend continuation, with bullish momentum building on higher timeframes.
TRX is technically strong and could be gearing up for a major leg higher if key support holds.
Add it to your watchlist. NFA & DYOR
BTC Decision Point – Are You Watching This?BTC Decision Point – Are You Watching This?
Bitcoin is reclaiming momentum after sweeping liquidity at $102.7K. It's now pushing toward major resistance at $106.1K.
But the real battle? The bearish OB at $107.2K–$108.9K — where price nuked last time.
✅ Break above = clear skies toward new ATHs
❌ Rejection = another trip to $102K or even Under $100K
🔁 Retweet if this helped
💬 Drop your bias below: Long or short?👇

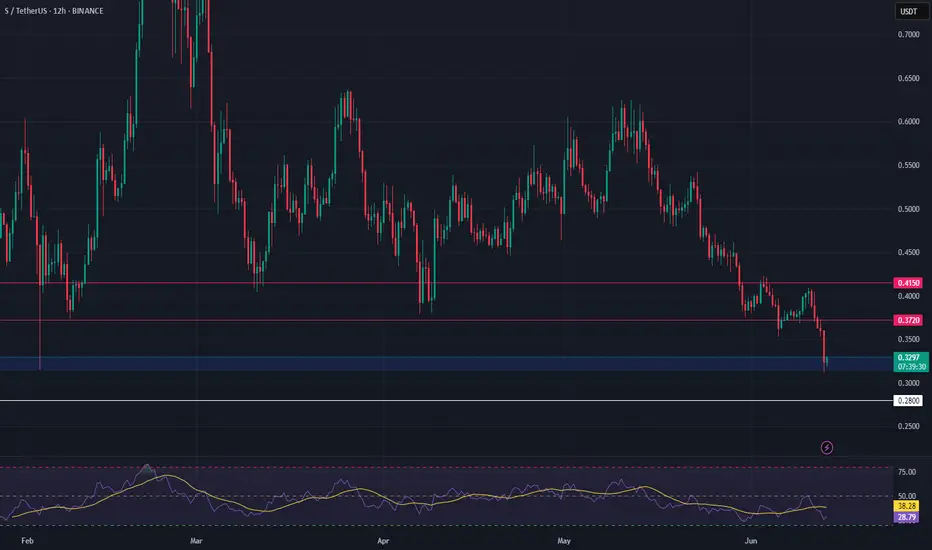
S Long Swing Setup – Retest of February Lows at Key SupportS is pulling back and now approaching a critical support zone, testing the February 2025 lows near $0.31. This area marks a key level for potential accumulation, offering a favorable long setup.
📌 Trade Setup:
• Entry Zone: $0.315 – $0.330
• Take Profit Targets:
o 🥇 $0.372
o 🥈 $0.415
• Stop Loss: Daily close below $0.280
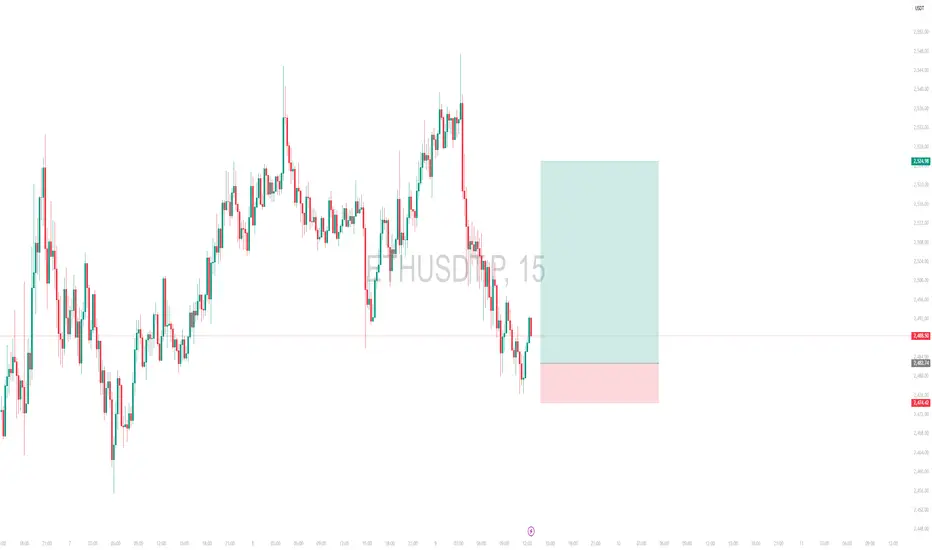
Intraday Long Setup | June 11th 2025 | Valid Until Daily ClosePrice retraced to a strong pivot zone.
Structure remains bullish with potential for continuation after pullback.
Tight risk control.
Watch for price reaction within the red zone. Entry only if confirmation appears
The setup expires at end of the daily candle close.

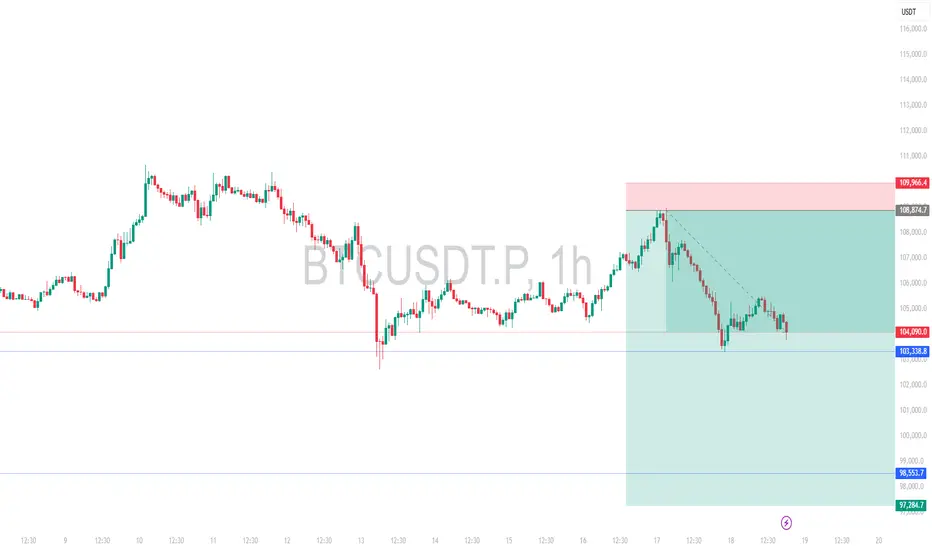
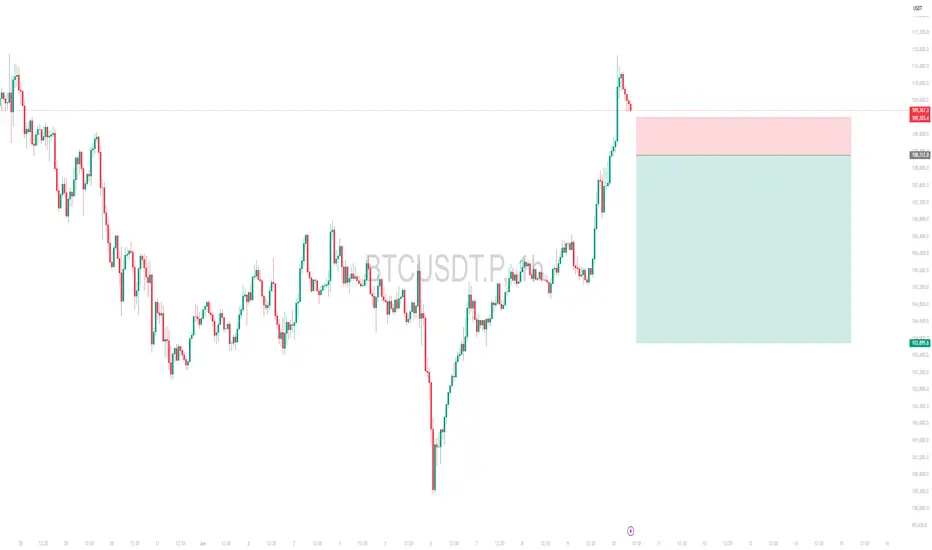
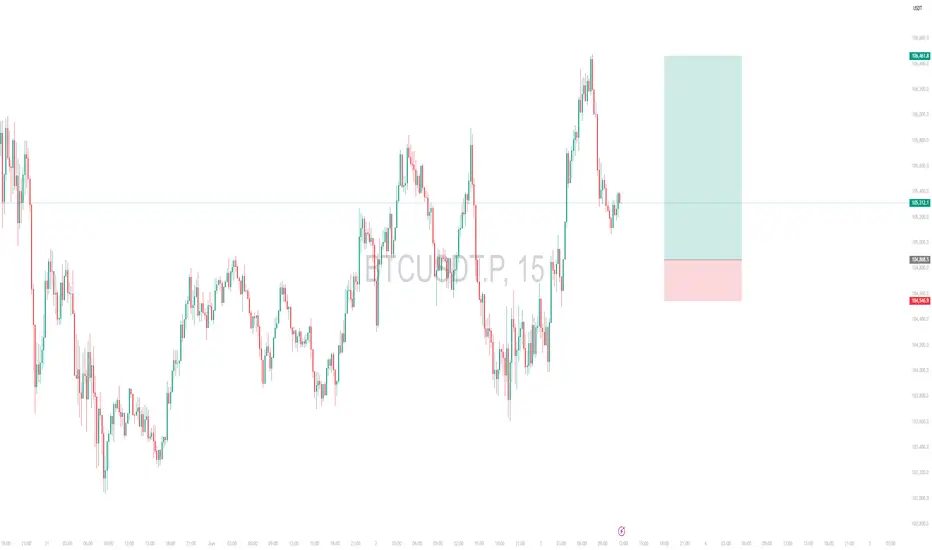
Weekly Short Setup | Valid Until Weekly ClosePrice has pushed through a potential weekly Pivot supply zone (red box) where sellers may step in. This trade is based on the expectation of a rejection from this area.
Entry: Red box — a short entry zone aligned with overhead supply
Stop Loss: Above the red zone (invalidates the setup)
Target: Green box — area to consider partial/full exit based on momentum
BTCUSDT has shown a strong bounce and has now approached a key pivotal resistance zone
Risk-reward is favorable with a tight invalidation and clean downside target
Price may stall or reverse near the red box, creating short opportunity
Note:
This is an weekly setup and idea that expires at Weekly Candle Close. Re-evaluate the setup if price remains indecisive near the entry zone close to that time.
Intraday Long Setup | June 11th 2025 | Valid Until Daily ClosePrice is retracing to a strong pivot zone.
Structure remains bullish with potential for continuation after pullback.
Tight risk control.
Watch for price reaction within the red zone. Entry only if confirmation appears
The setup expires at end of the daily candle close.
This BTC Pullback Could Be The Last Dip Before $120K+ — Are You #Bitcoin has just delivered a textbook breakout — but what comes next might surprise you. Let’s break it down: 👇
🔸 Bearish Order Block @ $109K–$110K
Price tapped into this zone and is currently reacting. Expect short-term volatility here.
🔸 FVG (Fair Value Gap) Filled + Tapped
A clean move back up filled the previous FVG — this typically signals strength but also invites sellers at OB zones.
🔸 Key Bullish Order Block @ $106K
If BTC pulls back, this zone will be crucial. A strong defense here could ignite the next leg up.
🔸 Fib Levels Aligned:
0.382 Fib @ ~$104.5K
0.5 Fib @ ~$102.2K
0.618 Fib & Bullish OB cluster @ ~$100K ( Filled )
Possible Play Ahead:
A dip toward $106K–$104K is healthy → watch for buyer reaction.
If CRYPTOCAP:BTC holds the $106K OB and bounces, a move back toward $112K+ ATH retest is very likely.
Big Picture:
The breakout from the descending channel + OB retest gives BTC strong bullish structure — as long as the $106K zone holds.
Are you ready for the next BTC move?
📈 Comment below: BULLISH or BEARISH?
🔄 Retweet to keep others in the loop!
NFA & DYOR

#Ethereum Breakout Attempt #Ethereum Breakout Attempt 📢
After weeks of consolidation inside this range → CRYPTOCAP:ETH is now testing a breakout above major resistance $2750
👉 If this breakout holds → we could see a BIG upward rally toward $3500–$4000 in the coming weeks. 🚀
Keep an eye on this level — the next move could be massive.

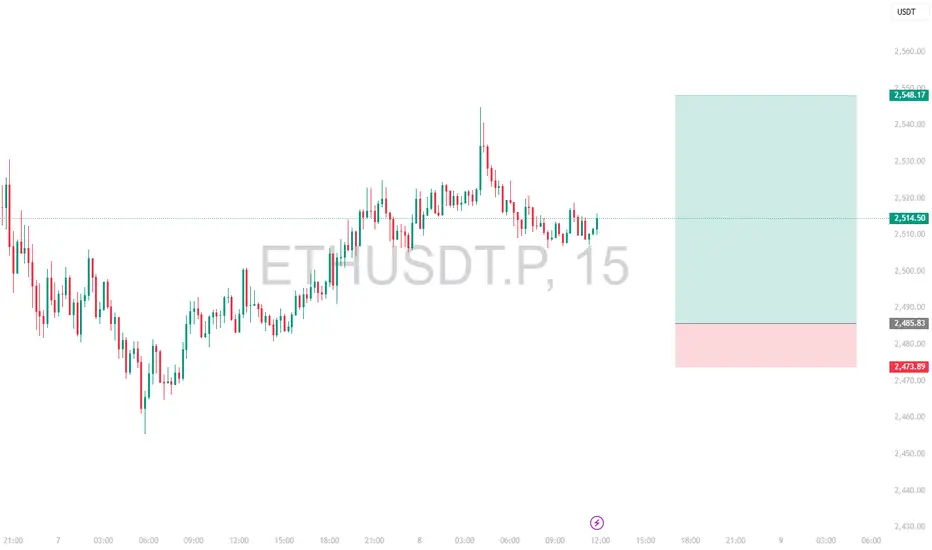
Intraday Long Setup | June 9th 2025 | Valid Until Daily ClosePrice is retracing to a strong pivot zone (marked by the red box).
Structure remains bullish with potential for continuation after pullback.
The green box represents a high-probability long opportunity with tight risk control.
Watch for price reaction within the red zone. Entry only if confirmation (e.g., bullish engulfing, strong wick rejections) appears.
The setup expires at end of the daily candle close.
Intraday Long Setup | June 9th 2025 | Valid Until Daily ClosePrice is retracing to a strong pivot zone.
Structure remains bullish with potential for continuation after pullback.
Tight risk control.
Watch for price reaction within the red zone. Entry only if confirmation appears
The setup expires at end of the daily candle close.
Bitcoin is just 2% away from a new all-time high —will it break?Bitcoin is just 2% away from a new all-time high — will it break or fake? 🚀
BTC is currently trading near $109K–$110K, only 2% below the $112K ATH level.
Strong supports: $94,000 / $80,000
Bullish Case:
If BTC breaks $110K–$112K with strong volume + a bullish weekly close → we could see a rally toward: $135K → $150K
Bearish Case:
If BTC rejects at $110K–$112K, a deep retracement below $100K is possible. Watch for strong support at $100K and $80K levels.
My Personal Take:
I'm bullish overall — but since we’re this close to ATH, I’m opening a short trade with 3% stop loss targeting near $100K.
👉 Not financial advice — do your own research. The crypto market is highly volatile.
Watch this level closely — next big BTC move may be starting NOW. 👀

Intraday Long Setup | June 8th 2025 | Valid Until Daily ClosePrice is retracing to a strong pivot zone (marked by the red box).
Structure remains bullish with potential for continuation after pullback.
The green box represents a high-probability long opportunity with tight risk control.
Watch for price reaction within the red zone. Entry only if confirmation (e.g., bullish engulfing, strong wick rejections) appears.
The setup expires at end of the daily candle close.

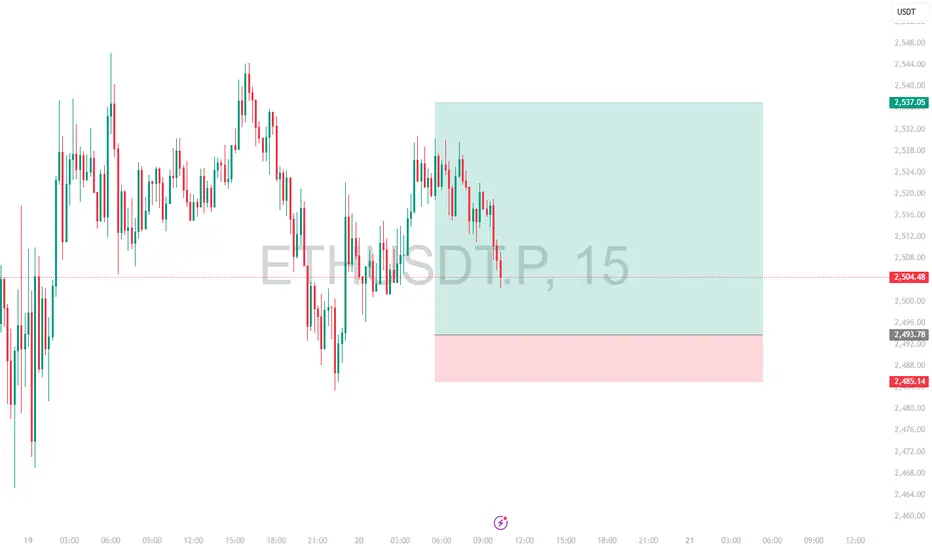
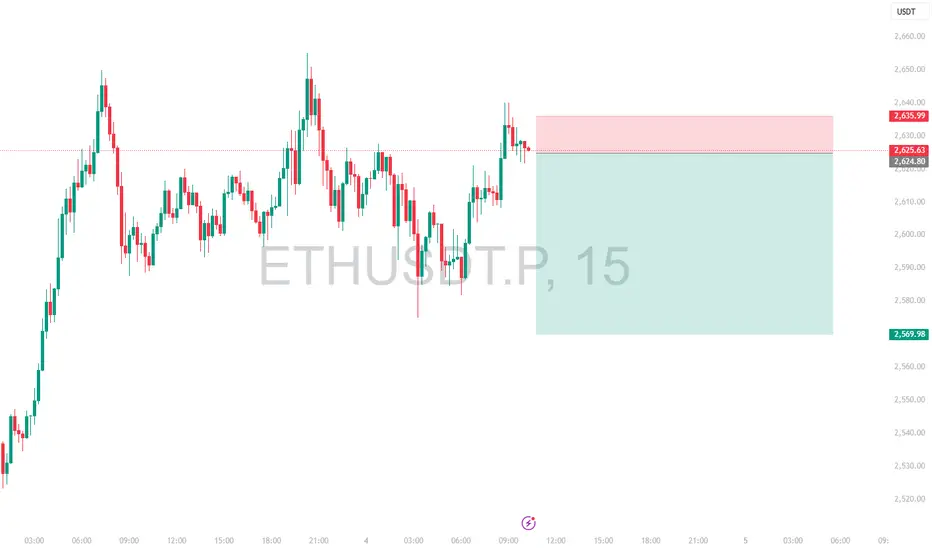
Intraday Short Setup | June 4th 2025 | Valid Until Daily ClosePrice has pushed into a potential intraday Pivot supply zone (red box) where sellers may step in. This trade is based on the expectation of a rejection from this area.
Entry: Red box — a short entry zone aligned with overhead supply
Stop Loss: Above the red zone (invalidates the setup)
Target: Green box — area to consider partial/full exit based on momentum
ETHUSDT has shown a strong bounce but is now approaching a key pivotal resistance zone
Risk-reward is favorable with a tight invalidation and clean downside target
Price may stall or reverse near the red box, creating short opportunity
Note:
This is an intraday trade idea that expires at 00:00 UTC (Daily Candle Close). Re-evaluate the setup if price remains indecisive near the entry zone close to that time.
Intraday Long Setup | June 3rd 2025 | Valid Until Daily ClosePrice is retracing to a strong pivot zone (marked by the red box).
Structure remains bullish with potential for continuation after pullback.
The green box represents a high-probability long opportunity with tight risk control.
Watch for price reaction within the red zone. Entry only if confirmation (e.g., bullish engulfing, strong wick rejections) appears.
The setup expires at end of the daily candle close.
Intraday Long Setup | June 4th 2025 | Valid Until Daily ClosePrice is retracing to a strong pivot zone (marked by the red box).
Structure remains bullish with potential for continuation after pullback.
The green box represents a high-probability long opportunity with tight risk control.
Watch for price reaction within the red zone. Entry only if confirmation (e.g., bullish engulfing, strong wick rejections) appears.
The setup expires at end of the daily candle close.