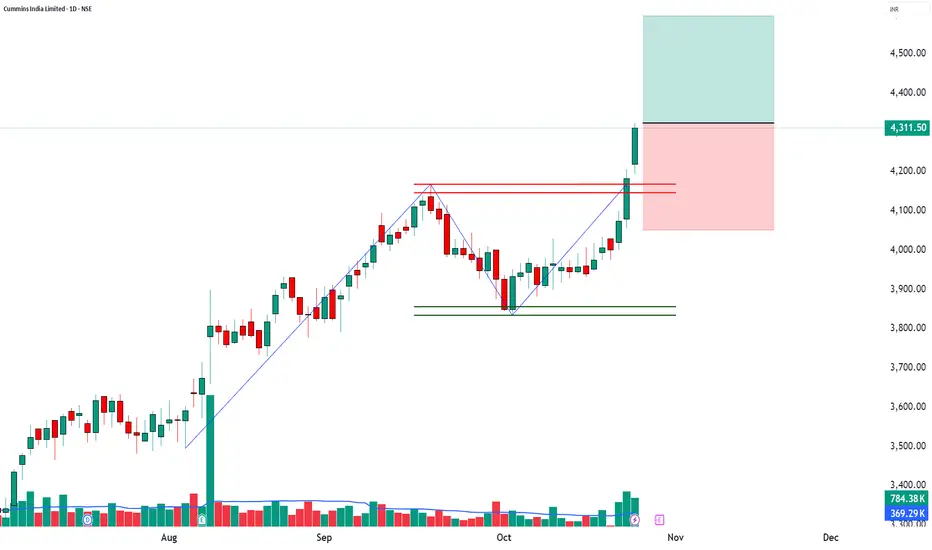
CUMMINSIND | 52-Week Breakout + Volume Expansion📈 CUMMINSIND | 52-Week Breakout + Volume Expansion + Institutional Momentum 🚀
🔹 Entry Zone: ₹4,311.50 – ₹4,324.00
🔹 Stop Loss: ₹4,051.05 (Risk ~273 pts)
🔹 Supports: 4,230 / 4,148.5 / 4,101.5
🔹 Resistances: 4,358.5 / 4,405.5 / 4,487
🔹 Swing Demand Zone: ₹4,096.70 – ₹4,060.10
🔹 Intraday Demand Zone: ₹4,086.20 – ₹4,065.00
🔑 Key Highlights
✅ 52-Week Breakout – strong bullish sentiment and trend expansion
✅ Exceptional Volume (2.12x avg) – clear institutional participation
✅ Bollinger Band Expansion – rising volatility supporting fresh rally
✅ Buy Today, Sell Tomorrow Setup – high momentum carryover expected
✅ VWAP Alignment – buyers maintaining upper hand
🎯 STWP Trade View
📊 Stock has shown powerful bullish momentum with record volume; however, post-breakout consolidation may occur near ₹4,358–₹4,405.
⚠️ The ₹4,086–₹4,065 intraday zone and ₹4,096–₹4,060 swing zone act as crucial support for momentum traders to plan re-entries.
💡 Learning Note
A 52-week breakout supported by heavy volume and VWAP strength signals potential institutional accumulation. Traders should trail profits gradually and watch for sustained volume to confirm continuation.
Final Outlook: Momentum: Moderate | Trend: Neutral | Risk: Low | Volume: High
________________________________________
________________________________________
⚠️ Disclosure & Disclaimer – Please Read Carefully
The information shared here is meant purely for learning and awareness. It is not a buy or sell recommendation and should not be taken as investment advice. I am not a SEBI-registered investment adviser, and all views expressed are based on personal study, chart patterns, and publicly available market data.
Trading—whether in stocks or options—carries risk. Markets can move unexpectedly, and losses can sometimes exceed the money you have invested. Past performance or past setups do not guarantee future results.
If you are a beginner, treat this as a guide to understand how the market works and practice on paper trades before risking real money. If you are experienced, always assess your own risk, position sizing, and strategy suitability before entering trades.
Consult a SEBI-registered financial adviser before making any real trading decision. By engaging with this content, you acknowledge full responsibility for your trades and investments.
Position Status: No active position in CUMMINSIND at the time of analysis.
Data Source: TradingView & NSE India (Past Chart Reference) (Historical levels)
💬 Found this useful?
🔼 Give this post a Boost to help more traders discover clean, structured learning.
✍️ Drop your thoughts, questions, or setups in the comments — let’s grow together!
🔁 Share with fellow traders and beginners to spread awareness.
👉 “If you liked this breakdown, follow for more clean, structured setups with discipline at the core.”
🚀 Stay Calm. Stay Clean. Trade With Patience.
Trade Smart | Learn Zones | Be Self-Reliant 📊
CUMMINSIND
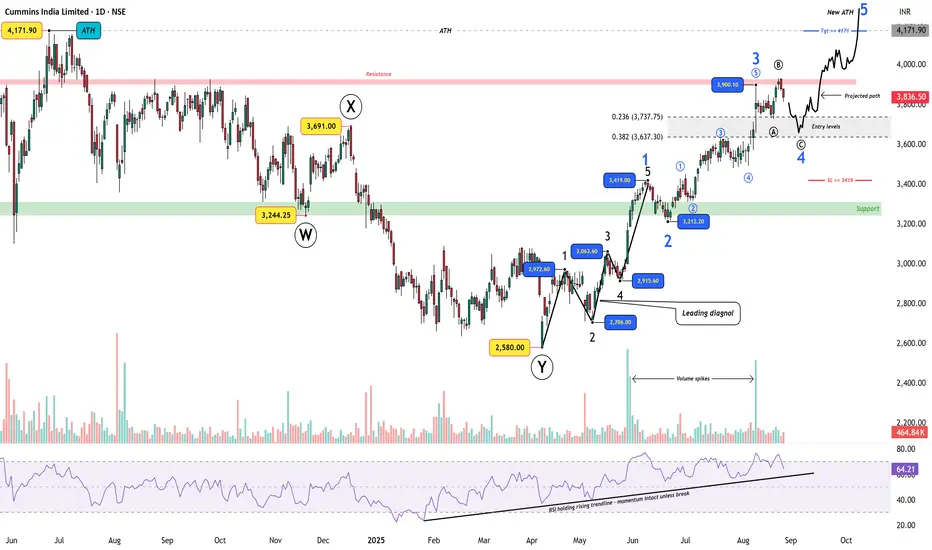
Cummins India – Wave 4 Expanded Flat Before New ATHFrom the 2580 low , Cummins India has likely started a new impulse sequence .
Wave 1 unfolded as a Leading Diagonal , confirmed by messy overlaps and volume spikes.
A sharp Wave 2 retracement was followed by a powerful Wave 3 rally to 3900.
RSI has held a rising trendline throughout, supporting momentum.
Now, price action suggests a Wave 4 Expanded Flat :
Wave A dipped from 3900.
Wave B exceeded the high.
Wave C is projected to retrace into the 3737–3637 Fib zone , offering an entry setup.
Trade Plan:
Entry levels: 3737–3637
Stop loss (SL): Below 3419
Target (Tgt): New ATH at 4171+
RSI remains constructive — momentum intact unless the trendline breaks.
Disclaimer: This analysis is for educational purposes only and does not constitute investment advice. Please do your own research (DYOR) before making any trading decisions.
CUMMINSIND ROUNDING BOTTOM BREAKOUTCumminsind breaking rounding bottom weekly
with good volume building up last few week
RSI above 60,trading above 20 ema
q2 result on 6th nov
immediate target 4500
NO BUY/SELL RECOMENDATION

Accumulation has started in Nifty On Friday, NSE:NIFTY closed with selling pressure and formed a supply candle.
But here’s the interesting part – in that candle, buyers actually beat sellers by 26 million in volume. This means accumulation has already started.
The problem is, the pivot has dropped further to 24428.
If Nifty opens above this pivot, we might see a bounce, but I doubt it will sustain.
If it opens below, it’s a good chance to short with a target of 24200.
There’s also a chance we might directly see a gap-down opening near 24200. If it gaps up, don’t chase it.
Pivot percentile is 0.27, so tomorrow could be volatile. A sustainable move will only come if Nifty holds above 24500, but chances are low right now.
Support is at 24200 and then 24000.
NSE:BANKNIFTY support is at 53590.
In sectors, better to avoid pharma for now.
On Friday, I traded NSE:CUMMINSIND – it gave 5% and we’re still holding.
That’s it for now. Have a profitable tomorrow and a good week ahead.

Cummins India Break out stock for 28% Gain
Breakout above 200 SMA with Rising volume and positive MACD Divergence
Here's my analysis of Cummins India's financials:
**Net Profit:**
- Net profit for FY 2023-24: ₹2,533 crores ¹
- Net profit for FY 2022-23: ₹2,345 crores ¹
- Net profit for FY 2021-22: ₹1,944 crores ¹
- Net profit for FY 2020-21: ₹1,566 crores ¹
**Yearly Results:**
- Revenue growth: 15% CAGR over the last 5 years ¹
- Profit growth: 20% CAGR over the last 5 years ¹
- Operating margin: 15.6% in FY 2023-24 vs 14.5% in FY 2022-23 ¹
- Return on Equity (ROE): 23.1% in FY 2023-24 vs 21.5% in FY 2022-23 ¹
Overall, Cummins India has shown consistent revenue and profit growth over the years.
Note : May have open positions in this entity at various price levels.

Cummins Ind - Many OpportunitiesStock reaching its daily supply zone
Which also happens to be its trend line resistance
Expecting a short down move from here
Downside now has a good resistance turned support at 3060 - 3080
Stock may try to bounce back from there to break the trend line and move higher
Play according, Keep proper Sl
CUMMINS INDIA Cummins India on the verge of breaking out of range we can see good long rally mic company with good fundamentals

Cummins India : Ready to Blast#cumminsind #consolidation #breakout #rangebreakout
Cumminsind : Swing / Momentum Trade
>> Consolidation Breakout
>> Stage 1 Breakout
>> Low Risk High Reward Trade
>> Good Upside Potential
Swing Traders can lock profit at 10% and keep Trailing
Please Boost, comment and follow us for more Learnings.
Note : Markets are still Tricky and can go either ways so don't be over aggressive while choosing & planning your Trades, Calculate your Position sizing as per the Risk Reward you see and most importantly don't go all in
Disc : Charts shared are for learning purpose only, not a Trade recommendation. Do your own research and consult your financial advisor before taking any position.
Cummind India | Weekly LevelsStock currently hovering near Weekly Strong support levels, which extends downside upto 2625
As we can see stock is not making new highs but also not making new lows as well
There is also a daily strong area merged in the same zone, which can be considered as a good buying zone, with a downside Sl of 2600 (Closing basis)
If it manages to hold the mentioned area, then we can see a good upside upto 3250 / 3300 areas
Risk to reward ratio looks good
Lower time frame confirmation is a must
Broader market is bearish as well as chopp, so be cautious

Cummins - Weekly Set-up (Long)Cummins is close to completing Wave 4. (Maybe last dip to 2500)
Wave 5 targets 5000, 7000.

Cummins India Ltd: Eyeing a Major BreakoutCummins India Ltd (NSE: CUMMINS) is signaling strong bullish momentum on the weekly chart with a falling wedge and bullish flag combination .
Key Insights:
Patterns: Falling wedge + bullish flag – strong continuation signals.
Current Price: ₹3,671.00 (+1.98%).
Breakout Zone: ₹3,750 (watch for a sustained move).
Targets: ₹3,929 → ₹4,169 → ₹4,500 → ₹5,600+ (bullish flag projection).
Support Levels: ₹3,422 and ₹3,251.
A breakout above ₹3,750 with volume confirmation could push prices toward ₹5,600+, aligning with the bullish flag target.

CUMMINS DOUBLE BOTTOM BREAKOUTCummins breaking double bottom pattern
with volume spike,bullish rsi
trading above 20ema
#target 3900-4150
sl 3400,depending on ur risk management
EDUCATIONAL IDEA

CUMMINSIND#CUMMINSIND is ready to fly,,
there is higher probability we can see good in move from
here in Intraday only...
I am expecting 50-80 points rally in it..
Please follow strict stop loss
better trade in next week future and options contracts

Potential Channel Breakout: Cummins India Near 3950Details:
Asset: Cummins India Limited (CUMMINSIND)
Breakout Level: Above 3950
Potential Target: Significant upside potential beyond 3950
Stop Loss: Below 3950 or as per risk tolerance
Timeframe: Medium-term
Rationale: Cummins India has been consolidating for months and is now nearing the critical breakout level of 3950. A successful breakout from this channel could lead to a substantial upward move, making it a stock to watch closely for potential big gains.
Market Analysis:
Technical Setup: The stock has been consolidating in a channel and is approaching the breakout level of 3950. A breakout above this resistance could trigger strong bullish momentum.
Consolidation Phase: The prolonged consolidation suggests that the stock is building strength, and a breakout could be a signal for an extended upward trend.
Price Target:
The breakout above 3950 could lead to a significant move higher, with further upside potential as the stock gathers momentum.
Risk Management:
A stop loss below 3950 is recommended to protect against downside risk in case of a failed breakout or market reversal.
Timeframe:
The expected breakout and potential move higher could unfold over the medium term, though the actual timing depends on market conditions and the strength of the breakout.
Risk-Reward Ratio: A favorable risk-reward setup, with limited downside risk near the breakout level and significant upside potential if the breakout occurs.
Keep a close eye on Cummins India for a possible breakout, and be prepared to act based on technical signals and market conditions.


CUMMINS INDIA - TRIANGLE PATTERN The stock has formed Triangle pattern on the
hourly chart.
One can enter above 3737.30 with a strict
Stoploss of 3693.50
Target 1 - 3790
Target 2 - 3834
Target 3 - 3868
#INTRADAY TRADE
#CUMMINS
What is your view please comment it down and also boost the idea this help to motivate us. All views shared on this channel are my personal opinion and is shared for educational purpose and should not be considered advise of any nature.

CUMMINS INDIA - Swing Trade Analysis - 7th August #stocksCUMMINS INDIA (1D TF) - Swing Trade Analysis given on 7th August, 2024
Pattern: SYMMETRICAL TRIANGLE SETUP
- Strong Pullback candle from Support Trendline - Done ✓
- Weekly Volume buildup near Resistance Trendline - Done ✓
- Demand Zone Retest & Consolidation (for a small SL and a better RR) - In Progress
Please Note:
- This is an early entry to give for a better RR
- Resistance Trendline Breakout - In Progress
* Disclaimer

Short Term Trading Opportunity in Cummins India for >15% UpsideHi,
NSE:CUMMINSIND has given a Bullish Flag Breakout on Daily charts with very good volume.
MACD is also on the bullish side on Weekly and Monthly time frames. RSI is also on the bullish side on daily, weekly and monthly time frames.
In the current market scenario, I am expecting that the bullish momentum will continue.
Complete price projection like entry, stop loss and targets mentioned on the charts for educational purpose.
Don't Forget to Follow me to get all the updates.
Please share your feedback or any queries on the study.
Disclaimer: Please consult your financial advisor before making any investment decision.

CUMMINS INDIA - SWING TRADE - 11th January #stocksCUMMINS INDIA (1D TF) - Swing Trade Analysis given on 11th Jan, 2024
Pattern: ASCENDING TRIANGLE BREAKOUT
- Breakout - Done ✓
- Volume Spike at Resistance - Done ✓
- Retracement & Consolidation - Done ✓
#stocks #swingtrade #chartanalysis #priceaction #traderyte #cumminsind

CUMMINSIND HOURLY CHARTBreak any side harizontel line take a trade. note* Entry after hourly candle close.


CUMMINSINDCUMMINSIND ready for a swift rise to the peak
Hypermomentum
Turns positional
D and M in momentum
Reaches Q1 RRg

CUMMINSIND - Bullish Swing ReversalNSE: CUMMINSIND is closing with a bullish swing reversal candle supported with volumes.
Today's volumes and candlestick formation indicates strong demand and stock should move to previous swing highs in the coming days.
The stock has been moving along the horizontal support for the past few days which is indicating demand.
One can look for a 8% to 12% gain on deployed capital in this swing trade.
The view is to be discarded in the event of the stock breaking previous swing low.
#NSEindia #Trading #StockMarketindia #Tradingview #SwingTrade
