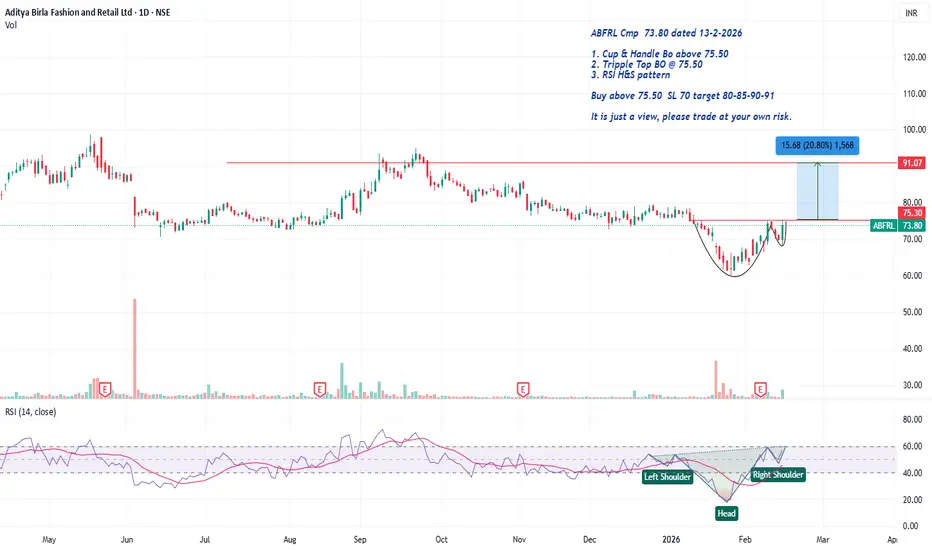
ABFRL Cmp 73.80 Cup & Handle BoABFRL Cmp 73.80 dated 13-2-2026
1. Cup & Handle Bo above 75.50
2. Tripple Top BO @ 75.50
3. RSI H&S pattern
Buy above 75.50 SL 70 target 80-85-90-91
It is just a view, please trade at your own risk.
Cup And Handle
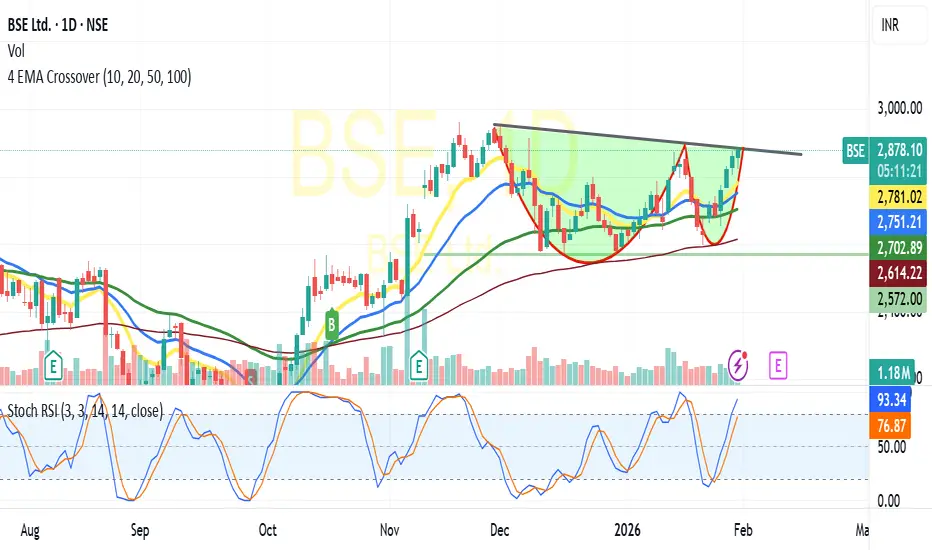
BSE-Likely Cup &Handle Break outBSE:
Trading at 2881 and above all its critical Moving averages Viz10/20/50/10 DEMA
In daily chart has formed C&H Pattern,
Based on the pattern and price volume suggests -breaking the Neckline resistance at 2880-2900 likely to test 2950/3000+ shortly(For educational purpose only)
BankIndia - Rounding bottomBank of India has formed a rounding bottom pattern and also had a small breakout.
It had made high of 170 and then come down for the resting.
So, once it breaks and sustain above 170, you can buy and hold for the target of 200 and 220.
Buy on every dips after breakout, it will give handsome amount of return.

Bottom Fishing in Nifty InfraCup and Handle breakout being retested on daily timeframe. Upside targets marked in green are valid till support at 8800-8850 is respected. Expecting consolidation between 8850-9500 for few weeks.

EUR/USD – 1H EURUSD is trading at a discounted price area after a sharp impulsive sell-off, where price has swept sell-side liquidity (LA) and is now stabilizing near equal lows. The recent bearish leg looks exhaustive, suggesting downside momentum is weakening.
Price is currently holding above a key intraday demand / liquidity pocket, forming a base that favors a mean-reversion move rather than continuation lower.
Key Structure & Narrative
Sell-side liquidity taken below prior lows (LA)
Bearish impulse completed, followed by compression and basing
Discount zone respected, aligning with smart-money accumulation logic
Upside Scenario (Primary Bias)
A bullish displacement from current levels can open a path toward the prior H1 supply / imbalance zone (blue)
Acceptance above this zone may lead to a trend continuation toward the higher-timeframe premium area, with projected targets near the 1.2050–1.2080 region
Pullbacks during the move are expected to be corrective, not impulsive
Invalidation
Sustained acceptance below the liquidity sweep low would invalidate the bullish thesis and imply further downside exploration
📌 Bias: Bullish reversal from sell-side liquidity
📌 Framework: Liquidity sweep → accumulation → displacement → expansion
📌 Market State: Transition from markdown to re-accumulation

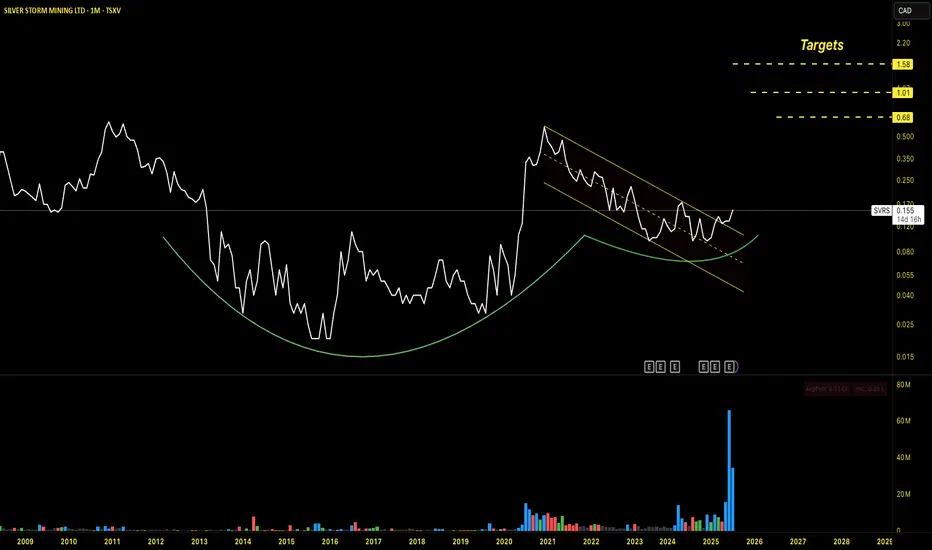
$SVRS forming a multi year cup and handle breakoutTSXV:SVRS is a compelling setup, nearly 8 years of consolidation (cup phase) followed by an impulse movement in 2020, and again 5 year long time correction handle pattern. This is a solid setup which we don't find often. What i like is the volume buildup near the handle phase, which is a clear institutional smart money surge.
I am buying here, and clearly this is not a short term trade. My downside risk is capped at 30%.
TATASTEEL C&H WEEKLY BREAKOUTTatasteel breaking c&h pattern weekly basis
trading at ATH,metal sector doing well
good volume last few weeks
RSI above 60,macd crossover seen
immediate target 206,after breaking 206 can lead toward 227
NO BUY/SELL RECOMENDATION

SbinThe daily time frame chart shows that the price is bouncing from the trend line support. In the lower time frame, the price has formed a rounding bottom.
Buy above 1048 with the stop loss of 1040 for the targets 1054, 1060, 1068 and 1076.
A rounding bottom pattern can form a candle if it has a pullback. At the same time, in the daily chart, the price should hold the trend line support.
Always do your analysis before taking any trade.

NIFTY Update Last Support 24500NSE:NIFTY
previously i posted nifty analysis but that became trap
nifty is stand near to support clusters.
there are no pullback in current down trend so pullback can also possibly and that pullback become breakout rally but this is possibility. pullback also continue the down rally that also possibility.
last support is 24500
this is not a any types of advice.
this is a just chart analysis and that can be wrong.
do your own research.

Union Bank of India near 8 year high
1. Cup with 3 contractions in the handle.
2. Structure good on weekly as well as daily timeframe.
3. Recent Breakout with low volume pullback on Daily TF.
4. Good volume signature.
.
NOTE : Further movement can get choppy or breakout may fail as overall market sentiment not favourable.

BSE - Cup n Handle breakoutClear cup and handle pattern, with volume breakout.
Retest of levels 2750-2740 is still possible and can be a good opportunity to add.
With a Strict stoploss At 2725.
Minimum target 3000/-.

Sensex - Weekly expiry day analysis Jan 8The price moved in a descending channel, and today the price consolidated in a narrow range. This movement gave the move above the channel. This can give a pullback or upward move.
The patterns seen in the chart are 1. Rounding bottom 2. Descending channel
Buy above 84900 with the stop loss of 84780 for the targets 85020, 85180, 85300, 85460 and 85600.
Sell below 84640 with the stop loss of 84780 for the targets 84520, 84400, 84260, 84140 and 84040.
Always do your analysis before taking any trade.

Northern Arc Capital | Daily Chart | Consolidation Price is consolidating between ₹250–270 after a strong recovery, indicating absorption near resistance rather than weakness.
🔹 Resistance: ₹270–275
🔹 Support: ₹250–255
🔹 Structure: Falling channel / flag after upmove
🔹 EMA Zone: Price holding near EMAs → volatility compression
👉 Sustained breakout above ₹275 with volume can trigger the next leg towards ₹300+.
👉 Breakdown below ₹245 will weaken the bullish structure.

Sensex - Weekly review Jan 5 to Jan 9The price sustained above the 85400 zone and gave a good movement. Nearby resistance is at 86150. The price is bullish as long as it sustains 85400.
If the price opens flat, buy above 85700 with the stop loss of 85500 for the targets 85840, 85980, 86120, 86240, 86360, 86520, 86700 and 86820.
As per the daily chart, the price is forming a rounding bottom pattern, which is bullish.
If the price opens gap down and shows bullish strength, buy above 85500 with the stop loss of 85340 for the targets 85620, 85740, 85840, 85980, 86120, 86240, 86360, 86520, 86700 and 86820.
Sell below 85260 with the stop loss of 85400 for the targets 85120, 85020, 84860, 84700, 84560, 84400 and 84240.
Always do your analysis before taking any trade.

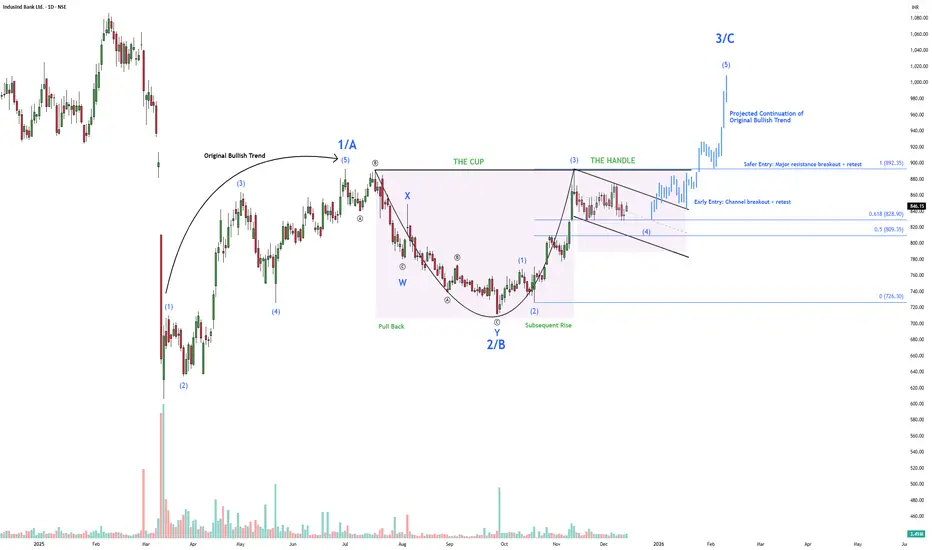
IndusInd Bank: Cup Formed, Handle ConsolidatingIndusInd Bank is forming a classic Cup & Handle continuation pattern , which aligns cleanly with a major-degree Elliott Wave structure , strengthening the bullish case.
The prior advance established the primary bullish trend (Wave 1 / A) . The subsequent decline unfolded as a complex Wave 2 / B correction , expressed visually as the cup — a rounded, time-consuming base formed through a W–X–Y corrective structure . This phase allowed price to correct without breaking the broader trend, signalling accumulation rather than distribution.
The recovery from the base completed the cup and transitioned into the handle , which is developing as a shallow consolidation above key Fibonacci supports . From an Elliott Wave perspective, this handle reflects a pause before expansion , not a reversal, keeping the larger bullish structure intact.
With the handle holding above the 0.618–0.50 Fibonacci retracement zone (₹828.90–₹809.35) , the setup favors a major-degree Wave 3 / C advance , typically the strongest and most impulsive phase of a trend.
Structure & Bias
Pattern : Cup & Handle (Continuation)
Elliott Wave alignment:
Wave 1 / A: Prior impulsive advance
Wave 2 / B: Complex correction forming the cup (W–X–Y)
Wave 3 / C: Expected expansion leg post-breakout
Bias : Bullish continuation
Entry Strategy
Early Entry (Aggressive):
Channel breakout within the handle, followed by a successful retest — offers early exposure with higher volatility risk.
Safer Entry (Conservative):
Breakout above the major resistance near ₹892, followed by a retest — confirmation-based entry aligned with Wave 3 / C acceleration.
Invalidation
Sustained trade below ₹809 invalidates the Cup & Handle thesis and weakens the Wave 3 / C outlook.
Bottom line:
This is a Cup & Handle powered by Elliott Wave structure . As long as price holds above key Fibonacci support, the path of least resistance remains higher.
Disclaimer:
This analysis is for educational purposes only and does not constitute investment advice. Please do your own research (DYOR) before making any trading decisions.
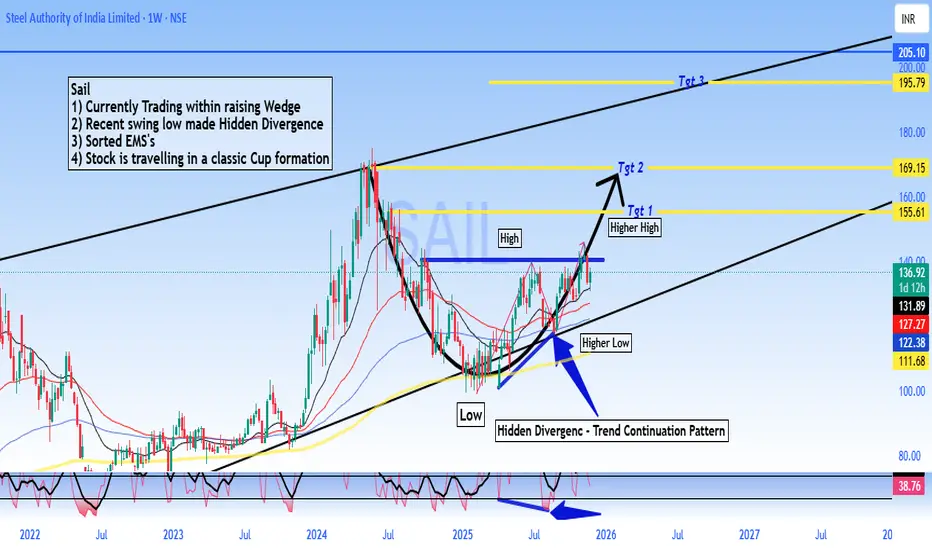
SAIL - Buy - Technical Analysis# Steel Authority of India Limited (SAIL) - Technical Analysis Report
Current Price: 136.92
Timeframe: Weekly Chart Analysis
Technical Setup Overview
SAIL is presenting a compelling technical picture with multiple bullish indicators aligning for a potential significant upward move. The stock is currently trading within a well-defined rising wedge pattern and has recently formed a **Hidden Divergence** on the weekly chart - a classic trend continuation signal.
Key Technical Observations
Rising Wedge Pattern:
The stock is trading within a rising wedge formation, which typically indicates consolidation before a breakout. The current price action suggests the stock is in the later stages of this pattern.
Hidden Divergence - Bullish Continuation Signal:
A **Hidden Divergence** has formed on the weekly timeframe.
- This pattern typically signals trend continuation and suggests the uptrend is likely to resume with strength
Sorted EMA Structure:
The Exponential Moving Averages are properly aligned, indicating a healthy bullish trend structure with multiple moving averages providing dynamic support.
Cup Formation in Progress:
The stock appears to be carving out a **classic Cup pattern**, which is a well-known bullish continuation formation. This pattern suggests accumulation and potential for a significant breakout move.
Price Targets & Projections
Based on the technical structure, here are the potential price targets:
Target 1: 155.61 (Higher High breakout level)
Target 2: 169.15
Target 3: 195.79
These targets are derived from the pattern structure and represent key resistance zones where profit-taking may occur.
Trading Strategy Considerations
For Swing Traders:
- Current levels offer a potential entry opportunity for medium to long-term positions
- A move above ₹140 could confirm the continuation pattern
- Stop loss can be placed below the recent higher low at 122 for risk management
Risk Factors to Monitor
- Failure to hold above ₹122 would invalidate the bullish hidden divergence
- Breakdown below the rising wedge support would change the outlook
- Sector performance and broader market conditions should be monitored
- Steel industry fundamentals and commodity price trends
🔔 Conclusion
SAIL is exhibiting strong technical characteristics with the Hidden Divergence pattern, sorted EMA structure, and cup formation all pointing toward potential upside. The current price action within the rising wedge presents an interesting risk-reward setup for traders and investors with appropriate risk management.
DISCLAIMER
This analysis is for educational and informational purposes only and should NOT be considered as investment advice or a recommendation to buy, sell, or hold any securities. - I am not a SEBI registered analyst or investment advisor - This is purely a technical analysis based on chart patterns and indicators - Past performance and technical patterns do not guarantee future results - Trading and investing in stocks involves substantial risk of loss - Always conduct your own research and due diligence before making any investment decisions - Consult with a qualified financial advisor before taking any investment positions - The author holds no responsibility for any profits or losses incurred based on this analysis - Risk management and position sizing are crucial - never invest more than you can afford to lose
**Trade/Invest at your own risk. Do your own analysis.**
#SAIL #SteelAuthorityOfIndia #StockMarket #TechnicalAnalysis #NSE #IndianStocks #ChartAnalysis #TradingView #StockTrading #HiddenDivergence #CupPattern #PriceAction #SwingTrading #Investing #MarketAnalysis #SteelSector #Commodities #TradingStrategy #ChartPatterns #TechnicalIndicators
Graphite India - Triangle PatternGraphite India looks good above 645 to buy and hold for the long time.
Targets are 715-815-940.
Buy and accumulate for long time, buy on every dips.
Company doing good work and giving better profit.

Inverted Cup and Handle Market Structure🔎 Overview
The Inverted Cup and Handle is a price structure that reflects gradual exhaustion after an upward phase, followed by a weak recovery. The pattern highlights a shift from strength to balance and then potential continuation in the direction of the prior decline. It is best viewed as a structure-based setup rather than a prediction tool.
------------------------------------------------------------
📘 Concept
The pattern begins with a rounded top (the inverted cup), where buying pressure slowly fades and distribution takes place.
After the decline from the cup , price attempts a recovery but forms a small upward-sloping channel (the handle). This recovery is corrective in nature and typically lacks strength, signaling hesitation rather than reversal.
------------------------------------------------------------
🧭 How to Use
• Validation → Successive candle closes below the lower boundary of the handle confirm the pattern.
• Devalidation → Candle closes above the upper boundary of the handle invalidate the structure and negate the setup.
------------------------------------------------------------
📊 Chart Explanation
1️⃣ Inverted Cup Formation
Price forms a rounded top as buying pressure gradually weakens, indicating distribution instead of aggressive selling.
2️⃣ Decline from the Cup
Once price fails to hold higher levels, momentum shifts and price moves away from the rounded structure.
3️⃣ Handle Formation
Price rebounds into a shallow upward channel. This move is weak and corrective, showing limited participation.
4️⃣ Compression Inside the Handle
Candles tighten within the handle, reflecting reduced volatility and short-term balance.
5️⃣ Structural Confirmation
A decisive close below the handle boundary signals the end of consolidation and confirms continuation of the prior move.
------------------------------------------------------------
👀 Observation
• Rounded tops often develop slowly and require patience.
• The handle phase represents hesitation, not strength.
• Best clarity comes from waiting for candle-close confirmation rather than early anticipation.
------------------------------------------------------------
📝 Summary
• Rounded top shows fading buying pressure
• Handle reflects weak, corrective recovery
• Compression signals indecision
• Validation occurs only after boundary acceptance
------------------------------------------------------------
⚠️ Disclaimer
📘 For educational purposes only.
🙅 Not SEBI registered.
❌ Not a buy/sell recommendation.
🧠 Purely a learning resource.
📊 Not Financial Advice.

RELIANCE -Likely Cup&SAUCER Huge BREAK OUTRELIANCE : Trading at 1565 and above its 10/20/50 DEMA even on weekly chart .
Has formed Cup&Handle Pattern in weekly chart.
Price volume action and the pattern suggests a break out to 1600/1650/1700 levels on positional basis and giving a close above 1575(For educational purpose only)

IOB can rise after PSU stake saleI feel that all PSU banks are well positioned to move up
The ones that have the highest chances of getting sold off are IOB, central Bank as of now
Rumours of their Privatisation have been going around for a while

BPCL | Nice cup and handle breakout and retestBPCL | Nice cup and handle breakout and retest and reversing again now
CMP : 365

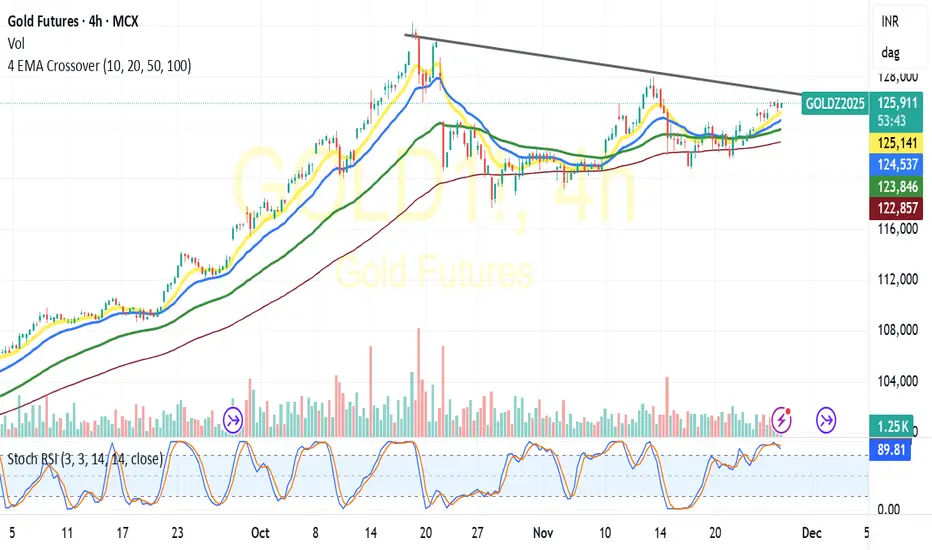
MCX GOLD: All set for yet another Golden Rally? Likely C&S B-OUTGOLD: After a brief consolidation seems its all set for another GOLDEN Rally.
Formed Cup&Handle pattern in Hourly charts.
Going by the pattern the logical targets would be 1,27,000-1,28,000-1,30,000 with 1,20,000-1,24,000 acting as the support.
(For educational purpose only)
BSOFT for short-midterm HoldingLooks good for mid-long term investment. I am looking at targets of 540, 605, 720, 950
