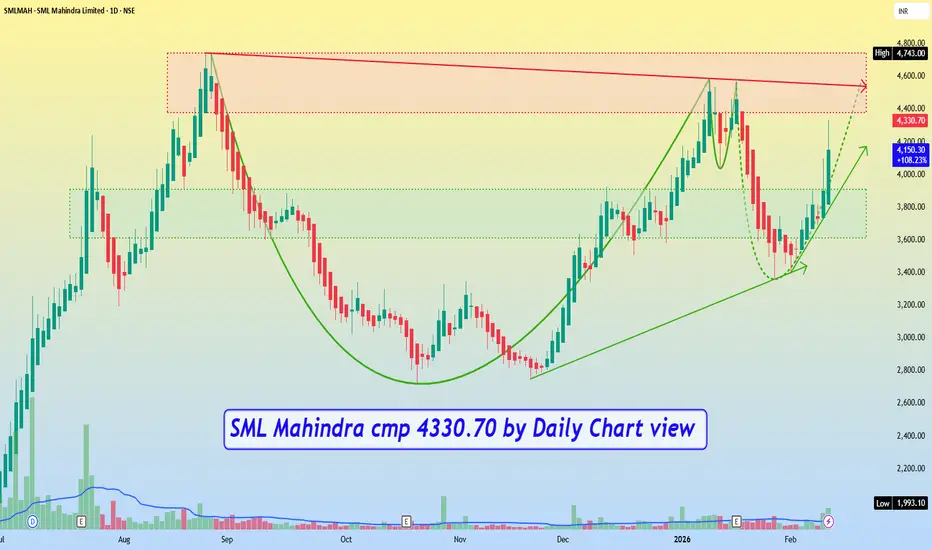
SML Mahindra cmp 4330.70 by Daily Chart viewSML Mahindra cmp 4330.70 by Daily Chart view
- Support Zone 3610 to 3910 Price Band
- Resistance Zone 4380 to ATH 4743 Price Band
- Volumes are spiking above avg traded qty over past few days
- Bullish Cup & Handle with in completion stage Rounding Bottom
- Support Zone is standing ground for up trending price momentum
Cupandhandlepattern
Ajanta Pharma in a cup and handle pattern Ajanta Pharma
Setup: Cup & Handle
Trigger: Breakout above ₹2890
Strength: RSI >60, OBV rising, volume strong on up-moves
Stoploss:
Aggressive: ₹2770
Conservative: ₹2660
Target: ₹3480
Bias: One of the cleaner momentum structures

Ujjivan Small Finance cmp 62.35 by Weekly Chart view since listeUjjivan Small Finance cmp 62.35 by Weekly Chart view since listed
- Support Zone 54.50 to 61.50 Price Band
- Resistance Zone 64 to ATH 68 Price Band
- Bullish Rounding Bottoms by Support Zone neckline
- Bullish Cup and Handle within the 2nd Rounding Bottom
- Falling Resistance Trendlines Breakout seems well sustained
- Volumes spiking and well above the average traded quantity
- Rising Price Channel has been well respected and also sustained
- High Target probable by Bullish Chart setup with Support Zone Breakout earlier Resistance Zone

BUY TODAY SELL TOMORROW for 5% - BTST STOCK OPTIONDON’T HAVE TIME TO MANAGE YOUR TRADES?
- Take BTST Stock Option trades at 3:25 pm every day
- Try to exit by taking 4-7% profit of each trade
-Cup and Handle Breakout in NESTLEIND
BUY TODAY, SELL TOMORROW for 5%

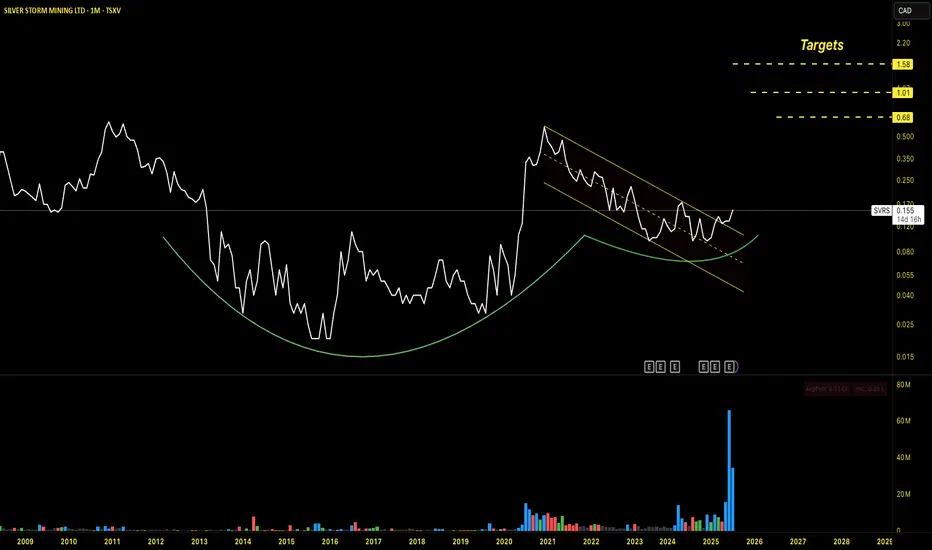
$SVRS forming a multi year cup and handle breakoutTSXV:SVRS is a compelling setup, nearly 8 years of consolidation (cup phase) followed by an impulse movement in 2020, and again 5 year long time correction handle pattern. This is a solid setup which we don't find often. What i like is the volume buildup near the handle phase, which is a clear institutional smart money surge.
I am buying here, and clearly this is not a short term trade. My downside risk is capped at 30%.
BUY TODAY SELL TOMORROW for 5% - BTST STOCK OPTIONDON’T HAVE TIME TO MANAGE YOUR TRADES?
- Take BTST Stock Option trades at 3:25 pm every day
- Try to exit by taking 4-7% profit of each trade
-Cup & Handle Breakout in SOLARINDS
BUY TODAY, SELL TOMORROW for 5%

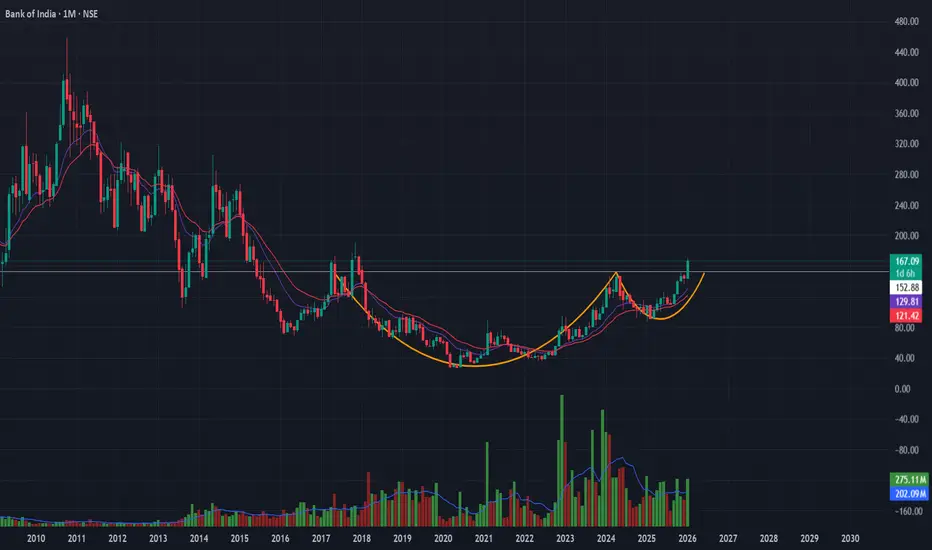
Bank of India | Cup & Handle Breakout SetupStructure:
Long-term Cup & Handle pattern nearing completion on monthly timeframe, indicating accumulation after a prolonged base.
Confirmation Signals:
-Volume expanding on rallies
-RSI above 50 and rising
-OBV trending higher → accumulation visible
-Price holding above short-term EMAs
Trade Plan:
-Buy: Sustained breakout above ₹151
-Targets: ₹199 → ₹268
-Stop-loss: ₹134 (ATR-based, structure-valid)
-Risk–Reward: ~1:5
GARLAND PATTERN : HINDCOPPER ( Multi Year Breakout/Resistence)🌸 HINDCOPPER: The 15-Year "Garland" Pattern Complete
The Technical Setup: Beyond the Cup & Handle
While amateur analysts will call this a "Rounding Bottom" or a "Cup and Handle," true veterans of the Indian market recognize this as a Garland Pattern.
Why? Because a "Garland" (Mala) is what you put on a photo of someone who has passed away. If you bought HINDCOPPER at the peak in 2010 (around ₹600+), your capital has essentially been "dead" for 15 years. This breakout isn't just a price move; it’s a resurrection.
1. The "Cemetery" Zone (2010 - 2024)
The Long Sleep: For over a decade, this stock was a graveyard for retail investors. Every "dip" was a trap, and every "rally" was a ghost.
The Survivors: If you are still holding from 2010, you aren't a trader; you are a legendary "Bagholder Emeritus." This garland is for your patience.
2. The Resurrection (Jan 2026)
The Breakout: We have finally cleared the ₹625 level. In technical terms, the "Ghost of 2010" has been exorcised.
The Volume: The massive green bars at the bottom are the "Electric Shock" that brought this 15-year-old corpse back to life.
3. Fundamental "Dark" Truths
Copper is the New Blood: The world needs copper for EVs and AI, and HINDCOPPER is finally waking up to realize it’s the only primary producer in the country.
Inflation Reality: ₹600 in 2010 is not the same as ₹600 in 2026. While the price has "broken out," the purchasing power of those 2010 buyers is still in the ICU.
Strategy: How to Trade a Ghost?
Entry: Only if you have a pulse. The breakout at ₹625 is the "Entry of the Century."
Support: ₹600 is now the "Floor of the Mausoleum." If we stay above it, the afterlife looks bright.
Target: ₹850. Let's give those 2010 buyers some actual profit before the next decade begins.

SBICARDS : Everyone Gave Up… That’s When Bases Are Born📊 SBI Cards & Payment Services Limited – Weekly Technical Analysis
Timeframe: Weekly
CMP: ~₹771
Trend Context: Larger base formation after extended correction
Structure: ABC corrective wave + potential Cup & Handle completion
🔍 Big Picture Structure (What’s Really Happening)
SBI Cards earlier witnessed strong selling from an extended retracement / supply zone (113%–127%), which is a classic area where:
Long-term holders book profits
Institutions reduce exposure
Late breakout buyers get trapped
This led to a controlled ABC correction, not a breakdown of the long-term structure.
📘 Markets correct to reset positioning, not to punish everyone.
📐 Why the Marked Levels Matter (Trading Psychology Explained)
🟦 ABC Completion / Demand Zone: ₹720 – ₹770
This is the most important zone on the chart.
🧠 Why price can react here:
Sellers from higher levels have largely exited
Value buyers step in near prior accumulation areas
Shorts start covering as downside momentum fades
👉 This zone represents fear exhaustion, where selling pressure typically dries up.
📌 It also aligns with a potential “handle” completion of a larger Cup & Handle pattern.
🔴 Invalidation / Risk Level: ₹690 (Day Close Below)
Breakdown below this level damages base structure
Psychology shifts from “buying dips” to “capital protection”
Confidence erosion can invite fresh selling
📉 Below ₹690, downside risk increases sharply.
🔑 Upside Levels & Targets (Why They Matter)
🟠 First Target Zone: ₹990 – ₹1,020
Prior supply memory
Trapped traders look to exit here
Profit booking likely on first approach
📘 Markets often hesitate where pain was previously created.
🟢 Second Target: ₹1,127
Larger pattern projection
Psychological round-number magnet
Momentum & FOMO participation zone
📈 Acceptance above ₹1,020 can accelerate price toward this zone.
🟢 Bullish Scenario (Primary Probability)
If price:
Holds above ₹720–770
Forms a base or higher low on weekly chart
Then:
Gradual recovery toward ₹990–1,020
Break & sustain → ₹1,127
Confirms base-to-expansion transition
📘 Strong bases often look boring before they explode.
🔴 Bearish Risk Scenario
If price:
Closes below ₹690
Then:
Base structure weakens
Buyers step aside
Market searches for deeper liquidity zones
📉 This reflects loss of confidence, not just technical damage.
🎓 Educational Takeaways
Corrections end where fear peaks, not where hope feels strong
Fibonacci & pattern zones work because crowds react together
Bases form quietly; breakouts are loud
The best opportunities feel uncomfortable at entry
🧠 Emotion Map of This Chart
Zone Dominant Emotion
Highs Greed & Euphoria
Decline Denial
Base zone Fear vs Opportunity
Breakout Relief & Momentum
Targets FOMO
📘 Charts are stories of crowd psychology, not just price.
🔮 Price Outlook (Educational Projection)
Above ₹770: Base confirmation improves
Above ₹1,020: Momentum revival
Upside targets: ₹1,127
Below ₹690: Caution, structure weakens
🧾 Conclusion
SBI Cards appears to be transitioning from correction to base formation.
The ₹720–770 zone is a decision area that can decide whether the stock moves into a new accumulation phase or slips into deeper weakness.
📌 Big moves are born from boring bases.
⚠️ Disclaimer
This analysis is for educational purposes only.
I am not a SEBI registered analyst. Markets involve risk, and I can be wrong.
Please consult your financial advisor before making any trading or investment decisions.

#DCBBANK - BreakOut in DTF with Volume Script: DCBBANK
Key highlights: 💡⚡
📈 C&H BreakOut in Daily Time Frame
📈 Volume spike during Breakout
📈 Base BreakOut
📈 RS Line making 52WH
📈 MACD Crossover
BUY ONLY ABOVE 200 DCB
⏱️ C.M.P 📑💰- 199.62
🟢 Target 🎯🏆 – 12%
⚠️ Stoploss ☠️🚫 – 6%
⚠️ Important: Market conditions are BAD, Avoid entering any Trade. Protect Capital Always
⚠️ Important: Always Exit the trade before any Event.
⚠️ Important: Always maintain your Risk:Reward Ratio as 1:2, with this RR, you only need a 33% win rate to Breakeven.
✅ Boost and Follow to never miss a new idea!✅
Disclaimer: I am not SEBI Registered Advisor. My posts are purely for training and educational purposes. Not a BUY or SELL recommendation.
Eat🍜 Sleep😴 TradingView📈 Repeat 🔁
Happy learning with MMT. Cheers!🥂

UJJIVANSFB: Testing IPO High with Triple Top, Chart of the MonthFrom IPO Highs to Recovery: Is Ujjivan Small Finance Bank Finally Breaking Out After Six Years? After Posting Robust Q3 FY26 Numbers with asset quality improving and Micro Finance Cycle Turning Back. Let's Analyze in "Chart of the Month"
As per the Latest SEBI Mandate, this isn't a Trading/Investment RECOMMENDATION nor for Educational Purposes; it is just for Informational purposes only. The chart data used is 3 Months old, as Showing Live Chart Data is not allowed according to the New SEBI Mandate.
Disclaimer: "I am not a SEBI REGISTERED RESEARCH ANALYST AND INVESTMENT ADVISER."
This analysis is intended solely for informational purposes and should not be interpreted as financial advice. It is advisable to consult a qualified financial advisor or conduct thorough research before making investment decisions.
Price Action:
- Current Price: ₹63.06
- 52-Week High: ₹68.00
- 52-Week Low: ₹13.90
- Distance from All-Time High: Approaching IPO highs after prolonged consolidation
Volume Spread Analysis:
Volume Characteristics:
- Base Period (2020-2023): Subdued volumes indicating consolidation
- Breakout Period (2024-present): Notable volume expansion
- Recent spike visible in January 2026 showing institutional participation
- Current volume: 442.36M (significantly above 20-day average of 271.01M)
- Volume surge of 63% suggests strong conviction in the breakout
Volume-Price Relationship:
- Price advance accompanied by rising volume - bullish confirmation
- No negative divergences observed
- Accumulation visible during base formation with sporadic volume spikes
Base Formation & Major Patterns:
Rounding Bottom Pattern (2020-2025):
- The stock has carved out a massive rounding bottom base spanning approximately 5 years
- The blue curved trendline marks the U-shaped recovery trajectory
- Base Formation Period: Mid-2020 to Late-2024
- Base Depth: From ₹65-68 levels down to ₹13.90 (approximately 80% decline)
- This extended consolidation suggests thorough distribution at lower levels and strong accumulation
Cup and Handle Formation:
- A textbook cup & Handle pattern is visible in the 2019-2025 period
- Left rim formed in early 2024 at ₹65
- Cup bottom at ₹30-35 range (2024-2025)
- Right rim currently forming at ₹63-68 levels
- Handle consolidation occurred during late 2025
Support & Resistance Levels:
Major Resistance Zones:
- R1 (Immediate): ₹65.00-68.00 (IPO highs)
- This level may act triple top resistance (2020, 2024, 2026)
- Critical breakout zone - sustained move above this unlocks higher targets
- R2 (Psychological): ₹70.00
- R3 (Extension Target): ₹85-90 (measured move from base)
Major Support Levels:
- S1 (Immediate): ₹55.00-58.00 (recent breakout zone)
- S2 (Strong): ₹45.00-48.00 (rounding bottom neckline)
- S3 (Critical): ₹30.00-35.00 (2024-2025 lows, base support)
Trend Analysis:
Long-Term Trend:
- The stock was in a prolonged downtrend from 2020 to 2022
- Transitioned into consolidation/basing phase from 2022 to 2024
- Currently attempting to reverse into an uptrend as of late 2025/early 2026
Medium-Term Trend:
- Strong uptrend established from November 2024 onwards
- Higher highs and higher lows pattern intact
- Moving along the upper channel of the rounding bottom
Short-Term Momentum:
- Explosive momentum in January 2026 (+19% move)
- Stock attempting to reclaim IPO highs for the second time
- Price action suggests breakout on cards from 6-year consolidation
Key Technical Observations:
Breakout Attempt #2
- This is the "2nd time to break IPO Highs"
- First attempt in early 2024 failed, leading to a correction
- Current attempt appears stronger with better fundamentals and volume support
- Risk of triple top failure exists if price fails at ₹65-68 zone again
Risks & Triple Top Persistence:
- The ₹65-68 zone has proven to be formidable resistance over 6 years
- Three distinct peaks at this level (2020, 2024, 2026) create triple top risk
- A decisive close above ₹68 with sustained volume would negate this pattern
- Failure here could lead to another correction toward ₹45-48 support
Fundamental & Sectoral Backdrop:
Recent Financial Performance (Q3 FY26):
Profitability Metrics:
- Net Profit: ₹186 crore (up 71% YoY from ₹109 crore)
- Sequential Growth: 53% QoQ from ₹121.72 crore in Q2 FY26
- Nine-Month Performance: ₹411 crore (down 36% YoY) - signals recovery from challenging period
- Net Interest Income: ₹1,000 crore (all-time high, up 12.8% YoY)
- Interest Earned: ₹1,752 crore (all-time high, up 16.12% YoY)
Balance Sheet Growth:
- Gross Loan Book: ₹37,057 crore (up 21.6% YoY)
- Total Deposits: ₹42,223 crore (up 22.4% YoY)
- Disbursements: ₹8,293 crore (highest ever quarterly disbursements)
- Credit-Deposit Ratio: 88% (healthy and stable)
- CASA Ratio: 27.3% (up from 25.1% YoY)
Asset Quality Improvement:
- Gross NPA: 2.45% (improved from 2.68% in December 2024)
- Current position better than historical average of 4.84%
- Portfolio at Risk (PAR): 3.98% (down from 4.44% QoQ and 5.36% YoY)
- Provisions: ₹195 crore (down from ₹235 crore in Q2, signaling improvement)
- Micro banking collection efficiency: 99.70% (December 2025)
Business Strategy & Positioning:
Portfolio Diversification:
- Shift from unsecured microfinance to secured lending
- Secured portfolio: ₹17,829 crore (up 48.8% YoY), now 48.1% of total book
- Growth in housing loans, MSME finance, gold loans, vehicle loans, and agri loans
- Microfinance exposure reducing as part of risk mitigation strategy
Target Market:
- Focus on financially underserved segments
- Mass market banking for economically active poor customers
- Operating since 2005 (as NBFC), became Small Finance Bank in 2017
- Strong presence in rural and semi-urban markets
Growth Drivers:
- Record quarterly disbursements driven by all-around performance
- Unsecured and secured products both contributing
- Digital transformation initiatives underway
- Branch network expansion supporting deposit mobilization
Key Concerns:
- Nine-month profit decline of 36% YoY raises sustainability questions
- Non-operating income constituted 121% of PBT in Q3 (concerning dependency)
- Stretched valuations with limited margin for error
- Success hinges on sustaining Q3 momentum
Small Finance Bank Sector Outlook:
Industry Growth Trajectory:
- SFB sector growing at 20-25% CAGR
- Total advances projected to exceed ₹2 trillion by FY26
- Deposits reached ₹3.15 lakh crore in FY25
- Expected to grow to ₹3.77 lakh crore in FY26
Regulatory Environment:
- RBI reduced priority sector lending norms from 75% to 60% in June 2025
- Provides greater flexibility for credit diversification
- Pathway to universal banking license for qualifying SFBs
- AU Small Finance Bank received approval for universal bank transition they can do it too
Sector Challenges:
- Asset quality stress in microfinance portfolios across sector is Improving
- GNPA in microfinance segment spiked to 6.8% in FY25 from 3.2% in FY24
- High operating costs (5.5% of assets vs 2% for broader banking sector)
- Net Interest Margins declining sector-wide (from 7.4% to 6.6%)
- Modest CASA ratios (26.2% average) leading to higher cost of funds
- Return on Assets dropped from 2.1% to 1.0% in FY25 across SFBs
Competitive Landscape:
- Competition from commercial banks, fintech lenders, NBFCs
- Pressure on margins due to intense competition
- Need for continuous digital transformation
- Branch-intensive operating model with mandated rural presence
Microfinance Industry Trends:
Market Size & Growth:
- Microfinance sector loan portfolio: ₹3.48 lakh crore (as of December 2024)
- Expected to reach ₹5 lakh crore by FY27
- Serving over 8 crore clients across India
- Sector contributes 2-3% to India's GVA
Recent Developments:
- 80% growth in loan disbursals in recent periods
- Digital transformation accelerating across industry
- Focus on financial literacy programs
- RBI regulatory changes providing operational flexibility
- Asset quality challenges persist with over-leveraging concerns
Risk Factors:
- Vulnerable to regional economic shocks
- Weather-dependent borrower segments
- Competition from traditional banks entering microfinance space
- Regulatory compliance requirements
- Portfolio concentration risks in certain geographies
Risk Assessment:
Technical Risks:
- Triple top pattern risk at ₹65-68 resistance zone
- Failure to decisively break IPO highs could trigger profit booking
- Potential pullback to ₹48-55 support if breakout fails
- Overextended short-term momentum
Fundamental Risks
- Sustainability of Q3 profit recovery remains unproven
- High reliance on non-operating income
- Microfinance asset quality pressures sector-wide
- Operating cost structure higher than traditional banks
- Modest CASA ratio impacting cost of funds
Sector Risks:
- Regulatory changes impacting business model
- Competition intensifying from multiple fronts
- Economic slowdown could impact borrower repayment capacity
- Regional concentration exposing to local risks
Bull Case Scenario:
- Successful breakout above ₹68
- Strong Q3 FY26 results indicate operational turnaround
- Asset quality improvement trajectory well-established
- Secured lending mix improving risk profile
- Potential universal banking license in future
- Sectoral tailwinds from financial inclusion drive
Bear Case Scenario:
- Failure at ₹65-68 resistance for third time
- Nine-month profit decline raises sustainability concerns
- Sector-wide margin compression continues
- Asset quality deterioration in microfinance segment
- High operating costs pressuring profitability
- Regulatory headwinds or policy changes
My 2 Cents:
NSE:UJJIVANSFB presents an interesting technical setup the stock is at a critical juncture - attempting to break out from a 6-year consolidation. Success above ₹68 could unlock significant upside, while failure creates triple top risk. The fundamental improvement supports the technical breakout attempt, but sustainability remains a key question mark given the nine-month profit decline.
Full Coverage on my Mid-Week Newsletter coming Wednesday.
Keep in the Watchlist and DOYR.
NO RECO. For Buy/Sell.
📌Thank you for exploring my idea! I hope you found it valuable.
🙏FOLLOW for more
👍BOOST if you found it useful.
✍️COMMENT below with your views.
Meanwhile, check out my other stock ideas on the right side until this trade is activated. I would love your feedback.
As per the Latest SEBI Mandate, this isn't a Trading/Investment RECOMMENDATION nor for Educational Purposes; it is just for Informational purposes only. The chart data used is 3 Months old, as Showing Live Chart Data is not allowed according to the New SEBI Mandate.
Disclaimer: "I am not a SEBI REGISTERED RESEARCH ANALYST AND INVESTMENT ADVISER."
This analysis is intended solely for informational purposes and should not be interpreted as financial advice. It is advisable to consult a qualified financial advisor or conduct thorough research before making investment decisions.

Wipro is Look Like Cup & Handle Pattern Wipro is making a cup and handle pattern on the weekly chart. It will move to 322 ,and if it breaks this level, chances are it will break its high 366

BUY TODAY SELL TOMORROW for 5%DON’T HAVE TIME TO MANAGE YOUR TRADES?
- Take BTST trades at 3:25 pm every day
- Try to exit by taking 4-7% profit of each trade
- SL can also be maintained as closing below the low of the breakout candle
Now, why do I prefer BTST over swing trades? The primary reason is that I have observed that 90% of the stocks give most of the movement in just 1-2 days and the rest of the time they either consolidate or fall
Cup & Handle Breakout in PNB
BUY TODAY SELL TOMORROW for 5%

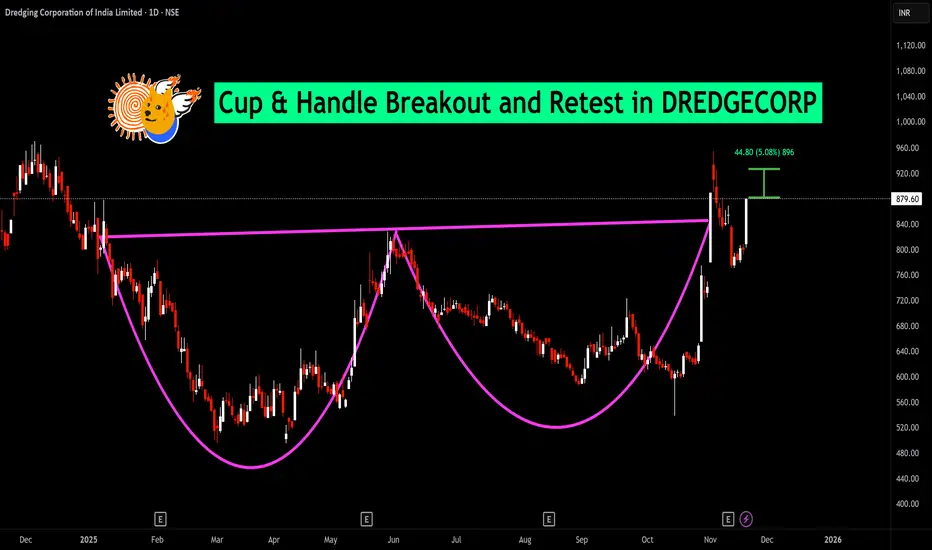
BUY TODAY SELL TOMORROW for 5%DON’T HAVE TIME TO MANAGE YOUR TRADES?
- Take BTST trades at 3:25 pm every day
- Try to exit by taking 4-7% profit of each trade
- SL can also be maintained as closing below the low of the breakout candle
Now, why do I prefer BTST over swing trades? The primary reason is that I have observed that 90% of the stocks give most of the movement in just 1-2 days and the rest of the time they either consolidate or fall
Cup & Handle Breakout in DREDGECORP
BUY TODAY SELL TOMORROW for 5%

BUY TODAY SELL TOMORROW for 5% - BTST STOCK OPTIONDON’T HAVE TIME TO MANAGE YOUR TRADES?
- Take BTST Stock Option trades at 3:25 pm every day
- Try to exit by taking 4-7% profit of each trade
-Resistance Breakout in ASIANPAINT
BUY TODAY, SELL TOMORROW for 5%
O

union bank - cup and handle breakout union bank has a cup and handle breakout chart pattern.
retested.
entry - 163
sl 156
t1 174
t2 195
risk to reward 1:4
wait time a few weeks.

BUY TODAY SELL TOMORROW for 5%DON’T HAVE TIME TO MANAGE YOUR TRADES?
- Take BTST trades at 3:25 pm every day
- Try to exit by taking 4-7% profit of each trade
- SL can also be maintained as closing below the low of the breakout candle
Now, why do I prefer BTST over swing trades? The primary reason is that I have observed that 90% of the stocks give most of the movement in just 1-2 days and the rest of the time they either consolidate or fall
Cup & Handle Breakout in RAJRATAN
BUY TODAY SELL TOMORROW for 5%

Canara Bank cmp 154.87 seen by the Monthly Chart view since listCanara Bank cmp 154.87 seen by the Monthly Chart view since listed
- Support Zone 129 to 142 Price Band
- Resistance Zone 155 to ATH 164.22 Price Band
- Bullish Cup and Handle Breakout done above Support Zone
- Stock Price ready for New ATH beyond current ATH 164.22 level
- Double Bullish patterns of Rounding Bottom inclusive of Cup and Handle
- Basis both Technical Chart patterns, the logical target price comes to +/- 300

Reliance Industries Ltd – 1D Chart Update || Pattern-DrivenTimeframe: Daily (1D) || Pattern: Cup & Handle (Bullish)
LTP: ₹1,592
Reliance Industries is showing a classic Cup & Handle formation on the daily chart, indicating strong accumulation and a potential continuation of the prevailing uptrend. Price action remains constructive, supported by rising volumes and positive momentum indicators.
Key Technical Levels:
Support: ₹1,433 | ₹1,335
Resistance: ₹1,709 | ₹1,863
A sustained move above the handle breakout zone can open the door for further upside toward the mentioned resistance levels, while the supports act as crucial demand zones on any corrective pullback.
Company & Sector Updates:
Reliance continues to benefit from strength across its diversified businesses. The Oil-to-Chemicals segment is supported by favorable refining economics, while Jio and Retail remain long-term growth drivers. Strategic focus on technology, digital expansion, and new-age businesses like AI and FMCG strengthens the company’s future outlook. Market participants are also closely watching developments around value unlocking and upcoming strategic initiatives.
View:
Overall structure and fundamentals indicate a positive bias, with trend continuation likely as long as the stock holds above key support levels.
For analysis of any stock, feel free to comment the stock name below.
This analysis is for educational and informational purposes only. It does not constitute investment advice or a recommendation to buy or sell any security. Market investments are subject to risk, and past performance does not guarantee future results. Please consult a SEBI-registered financial advisor before making any investment decisions. The author is not responsible for any losses arising from the use of this information.

IndusInd Bank Ltd || 1 Day || Cup and handle IndusInd Bank Ltd — Detailed Analysis
Company Intro:
IndusInd Bank Ltd is one of India’s leading private sector banks offering retail, corporate, and digital banking services across the country. The bank has a strong footprint in consumer credit, deposits, and transaction banking, catering to millions of customers across urban and semi-urban regions.
Technical Perspective — Cup & Handle Breakout
The daily chart shows a classic Cup & Handle pattern, a bullish continuation setup formed over several months.Price has decisively broken above the key breakout level ~₹890, validating the pattern’s breakout.This breakout suggests a shift from consolidation to an upward trend re-acceleration.
Sustained trading above ₹890 keeps the structure bullish in the short to medium term.
📍 Resistance Levels (Upside):
• ₹930 — immediate minor resistance
• ₹1,030 — major resistance zone above
📍 Support Levels (Downside):
• ₹830 — key support if price retraces below ( Bearish)
• ₹710 — structural support
Trend Bias:
• Bullish above ₹890
• Neutral to Bearish below ₹830 / ₹710
Latest Update
Some macro/sector views indicate a softer Q3 earnings outlook relative to peers.
Source _Business Today
Broader corporate news includes regulatory probes related to past accounting discrepancies which the company is cooperating with.
Source _The Economic Times
👉 If you need analysis on any company or stock, comment below.
This analysis is for educational purposes only and should not be considered as investment advice. The author is not responsible for any losses arising from the use of this information. Investors are advised to consult a SEBI-registered investment advisor before taking any trading or investment decisions.

BUY TODAY SELL TOMORROW for 5%DON’T HAVE TIME TO MANAGE YOUR TRADES?
- Take BTST trades at 3:25 pm every day
- Try to exit by taking 4-7% profit of each trade
- SL can also be maintained as closing below the low of the breakout candle
Now, why do I prefer BTST over swing trades? The primary reason is that I have observed that 90% of the stocks give most of the movement in just 1-2 days and the rest of the time they either consolidate or fall
Cup & Handle Breakout in RICOAUTO
BUY TODAY SELL TOMORROW for 5%

RACL Geartech cmp 1185.10 by Weekly Chart viewRACL Geartech cmp 1185.10 by Weekly Chart view
- Support Zone 1005 to 1115 Price Band
- Resistance Zone 1265 to 1350 Price Band
- Rising Support Trendline seems taking positive trend
- Volumes more by selling post Resistance Zone rejection
- Bullish Cup & Handle inside probable Cup & Handle (hopefully)
- Support Zone Breakout attempts are seen in the making process

BUY TODAY SELL TOMORROW for 5%DON’T HAVE TIME TO MANAGE YOUR TRADES?
- Take BTST trades at 3:25 pm every day
- Try to exit by taking 4-7% profit of each trade
- SL can also be maintained as closing below the low of the breakout candle
Now, why do I prefer BTST over swing trades? The primary reason is that I have observed that 90% of the stocks give most of the movement in just 1-2 days and the rest of the time they either consolidate or fall
Cup & Handle Breakout & Retest in ASHAPURMIN
BUY TODAY SELL TOMORROW for 5%