IDFC First Bank cmp 83.79 by Weekly Chart viewIDFC First Bank cmp 83.79 by Weekly Chart view
- Support Zone 66 to 75 Price Band
- Resistance Zone 84 to 93 then ATH 100.70
- Bullish Cup and Handle setup made on the chart
- Falling Resistance Trendlines Breakouts well sustained
- Volumes are in close sync with the average traded quantity
Cupandhandlepattern

BUY TODAY SELL TOMORROW for 5%DON’T HAVE TIME TO MANAGE YOUR TRADES?
- Take BTST trades at 3:25 pm every day
- Try to exit by taking 4-7% profit of each trade
- SL can also be maintained as closing below the low of the breakout candle
Now, why do I prefer BTST over swing trades? The primary reason is that I have observed that 90% of the stocks give most of the movement in just 1-2 days and the rest of the time they either consolidate or fall
Cup & Handle Breakout in INFOBEAN
BUY TODAY SELL TOMORROW for 5%

BUY TODAY SELL TOMORROW for 5%DON’T HAVE TIME TO MANAGE YOUR TRADES?
- Take BTST trades at 3:25 pm every day
- Try to exit by taking 4-7% profit of each trade
- SL can also be maintained as closing below the low of the breakout candle
Now, why do I prefer BTST over swing trades? The primary reason is that I have observed that 90% of the stocks give most of the movement in just 1-2 days and the rest of the time they either consolidate or fall
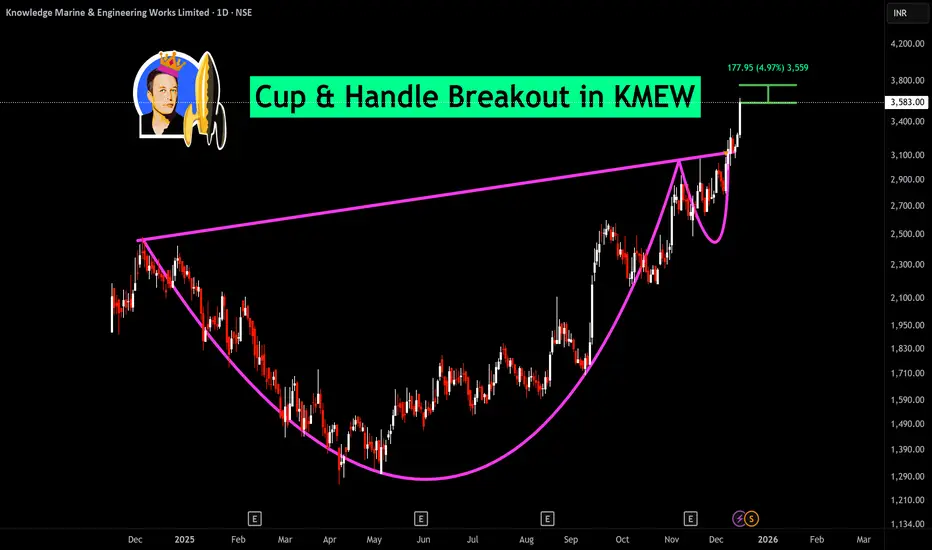
Cup & Handle Breakout in KMEW
BUY TODAY SELL TOMORROW for 5%
BUY TODAY SELL TOMORROW for 5%DON’T HAVE TIME TO MANAGE YOUR TRADES?
- Take BTST trades at 3:25 pm every day
- Try to exit by taking 4-7% profit of each trade
- SL can also be maintained as closing below the low of the breakout candle
Now, why do I prefer BTST over swing trades? The primary reason is that I have observed that 90% of the stocks give most of the movement in just 1-2 days and the rest of the time they either consolidate or fall
Cup & Handle Breakout in RAMCOSYS
BUY TODAY SELL TOMORROW for 5%

BUY TODAY SELL TOMORROW for 5%DON’T HAVE TIME TO MANAGE YOUR TRADES?
- Take BTST trades at 3:25 pm every day
- Try to exit by taking 4-7% profit of each trade
- SL can also be maintained as closing below the low of the breakout candle
Now, why do I prefer BTST over swing trades? The primary reason is that I have observed that 90% of the stocks give most of the movement in just 1-2 days and the rest of the time they either consolidate or fall
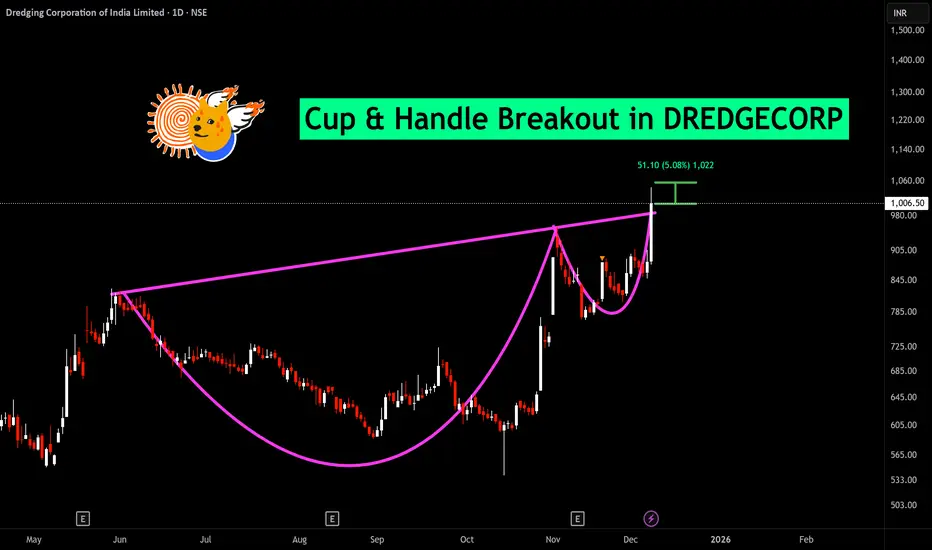
Cup & Handle Breakout in DREDGECORP
BUY TODAY SELL TOMORROW for 5%
BUY TODAY SELL TOMORROW for 5%DON’T HAVE TIME TO MANAGE YOUR TRADES?
- Take BTST trades at 3:25 pm every day
- Try to exit by taking 4-7% profit of each trade
- SL can also be maintained as closing below the low of the breakout candle
Now, why do I prefer BTST over swing trades? The primary reason is that I have observed that 90% of the stocks give most of the movement in just 1-2 days and the rest of the time they either consolidate or fall
Cup & Handle Breakout in KMEW
BUY TODAY SELL TOMORROW for 5%

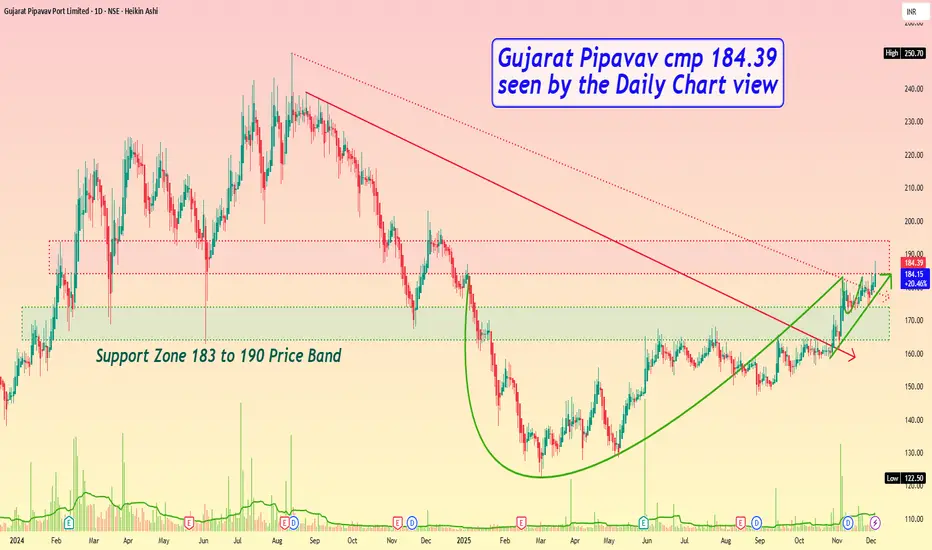
Gujarat Pipavav cmp 184.39 by Daily Chart viewGujarat Pipavav cmp 184.39 by Daily Chart view
- Support Zone 164 to 174 Price Band
- Resistance Zone 184 to 194 Price Band
- Bullish Cup & Handle formed by Resistance Zone neckline
- Breakout from both Falling Resistance Trendline well sustained
- Volumes spiking heavily to well above and in sync with avg traded qty
- Positively trending Technical Indicators BB, EMA, MACD, RSI, SAR, SuperTrend
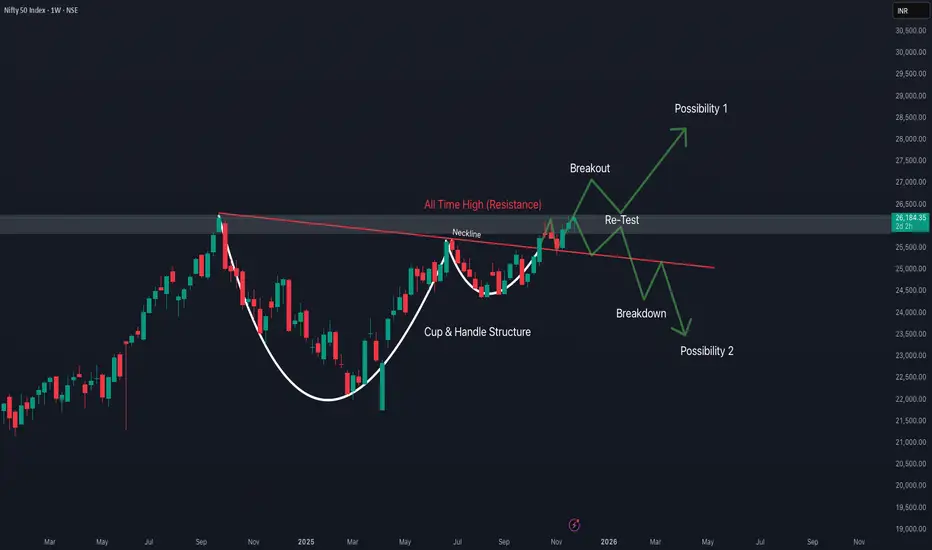
NIFTY Cup & Handle pattern price action-Trend - Bullish
-Pattern - Cup & Handle
-Break out & retest
-Current week price is on pull back from ATH
Target - 30,800 Level

BUY TODAY SELL TOMORROW for 5%DON’T HAVE TIME TO MANAGE YOUR TRADES?
- Take BTST trades at 3:25 pm every day
- Try to exit by taking 4-7% profit of each trade
- SL can also be maintained as closing below the low of the breakout candle
Now, why do I prefer BTST over swing trades? The primary reason is that I have observed that 90% of the stocks give most of the movement in just 1-2 days and the rest of the time they either consolidate or fall
Cup & Handle Breakout in KTKBANK
BUY TODAY SELL TOMORROW for 5%

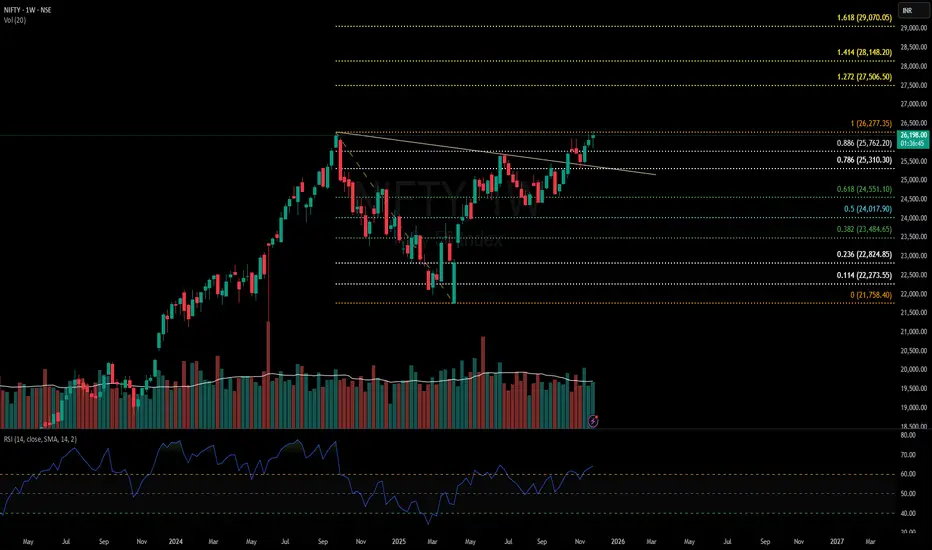
NIfty50 Analysis: Is it start of new bull run or a bull trap?Nifty50 Has given a cup& handle breakout and has already retested this breakout.
Currently, it is hovering near ATH and already looks ready for a breakout.
If this breakout sustains, we might see a good rally coming till budget(Feb'26) and levels to watch according to fib are 27500, 28150 & 29000.
However, December is a favourite season for FIIs to offload money and a correction is historically seen during Christmas season. So, there is a high probability of a bull trap formation as well.
25300 will be a crucial support for Nifty. a breakdown of this level will be confirmation of bull trap and we might see a sharp fall towards 24000 level.
I will suggest to keep a watch on Nifty price action if you have any swing trades open.
Cup & Handle Breakout in HDFCLIFEThe chart idea posted shows a classic Cup & Handle breakout in HDFC Life Insurance Co. Ltd.
, signaling a bullish opportunity. The cup features a rounded bottom, followed by a handle—the short consolidation before price surges above resistance. This breakout is confirmed by strong buying volume and an 18% move in the option price, indicating momentum. Traders commonly enter above the handle’s high, set stop-loss below the handle, and target gains equivalent to the cup’s depth projected upward. The Cup & Handle pattern is reliable and widely used for trend continuation trades

Weekly Price Action in Nifty 50The chart shows a classic Cup & Handle pattern
The cup is wide and smooth – a strong long-term accumulation pattern.
The handle is small, healthy, and formed near resistance → a sign of strength.
These patterns on the weekly chart typically lead to multi-month rallies.
The chart structure is strongly bullish unless Nifty falls below 25,500.
Inverted Cup & Handle Breadown in HALHAL is showing a textbook inverted cup and handle breakdown. Price failed to bounce above key support and triggered sharp downside, confirmed by a spike in put options. Pattern projects lower levels ahead—bearish setup for spot and options traders. Watch for continued weakness below support.

SOL DUMP TO THE $40YES, YOU SEEN RIGHT
CRYPTO:SOLUSD
SOL ready with multiple negative patterns.
1. all time resistance
2. triple top
3. cup and handle failure
First pattern is already activated and triple top near to active.
Reverse scenario
take support from major strong support. cup and handle breakout
🧠 Always DYOR (Do Your Own Research)
⚖️ This is not financial advice or suggestion
👉 “Risk Is Real 💸 Stay Practical🚀”
💬 Please feel free to ask any questions (It's Free)

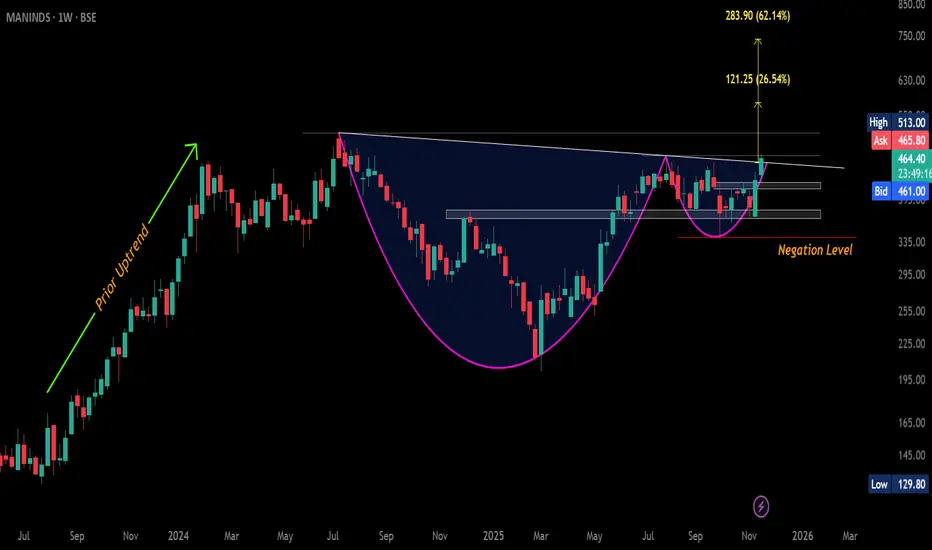
#MANINDS: Big Weekly Breakout Loading!CMP: 464.40
A large weekly cup-and-handle is taking shape, with a strong bullish candle signaling a breakout attempt.
🛡 Supports: 437 / 523 – 413 / 380 – 367
🚧 Resistances: 469 / 513 (ATH)
⚡️ Breakout Trigger: WCB above 469
🎯 Pattern Targets: 578 / 740+ (~26% & ~62% from CMP)
⛔ Negation: WCB below 340.90
#ManInds #CupAndHandle #ChartPattern #PriceAction #Breakout #LongTerm
📌 #Disclaimer: This analysis is shared for educational purposes only. It is not a buy/sell recommendation. Please do your own research before making any trading decisions.
BUY TODAY SELL TOMORROW for 5%DON’T HAVE TIME TO MANAGE YOUR TRADES?
- Take BTST trades at 3:25 pm every day
- Try to exit by taking 4-7% profit of each trade
- SL can also be maintained as closing below the low of the breakout candle
Now, why do I prefer BTST over swing trades? The primary reason is that I have observed that 90% of the stocks give most of the movement in just 1-2 days and the rest of the time they either consolidate or fall
Cup & Handle Breakout in GRWRHITECH
BUY TODAY SELL TOMORROW for 5%

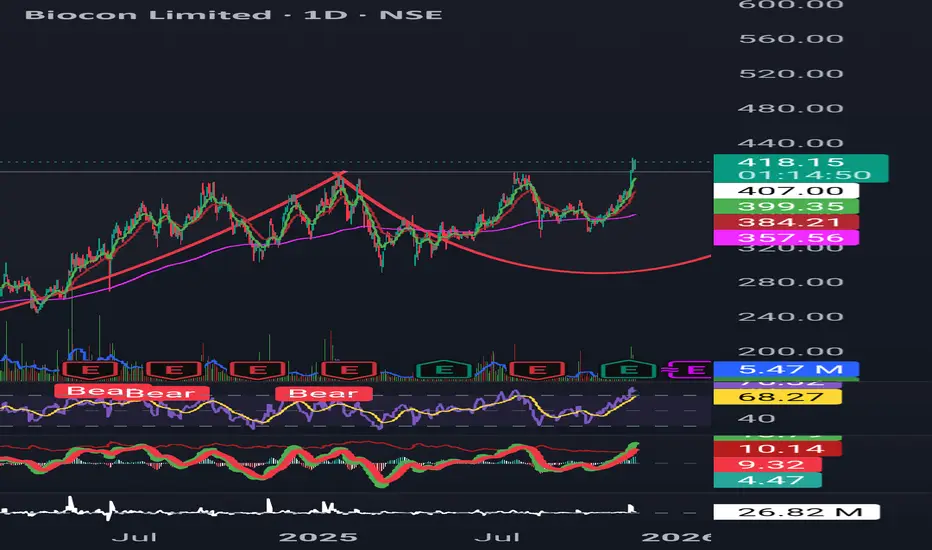
Biocon breaks out of 4-year consolidationStructure: Breakout from a long-term 4-year consolidation base
Volume: Strong expansion indicating institutional participation
Momentum:
RSI > 70 and holding → bullish trend zone
MACD positive and rising → trend confirmation
Trend:
9 EMA > 21 EMA > 200 EMA → multi-timeframe trend alignment
Sector Strength:
Pharma sector outperforming (Sun Pharma, JB Chem, Lupin, Biocon)
Broad-based buying visible across sector
Bias: Bullish as long as price sustains above breakout levels
Invalidation: Close back below breakout zone or loss of EMA/MACD trend
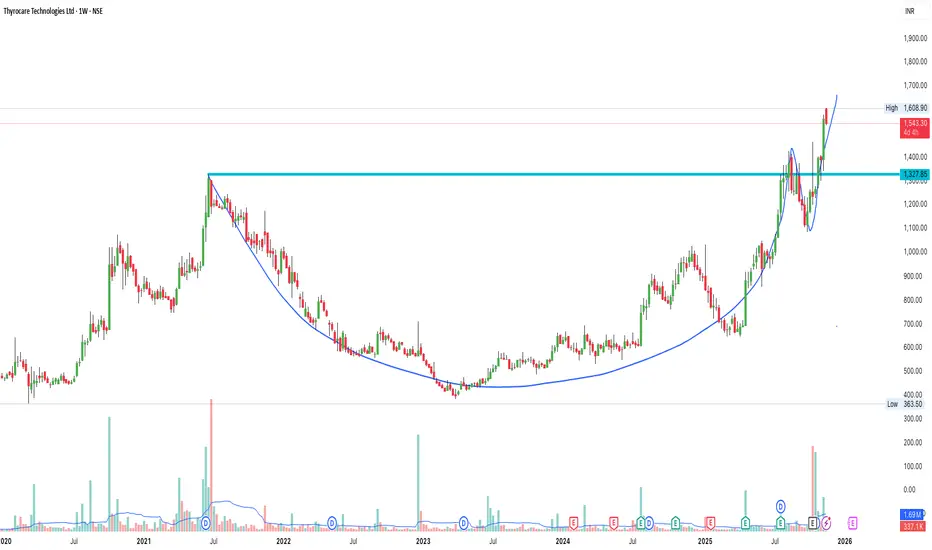
Thyrocare Technologies – Weekly Chart Breakout AnalysisCup & Handle pattern breakout visible on higher timeframe (1W).
Price has retested the breakout zone around ₹1325 and given a strong bounce with volume.
Key Points:
🔹 Multi-year Cup & Handle formation
🔹 Breakout + successful retest
🔹 Strong momentum candles after retest
🔹 Next potential zone: ₹1650 – ₹1750 (if momentum continues)
Support : ₹1325
Short-term trend : Bullish
Structure : Higher highs – Higher lows
Not a recommendation. Just sharing my chart study.
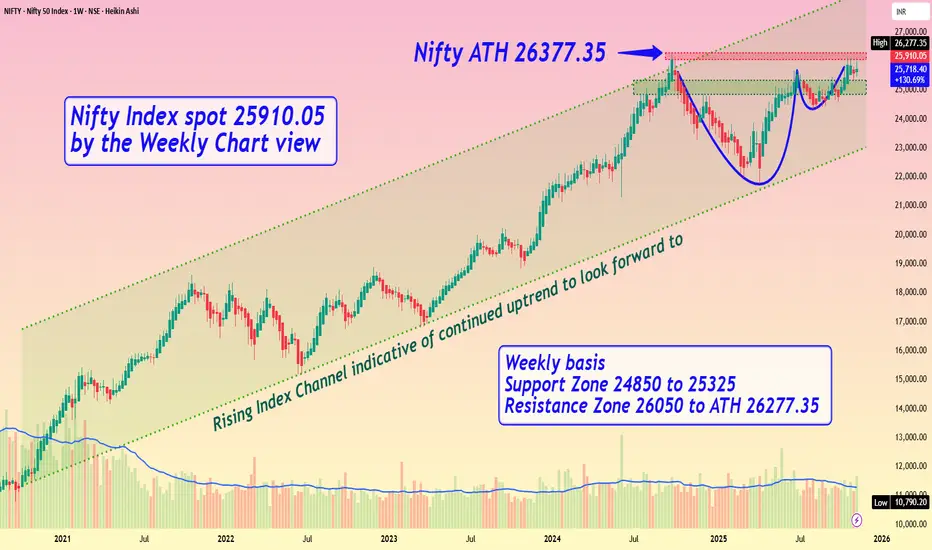
Nifty Index spot 25910.05 by the Weekly Chart viewNifty Index spot 25910.05 by the Weekly Chart view
- Weekly basis - Support Zone 24850 to 25325
- Weekly basis - Resistance Zone 26050 to ATH 26277.35
- Rising Index Channel indicative of continued uptrend to look forward to .....
- Bullish Cup and Handle pattern shows breakout expectation from Resistance Zone
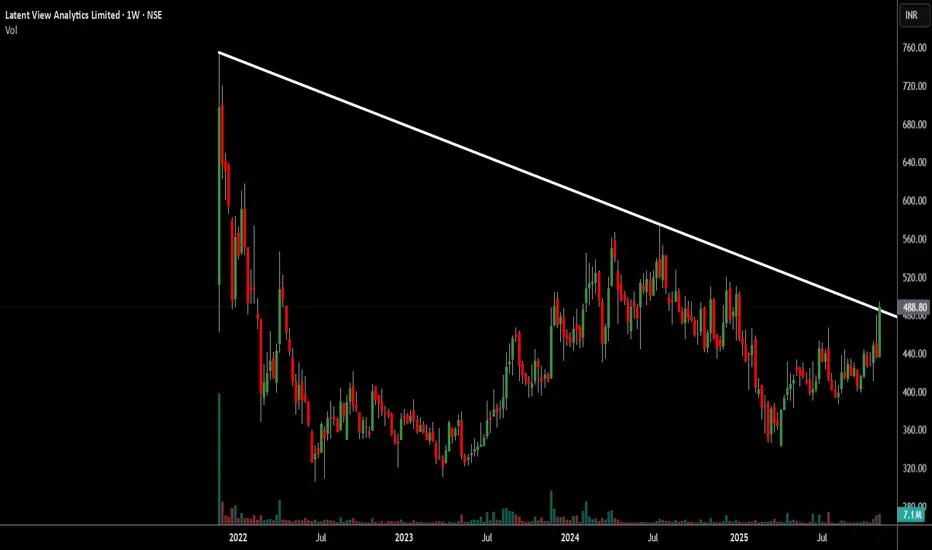
Latent View Analytics Ltd (Latentview) CnH Trendline BreakoutLatent View Analytics Limited (Nse: latentview) share is ready for a trendline breakout. The technical pattern appears to be a cup and handle. The stock is already closed outside the line. #latentview #breakout
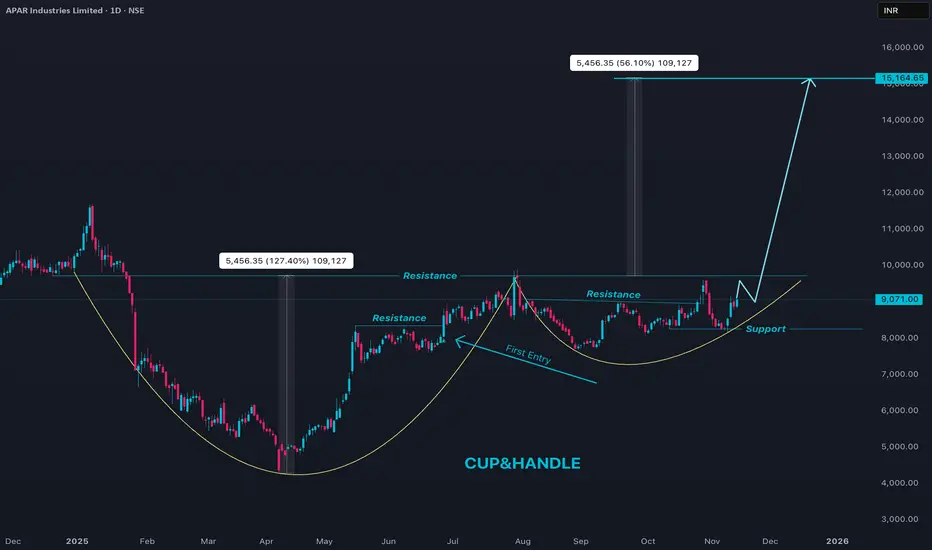
APARINDS Pyramid set upApar Industries (APARINDS) is currently in a strong uptrend on the daily chart, trading near the 9,000+ zone after a sharp rally over the past few months. Price is holding above key short-term moving averages, and momentum indicators like RSI and CCI are in bullish territory but not yet extremely overbought, which supports the ongoing up-move with healthy strength. Recent candles show sustained higher lows with only brief profit-booking dips, indicating buyers are still in control and using declines to accumulate.
In the near term, immediate support lies in the 8,600–8,700 band, where recent pullbacks have found buying interest and where short-term averages are clustering; holding above this zone keeps the trend intact. On the upside, every push to new highs can attract profit booking, so moves toward or above recent peaks around 9,100–9,300 are likely to see some volatility, but the broader structure remains bullish as long as price respects higher lows on the daily timeframe. For fresh positions, staggered entries on dips toward support with clearly defined stop-loss levels below the recent swing low is preferable to chasing extended candles, given the stock’s strong run-up and tendency for swift corrections after vertical rallies.
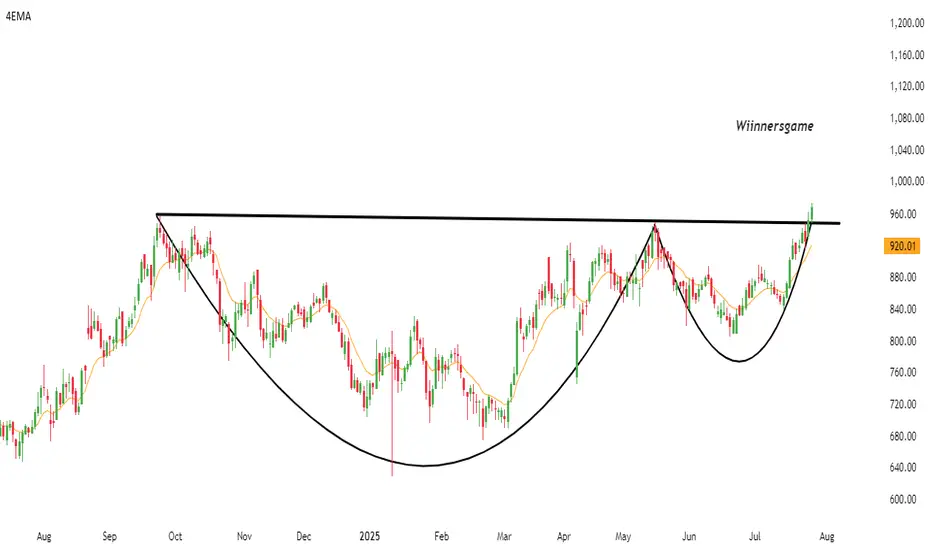
SHYAM METALLICS - PERFECT BULLISH TRADESHYAM METALICS, 970, (D) Stock has given CUP&HANDLE breakout on daily timeframe.
Good potential to test 1020/1075/1140 and 1200 if breakout gets sustained. Trade invalid if falls below 920 levels on 2 days closing basis.
BUY TODAY SELL TOMORROW for 5%DON’T HAVE TIME TO MANAGE YOUR TRADES?
- Take BTST trades at 3:25 pm every day
- Try to exit by taking 4-7% profit of each trade
- SL can also be maintained as closing below the low of the breakout candle
Now, why do I prefer BTST over swing trades? The primary reason is that I have observed that 90% of the stocks give most of the movement in just 1-2 days and the rest of the time they either consolidate or fall
Cup & Handle Breakout in IFBAGRO
BUY TODAY SELL TOMORROW for 5%
