Cyient LTD. Ready for flying Cyient LTD
Cup and Handle Pattern
After breakout of the Neckline, Retesting happened.
Now it's ready for the rally
Tgt 1 : 2278±
Tgt 2 : 2600±
Shared it for EDUCATIONAL PURPOSE. DO YOUR ANALYSIS FROM YOUR SIDE ALSO.
Cupandhandlepattern

Spend your CTC travelling on IRCTC with ECSTASY-Company is almost debt free.
-Company is expected to give good quarter
-Company has delivered good profit growth of 34.9% CAGR over last 5 years
-Company has a good return on equity (ROE) track record: 3 Years ROE 34.6%
-Company has been maintaining a healthy dividend payout of 43.0%
-Debtor days have improved from 158 to 118 days.

You don't have to be a SCHOLAR to see the pattern in DOLLAR IndsStandard Cup and handle Pattern on Weekly Chart.
Retracement from key dual supports.
Downside is almost arrested.
Low Risk High Reward.
Slow Mover. Momentum will pick up later as MACD is turning bullish too.

GenZ !!! Believe in TATA CONSULTANCY !!!- This Company needs no introduction at all.
- The larger picture is that of a Pole Flag Pattern.
- It can also be said that a cup is in formation.
Within the larger pattern, a Volatility Contraction Pattern has been witnessed.
At least 14% profits are clearly visible for the taking.

Hey Albert David ! Time for your Bid !Company is almost debt free.
Company has delivered good profit growth of 35.0% CAGR over last 5 years
PE of 8 vs Industry PE of 29
Dividend Yield 1.12 %
ROCE 17 %
ROE 12.2 %
Albert David Ltd is engaged in manufacturing and trading of Pharmaceutical Formulations, Infusion Solutions, Herbal Dosage Forms and Bulk Drugs by way of domestic sale or export.
During FY22, the Co. introduced two products i.e., Evacure and C3H in the market. It is expected that these two products will augment the revenue and profits of the Company.

Hey Albert David ! Time for your Bid !- Company is almost debt free.
- Company has delivered good profit growth of 35.0%
CAGR over last 5 years
- Dividend Yield 1.12 %
- PE 8 vs Industry PE of 29
Albert David Ltd is engaged in manufacturing and trading of Pharmaceutical Formulations, Infusion Solutions, Herbal Dosage Forms and Bulk Drugs by way of domestic sale or export.
During FY22, the Co. introduced two products i.e., Evacure and C3H in the market. It is expected that these two products will augment the revenue and profits of the Company.
The Co. will continue to focus on enhancing its presence organically as well as inorganically, both in the domestic and the international market.

Amaraja Batteries - Cup and Handle Cup and Handle in Making
Breakout above 710 on daily time frame
Supply zone : 800 - 1000
Support Zone : 590-610


ERIS has given ATH monthly breakout!Eris has beautifully broken ATH with a cup and handle pattern in monthly time frame.
Targets can be 1200, 1500+. One can enter at CMP and add some qty at 850
SL is below 780 weekly closing basis.
Idea shared for educational purposes only

Cup and handle breakout in Likhita!Likhita infra is a good investment stock.
Good cup and handle breakout will be confirmed once a weekly closing is done above 320.
Risky traders can enter today if stock closes above 320 with SL below 292 DCB.
Targets can be 370, 400++ in medium term.
Idea shared only for educational purposes.

AKZO NOBLE it has perfectly retested the old breakout zone
entry and stoploss mention on charts
chart is in bullish formation
this is for learning purpose only.
one can always analyse before entering the trade.

LALPATH LAB quality gemLALPATH LAB has given breakout from a longterm pricewise and timewise correction
it has clearly break the supply zone in daily tf as well as in weekly tf
one can go long from here
put STOPLOSS BELOW 2300 AREA OR BELOW 20EMA IN DAILY TF OR 200DEMA CLOSING BASIS ONLY
always trade with your own conviction
THIS IS JUST FOR EDUCATION AND LEARNING PURPOSE
hope u guys like the idea

NLC INDIA - FUTURE MULTIBAGGER STOCK!!!BUY - NLC INDIA LTD
CMP - Rs. 97
Target - 1: Rs. 133
Target - 2: Rs. 169
Target - 3: Rs. 234
.
.
Technicals - Trendline Breakout
.
This is just a view by an expert analyst, please invest at your own risk.
.
Follow me for more!

ASHOK LEYLAND - LONG BREAKOUT!!!BUY - ASHOK LEYLAND
CMP - Rs. 145
Target - 1: Rs. 195
Target - 2: Rs. 260
.
.
Technicals - Cup and Handle BO
.
This is just a view by an expert analyst, please invest at your own risk.
.
Follow me for more!

M&M: 2 month Cup and Handle BreakoutMAHINDRA & MAHINDRA or M&M is breaking out of a 2month cup and handle pattern and sustaining for 2 days above the breakout. It is important it sustains the breakout to move higher. Recent volume and RSI high.

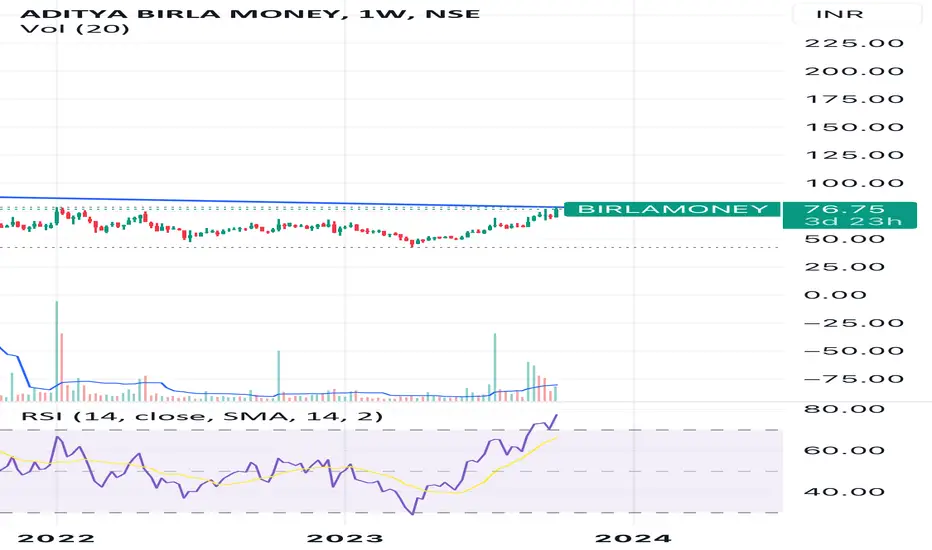
#UPDATE on AB Money!!On previous post of AB Money I mentioned the advantage of early entry, and by that I meant this. Today the 5 year long Cup and Handle pattern formed in AB Money(Finally) and now can be the good time to take entry in the stock.
Pros. -
1. Nice pattern
2. Not magnificent but good volume
3. Other indicators are bullish
Cons. -
1. Overbought as per RSI
Enjoy.
Note- No Financial Advice. Just a prediction.
P.S. Early birds got ~10% extra.
CRUDE OIL CUP AND HANDLEIf price crosses above 7500, targets can be 7550, 7650 and 7750 depending on the holding period.

UNION BANK | Cup Formation | Imbalance Filling | Swing TradeUNION BANK | Cup Formation | Imbalance Filling | Swing Trade
Chart Analysis
1) cup formation
2) imbalance filling started

TataSteel - LongTata Steel has given a clear Cup and Handle breakout.
The breakout is supported by good volume as indicated in the chart.
In near term looks like it will reach 150.
CMP: 128
Target: 150
SL: 117
These are my views, please do your due delligence.
If you like this, please hit the like and follow me :)

TCS: 1.5 Year Cup Handle BreakoutTCS this week is trying to break out of a cup and handle pattern lasting 1.5 years. Volume and RSI is high this week. Coinciding with breakout in other tech stocks and CNXIT. Important it stays along with tech sector above the breakout level over next few weeks to sustain rally.

UCOBANK: 6 Year Cup Handle BreakoutUCOBANK has rapidly broken out of a huge 6 Year Cup Handle pattern. The massive breakout over the last 2 days has pushed it over 35%! Huge volumes and high RSI. No wait for profit booking and see if it sustains. The whole PSU bank pack is breaking out.

DBREALTY: 10 year Huge Cup DBREALTY is now poised to breakout of the huge 10 year cup with high volume and high RSI. Watch for massive breakout if it happens.

ARVINDARVIND:- Cup and handle pattern has formed on the monthly chart, if we get breakout then we can see movement to the upside
Hello traders,
As always, simple and neat charts so everyone can understand and not make it too complicated.
rest details mentioned in the chart.
will be posting more such ideas like this. Until that, like share and follow :)
check my other ideas to get to know about all the successful trades based on price action.
Thanks,
Ajay.
keep learning and keep earning.
