BUY TODAY SELL TOMORROW for 5%DON’T HAVE TIME TO MANAGE YOUR TRADES?
- Take BTST trades at 3:25 pm every day
- Try to exit by taking 4-7% profit of each trade
- SL can also be maintained as closing below the low of the breakout candle
Now, why do I prefer BTST over swing trades? The primary reason is that I have observed that 90% of the stocks give most of the movement in just 1-2 days and the rest of the time they either consolidate or fall
Cup & Handle Breakout in CPPLUS
BUY TODAY SELL TOMORROW for 5%
Cupandhandlepattern

DALMIA BHARATHello & welcome to this analysis
Technical Outlook:
In the monthly time frame its completing the formation of a Cup & Handle breakout suggesting upside levels for medium term 2800 - 3500, for long term 3800 - 5000
Accumulation can be done in the range of 1900 (on downside) 2300 (on the upside).
The view would be invalid if it goes below 1700
Fundamental Outlook
Cost and operational efficiency focus
Recognized as one of the lowest-cost cement producers in India, thanks to measures such as increased use of blended cement, alternative fuels, optimization of lead distances
As of FY25, DBL reported a net debt to EBITDA ratio of ~0.3×, indicating a relatively comfortable leverage position for now.
Growth ambition/scale expansion
The company has achieved an installed capacity milestone of ~49.5 Mtpa (million tones per annum) of cement in FY25. It has set a long-term target of 110-130 Mtpa by ~FY31.
Regional presence & market opportunity
DBL has a strong footprint in the East & South of India, which are seen as growth regions. For example, the FY25 press release emphasized expansion in the East.
Where could margin gains realistically come from?
Better pricing / improved net realizations (higher NSR/ton).
Cost reductions: fuel/coal optimization, higher renewables share, freight savings and logistics efficiency.
Product mix shift to premium / blended cement with higher realizations.
Scale / utilization improvements (spreading fixed cost)
All the best

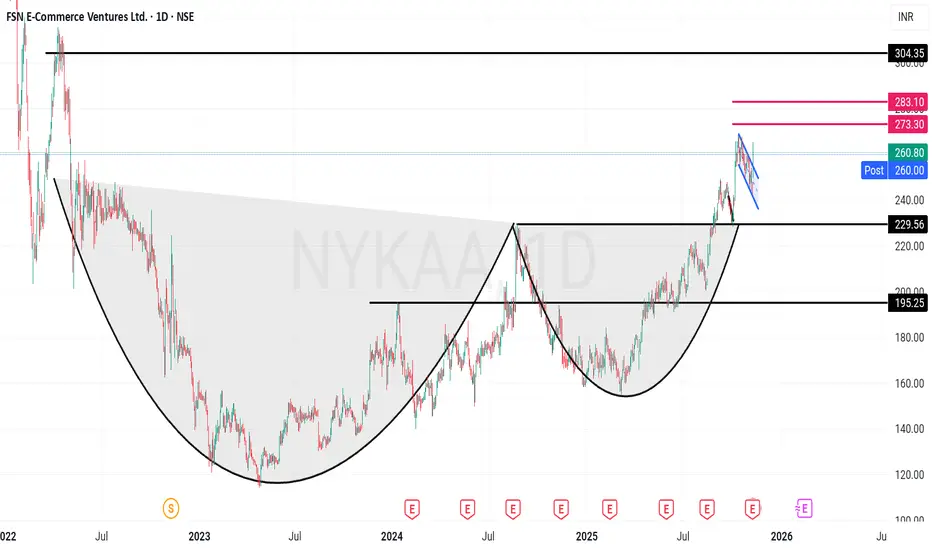
Nykaa - Strong Growth Cup & Handle with Detailed fundamentalsFSN E-Commerce Ventures Limited (Nykaa) – Technical & Fundamental Analysis
Company Overview:
FSN E-Commerce Ventures Limited (Nykaa) is a digitally native consumer technology platform, delivering a content-led, lifestyle retail experience. Since its incorporation in 2012, the company has focused on designing a differentiated brand discovery journey for its consumers. It offers a diverse portfolio of beauty, personal care, and fashion products, including owned-brand products manufactured in-house. Nykaa provides an omnichannel experience to cater to consumer preferences and convenience.
Technical Analysis
Chart Patterns: Cup and handle breakout; Today 1-hour parallel channel breakout
Current Market Price (CMP): ₹260
Targets: ₹301, ₹350
Support Levels: ₹230, ₹195
Recent News & Highlights
✅Q1 FY26 Results: Consolidated net profit surged 142% YoY to ₹23.30 Cr; revenue up 23.4% to ₹2,155 Cr
✅Arbitration Win: Nykaa Fashion received ₹10 Cr compensation from arbitration award
Q1 FY26 Guidance: Management anticipates consolidated net revenue growth at lower end of mid-twenties range YoY
✅Fashion Segment Target: Company expects EBITDA breakeven in fashion by FY26
✅Organic Portfolio Expansion: Aims to increase organic portfolio by 30% annually to reach ₹6,000 Cr GMV
✅Q4 FY25 Performance: EBITDA ₹133 Cr vs ₹93.28 Cr YoY; EBITDA margin improved to 6.47% from 5.59%
✅Corporate Action: NCLT approved merger of Iluminar Media (LBB) into Nykaa Fashion
Analytical Summary
Operational Excellence: Revenue growth of 24.5% YoY with net profit doubling to ₹66.08 Cr demonstrates strong execution and operating leverage. The company is scaling both beauty and fashion verticals while expanding margins.
Capital Structure: Debt increased 41% to ₹961 Cr, but debt-to-equity remains negligible at 0.04, showing conservative leverage. ROE at 5.9% suggests room for improvement in capital efficiency.
Valuation Risk: PE of 675.77 and PB of 40.5 reflect aggressive growth expectations. EV/EBITDA of 117.5 leaves minimal margin of safety, requiring caution for long-term investors.
SWOT Analysis
Strengths (16 Factors):
Rising net and operating cash flows for 2 consecutive years
Strong EPS growth; quarterly profit margins expanding
Improving RoCE, ROE, and ROA
Consistent revenue growth for past 2 quarters
Clean governance; zero promoter pledge
Weaknesses (3 Factors):
Promoter shareholding dilution
Expensive valuation (PE > 40) limits margin of safety
Opportunities (1 Factor):
Increasing FII/FPI shareholding validates institutional interest
Disclaimer
This analysis is for educational and informational purposes only. It does not constitute investment advice. Trading and investing in stocks involve risks, and individuals should conduct their own due diligence or consult with a qualified financial advisor before making any investment decisions. The author is not responsible for any gains or losses arising from the use of this analysis.
SOBHA ( W ) CUP & HENDAL BREAKOUT● Add Your Watchlist ●
📊 Chart to Study For Swing Trading
➡️ STOCK NAME : SOBHA
▫️Date : 10.11.25
🔸️ Pattern : Cup & Hendal
🔸️Timeframe : Weekly
🔸️Near Brekout Price
🔴 Chart is Only For Education Purpose

SAIL ( W ) CUP & HENDAL PATTERN BREAKOUT● Add Your Watchlist ●
📊 Chart to Study For Swing Trading
➡️ STOCK NAME : SAIL
▫️Date : 10.11.25
🔸️ Pattern : Cup & Hendal
🔸️Timeframe : Weekly
🔸️Near Brekout Price
🔴 Chart is Only For Education Purpose

Technical Analysis: M & B Engineering Ltd (NSE: MBEL)🧩 Chart Pattern
The stock has formed a Cup and handle pattern—a bullish continuation structure.
The cup depth is around 23% (from ₹588 to ₹476). T -588
Handle breakout occurred with strong volume, confirming institutional buying.
✅ Pattern Confirmation:
Breakout candle closed above ₹476 zone, validating the pattern.

PROTEAN Cup & Handle with double bottom reversal set upProtean eGov Technologies Ltd (PROTEAN) is trading around ₹865 as of early November 2025, with the stock having a year high of ₹1,535 and a low near ₹716. The stock has declined roughly 35% over the last 6 months and about 42% year-on-year from its peak. Valuation metrics show a price-to-earnings (P/E) ratio near 37 and a price-to-book (P/B) ratio around 3.45, indicating a relatively high valuation considering recent price declines.
The company has zero debt, which strengthens its financial stability, but revenue growth has been weak with a recent contraction and modest sales increase in some quarters. Profitability margins remain moderate, and earnings per share (EPS) stood at around ₹23.3. Dividend yield is low at about 1.16%.
Technically, the stock is trading below its 200-day moving average (~₹1,053) and close to the 50-day average (~₹879), suggesting some near-term weakness. Support may be near the recent lows of ₹716, with resistance close to ₹900–₹950. Overall, Protean presents a cautious medium-term outlook, with fundamental strengths balanced by valuation and growth concerns.

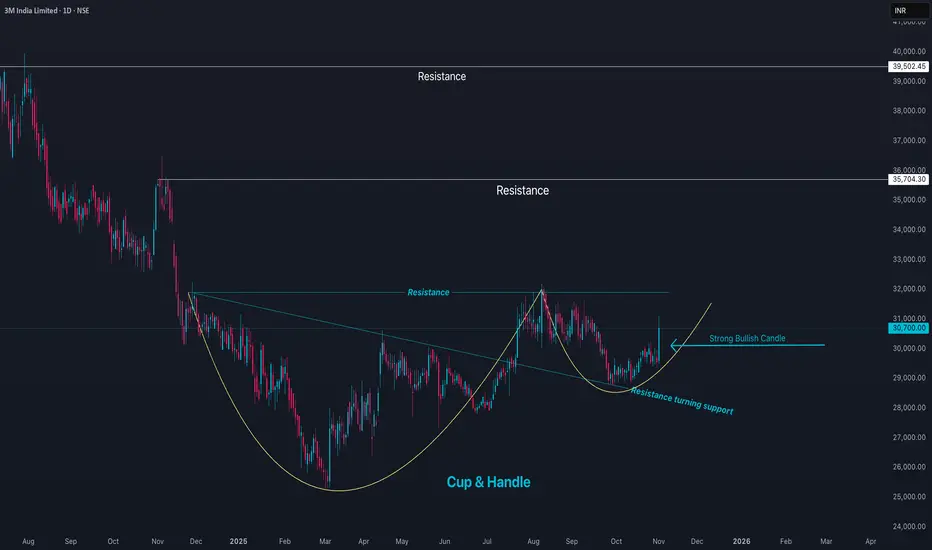
3MINDIA Price Action3M India Limited (3MINDIA) is currently trading around ₹30,865, marking a strong 4.4% rise in the latest session. The stock has a 52-week high near ₹37,133 and a low around ₹25,718, placing it closer to the upper end of its annual range. The market capitalization is approximately ₹33,300 crore.
3M India shows robust financial health with an earnings per share (EPS) of about ₹440 and a high price-to-earnings (P/E) ratio near 69, reflecting premium valuation driven by strong management, innovation, and brand dominance. The stock price recently traded above its 50-day (₹29,941) and 200-day (₹29,348) moving averages, confirming positive momentum.
Profit margins are solid, with an operating margin near 18.9% and net margin around 10.7%. Return on equity (ROE) is high at approximately 24%, and the company’s debt-equity ratio is very low (0.03), indicating a conservative capital structure. Dividend yield is modest at 1.85%. Volume trends indicate steady investor interest.
Technically, the stock is in an uptrend with nearest support at around ₹29,500 and resistance near the 52-week high zone around ₹37,000. Overall, 3M India maintains a strong market position, consistent earnings growth, and solid fundamentals, supporting a positive medium- to long-term outlook barring broader market disruptions.
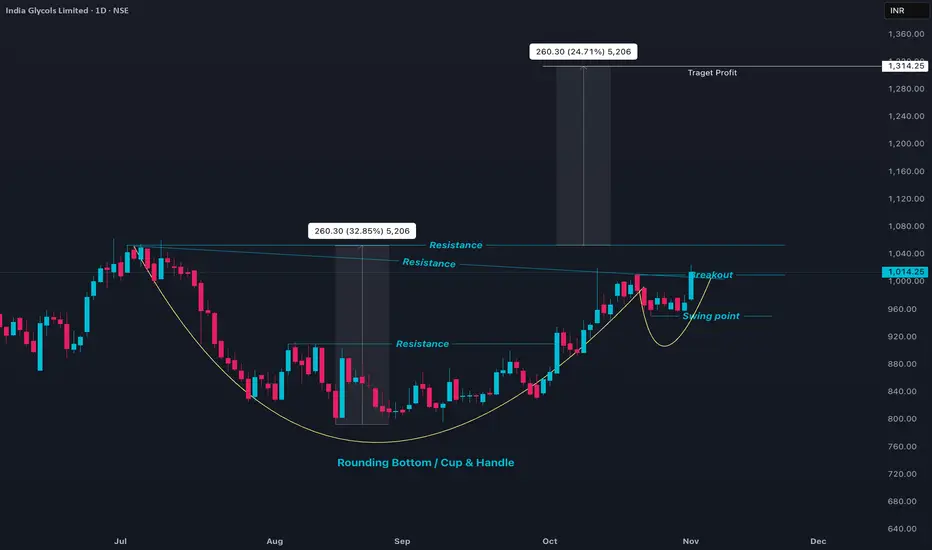
INDIAGLYCO - Cup & Handle PatternIndia Glycols (INDIAGLYCO) is currently trading around ₹1,014, showing significant strength with a recent 4.6% gain in the latest session. The stock has a 52-week high near ₹1,070 and a low near ₹503, indicating it is trading close to its annual high. The market capitalization is around ₹6,277 crore with solid average daily volume (~17,847 shares).
Valuation metrics indicate a P/E ratio of approximately 25.8, supported by strong earnings per share (EPS) of ₹39.35. The stock price is well above its 50-day (₹888) and 200-day (₹796) moving averages, showing strong short and long-term momentum. Volume trends reflect steady buying interest, confirming bullish sentiment.
Fundamentally, India Glycols has demonstrated robust financial performance with growth in revenue and profitability, making the current price attractive for medium to long-term investors. Technical indicators point to a continuation of the uptrend barring any major market corrections, with immediate support near ₹960 and resistance at ₹1,050–₹1,070.
Overall, India Glycols exhibits solid price momentum, healthy fundamentals, and strong trading volume, supporting its position as a structurally sound stock in the chemical and specialty chemicals sector.
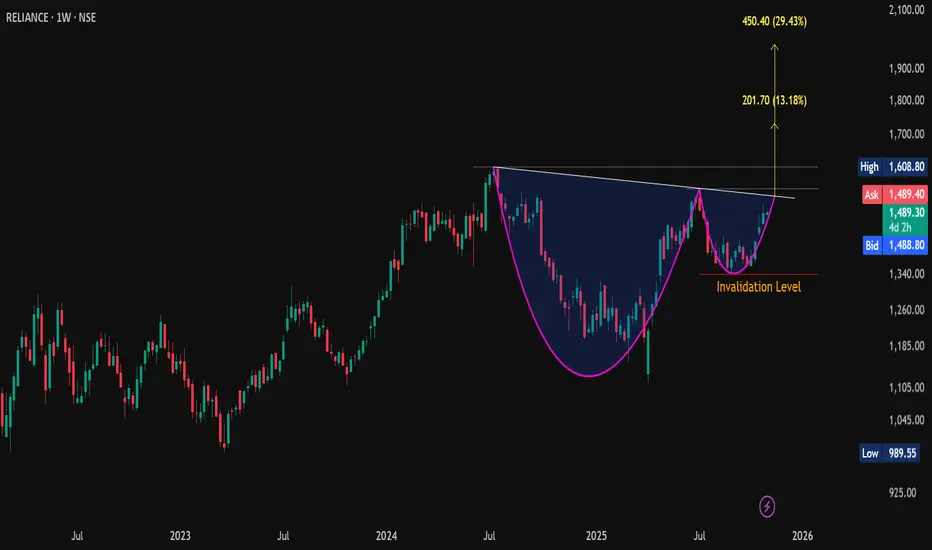
#Reliance | Cup & Handle Breakout Setup📊 CMP: 1489
💥 Breakout Level: WCB above Handle Neckline
🎯 Pattern Targets: 1730 / 1980+ (16 & 33% from CMP)
🛡 Support: 1456 / 1407-1409
🚧 Resistance: 1527-1551 / 1597-1609
❌ Invalidation Level: Below 1340.60 (WCB)
#CupnHandle #ChartPattern #PriceAction #SwingTrade
📌 Disclaimer: This analysis is shared for educational purposes only. It is not a buy/sell recommendation. Please do your own research before making any trading decisions.
Grasim Industries (CMP ₹2,891.7)Pattern: Cup and Handle — retesting neckline post breakout.
Structure: Throwback towards neckline near ₹2,885–₹2,900 zone; strong recovery from base.
Indicators:
RSI above 55, turning upward.
MACD bullish crossover holding.
21 EMA > 50 EMA > 200 EMA — uptrend intact.
Trade Plan:
📈 Buy above: ₹2,902
🛑 Stoploss: ₹2,851
🎯 Targets: ₹2,963 / ₹3,035
View: Excellent structural strength; watch for breakout confirmation with volume.

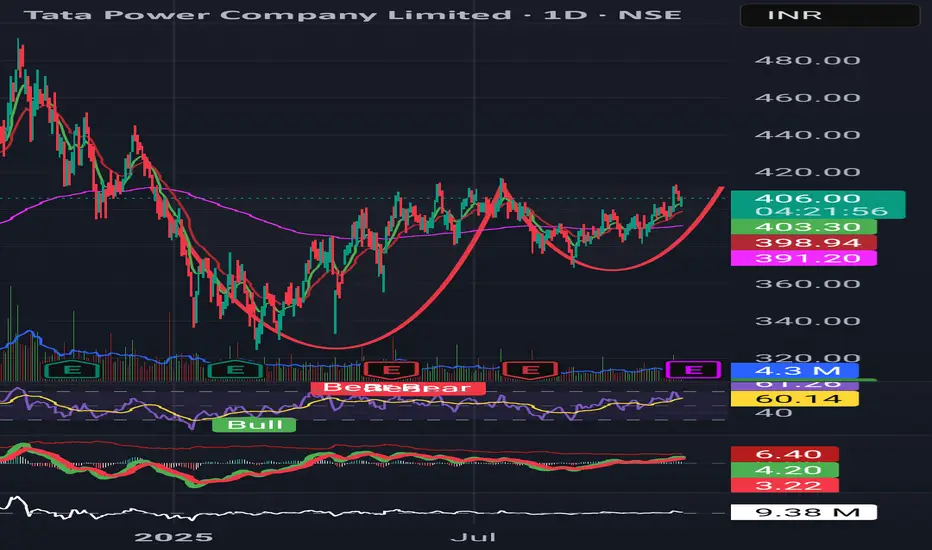
Tata Power (CMP ₹404.9)Pattern: Cup and Handle nearing breakout.
Structure: Handle formation visible near ₹400–₹410 zone; consolidation on low volume.
Indicators:
RSI at 59, gradually rising.
MACD turning positive with histogram expansion.
Trade Plan:
📈 Buy above: ₹416
🛑 Stoploss: ₹410
🎯 Targets: ₹440 / ₹459
View: Breakout potential high; confirmation needed above ₹416 with strong close.
BPCL (CMP ₹356.8)Pattern: Cup and Handle; neckline at ₹352 recently reclaimed.
Structure: Breakout retest visible with price consolidating just above 21 EMA.
Indicators:
RSI at 68, bullish momentum intact.
MACD shows renewed crossover — supports continuation.
Trade Plan:
📈 Buy above: ₹352
🛑 Stoploss: ₹344
🎯 Targets: ₹382 / ₹403
View: Oil & Gas sector remains strong; momentum aligns with sector tailwinds.

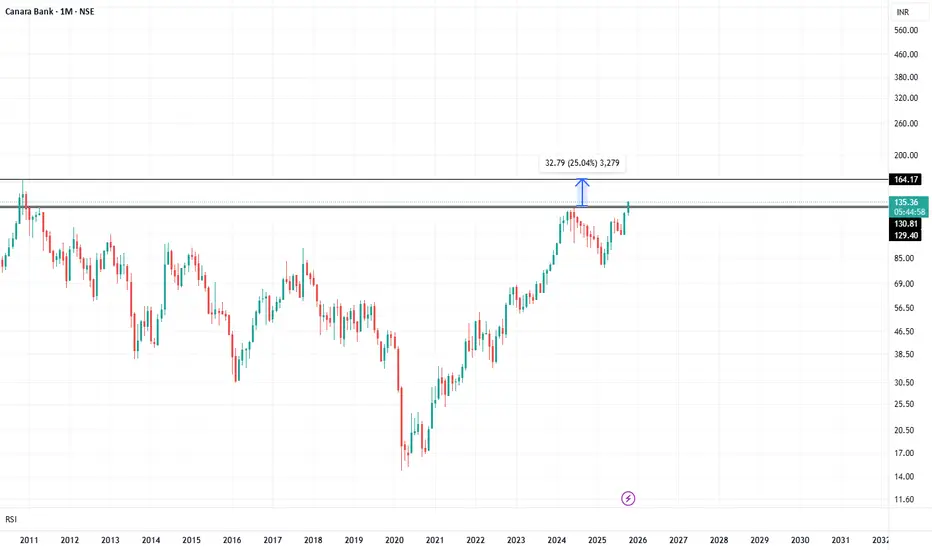
#CANBK looking bullish on monthly timeframe#CANBK has given a breakout at 131 on a monthly timeframe. Upside potential: 25%+ (i.e. 164 which is the stock's all-time high). Stop loss: 127. A few things to note:
The sector is bullish. NIFTY PSU BANK recently gave a breakout at 8070
The stock is undervalued at a PE ratio of under 7. Company has delivered good profit growth of 61.0% CAGR over last 5 years
This is not a buy/sell recommendation. Research carefully and invest at your own risk.
BUY TODAY SELL TOMORROW for 5%DON’T HAVE TIME TO MANAGE YOUR TRADES?
- Take BTST trades at 3:25 pm every day
- Try to exit by taking 4-7% profit of each trade
- SL can also be maintained as closing below the low of the breakout candle
Now, why do I prefer BTST over swing trades? The primary reason is that I have observed that 90% of the stocks give most of the movement in just 1-2 days and the rest of the time they either consolidate or fall
Cup & Handle Breakout in SAIL
BUY TODAY SELL TOMORROW for 5%

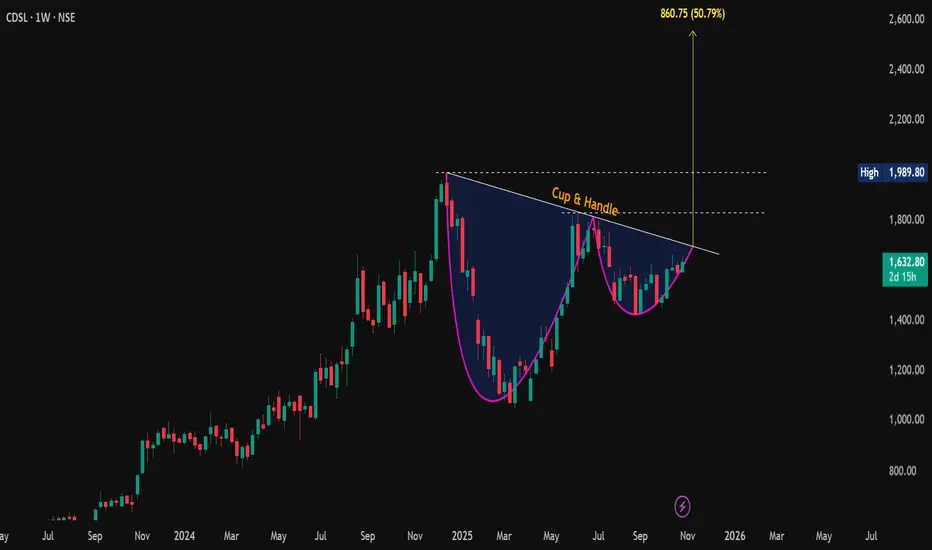
#CDSL – Cup & Handle Brewing!📊 CMP: 1632.8
☕🎯 Target: 2500+ 🚀
🛡 Support: 1597–1582 | 🔥 Resistance: 1776–1829 / 1944–1990 (ATH)
📈 Breakout above neckline = +50% potential move!
❌ Invalidation below 1421 (WCB)
#CDSL | #CupAndHandle | #ChartPattern | #SwingTrade | #PriceAction
📌 Disclaimer: This analysis is shared for educational purposes only. It is not a buy/sell recommendation. Please do your own research before making any trading decisions.
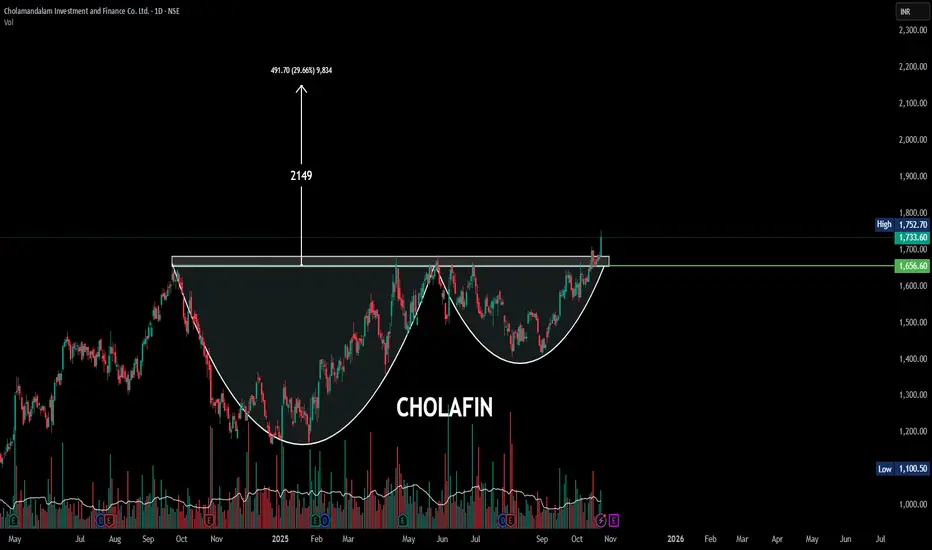
CHOLAFIN| ! Cup and Handle pattern | DailyThe chart displays a confirmed Cup and Handle pattern, which is a highly bullish continuation pattern.
Pattern: Cup and Handle (Daily Chart).Breakout: The price has successfully broken out above the pattern's resistance level (the lip of the cup) at approximately $₹1,656.60. This move is typically followed by a strong upward rally.
Target: The measured move target for this pattern is projected at $₹2,149.
Recommendation: Strongly Bullish on a daily timeframe. Maintain the breakout level ₹1,656.60 as a key support/stop loss.
This technical signal is further reinforced by positive fundamental indicators, with Cholamandalam Investment & Finance reporting strong recent earnings growth and a positive consensus from institutional analysts.
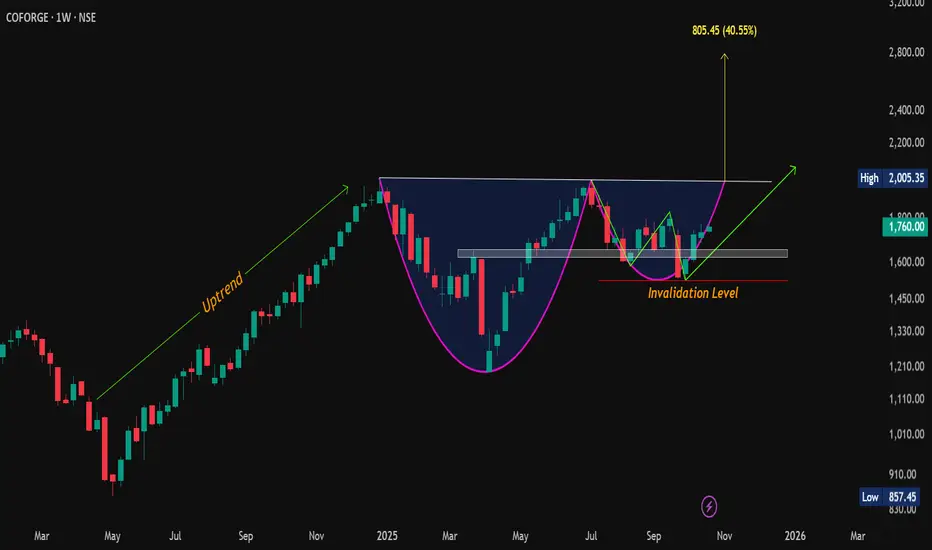
Pattern Inside a Pattern! Cup & Handle Meets the W on #Coforge💰 CMP: 1760
🎯 Cup & Handle Target: 2790 (~58% from cmp)
⚡️ W-Pattern Target: 2060
🧱 Supports: 1658-1622 / 1584
🚧 Resistances: 1795-1830 / 1950-2005
❌ Invalidation: Weekly Close Below 1525
📈 Bullish setup loading… watch for breakout above neckline!
#Coforge | #CupAndHandle | #WPattern | #ChartPatterns | #SwingTrading | #PriceAction | #BreakoutSetup
📌 Disclaimer: This analysis is shared for educational purposes only. It is not a buy/sell recommendation. Please do your own research before making any trading decisions.
Edelweiss Financial Services cmp 120.61 by Daily Chart viewEdelweiss Financial Services cmp 120.61 by Daily Chart view
- Support Zone 107.50 to 113.50 Price Band
- Resistance Zone 123.50 to 129.50 Price Band
- Falling Resistance Trendlines Breakout been attempted
- Price rejection couple of times on approaching Resistance Zone
- Volumes spiking regularly and in close sync with avg traded quantity
- Bullish patterns of Head & Shoulders followed by Cup & Handle and Rounding Bottom

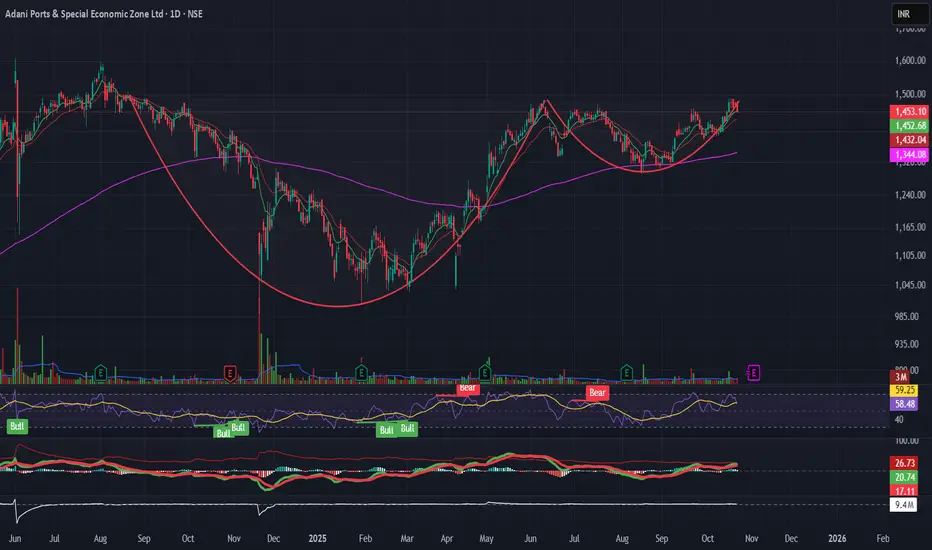
Adani Ports (ADANIPORTS)Pattern: Cup & Handle
Breakout Zone: Above ₹1,490
Structure: Price forming a large rounding base; EMAs aligned positively; RSI > 60 confirming momentum
Volume: Gradually increasing – accumulation visible
Plan:
Buy Trigger: Close above ₹1,490
Stoploss: ATR-based (~₹1,445)
Targets: ₹1,600 → ₹1,680 (based on Fib extensions)
View: Bullish continuation, strong structure supported by momentum and sector strength (Infrastructure + Ports theme)
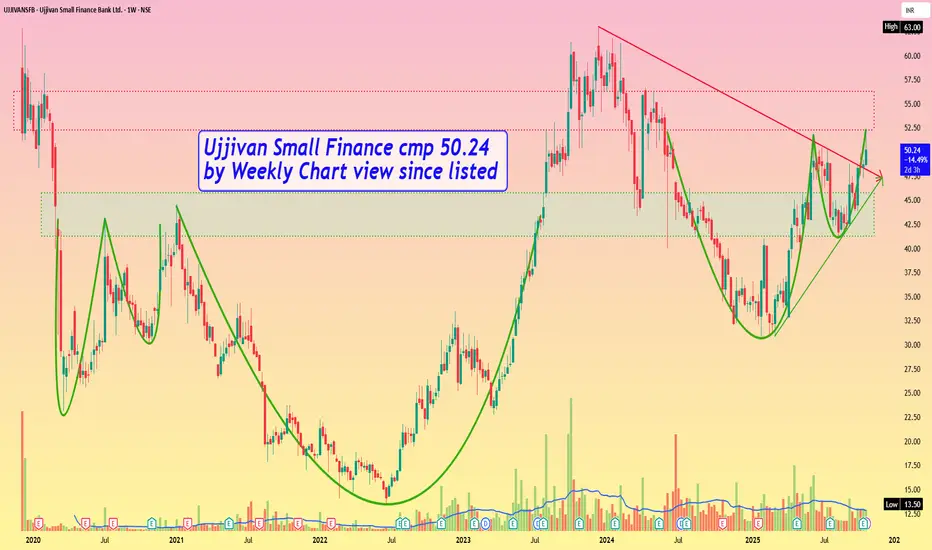
Ujjivan Small Finance cmp 50.24 by Weekly Chart view since listeUjjivan Small Finance cmp 50.24 by Weekly Chart view since listed
- Support Zone 41.25 to 45.75 Price Band
- Resistance Zone 52.25 to 56.25 Price Band
- Bullish Cup & Handle formed by Resistance Zone neckline
- Volumes spiking intermittently by a close sync with avg traded qty
AdityaBirlaCapital - Investment IdeasAditya Birla Capital Ltd - Technical Analysis
Simple Technical Analysis Summary
Aditya Birla Capital is breaking out from a multi-year resistance zone with a classic and perfect rounding bottom pattern playing out on the monthly timeframe.
Fibonacci targets have been activated!
Key Technical Observations
1. Multi-Year Rounding Bottom Pattern
The stock has completed a textbook rounding bottom formation spanning multiple years. This is one of the most reliable bullish reversal patterns in technical analysis, indicating a fundamental shift from bearish to bullish sentiment.
2. Breakout from Multi-Year Resistance
After years of consolidation and base building, the stock has successfully broken out from a significant resistance zone around ₹255. This breakout signals the potential beginning of a new uptrend cycle.
3. Monthly Timeframe Confirmation
The pattern is forming and confirming on the monthly timeframe, which carries significantly more weight than shorter timeframes. Monthly breakouts tend to lead to sustained moves.
4. Fibonacci Extension Framework
Multiple Fibonacci extension levels have been identified and activated, providing a clear roadmap for potential price targets based on the measured move from the rounding bottom pattern.
#Fibonacci Extension Target Levels
Based on the rounding bottom pattern measurement and Fibonacci extensions:
- Target 1: 314.20 (1.272 Fibonacci Extension)
- Target 2: 345.10 (1.414 Fibonacci Extension)
- Target 3: 389.90 (1.618 Fibonacci Extension)
- Extended Target: 472.00 (2.0 Fibonacci Extension)
Key Support Levels
- Immediate Support: 255.00 (Breakout level / Previous resistance turned support)
- Secondary Support: 171.86 (0.618 Fibonacci retracement)
- Critical Support: 146.17 (0.5 Fibonacci retracement)
- Base Support: 42.35 (Rounding bottom base)
- Pattern suggests long-term bullish structure - Risk-reward favorable for position building on dips
Risk Management:
- Maintain stoploss below 255 on monthly closing basis
- For aggressive traders: 240 (allowing some wiggle room)
- For conservative traders: 235 (below breakout zone)
Invalidation Level:
- Monthly close below 240 would weaken the bullish structure
- Break below 220 would invalidate the immediate bullish setup
DISCLOSURE & RISK WARNING:
This analysis is provided for educational and informational purposes only and should not be construed as financial advice, investment recommendation, or an offer to buy or sell securities. Past performance is not indicative of future results.

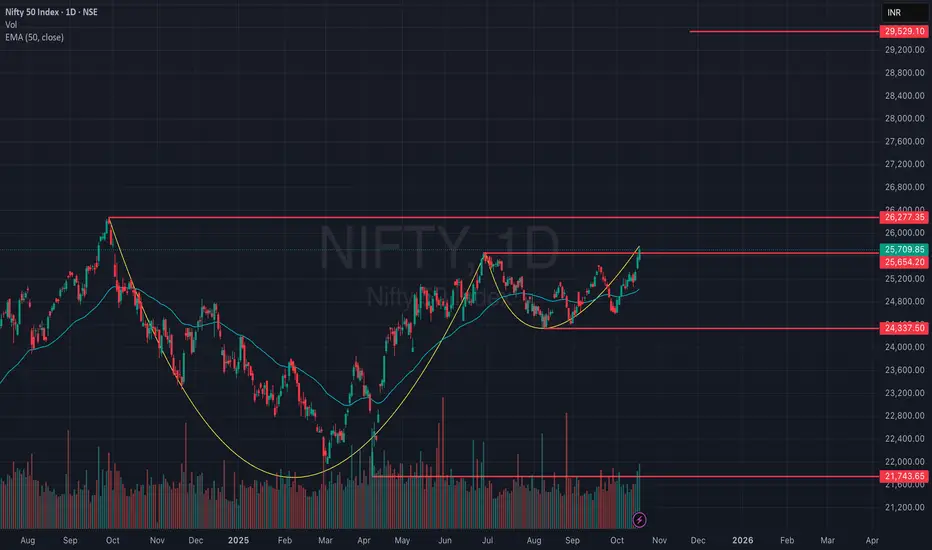
Ready for the Breakout? NIFTY’s Chart Points to 30,500 AheadThe cup base formed between Sept 2024 (26,277 high) and Apr 2025 (21,743 low), representing a well-rounded accumulation phase.
The handle consolidation has been developing just below the 26,200–26,300 resistance zone, accompanied by declining volume, which aligns with textbook breakout behavior.
A decisive close above 26,300 would mark a pattern breakout, confirming bullish momentum.