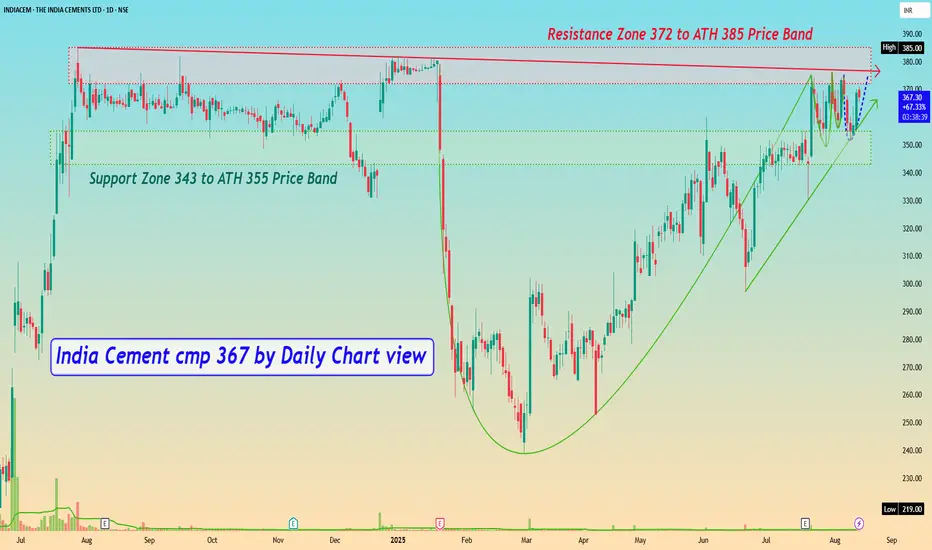
India Cement cmp 367 by Daily Chart viewIndia Cement cmp 367 by Daily Chart view
- Support Zone 343 to ATH 355 Price Band
- Resistance Zone 372 to ATH 385 Price Band
- Falling Resistance Trendline hurdle with Resistance Zone
- Bullish Cup and Handle pattern by the Resistance Zone neckline
- Rising Support Trendline seems well sustained by price momentum
- *Volumes steadily close to avg traded qty, need to increase for fresh breakout*
Cupandhandlepattern
PAYTM – Technical & Fundamental Analysis📊 PAYTM – Technical & Fundamental Educational Snapshot
Ticker: NSE: PAYTM | Sector: 🏦 Digital Payments & Financial Services
CMP: ₹1,122 ▲ (as of 11 Aug 2025)
Rating: ⭐⭐⭐⭐☆ (Moderately Bullish Setup – Educational Purposes Only)
Pattern Observed: 🏆 Cup & Handle (Monthly)
PAYTM has been forming a Cup & Handle pattern on the monthly time frame, indicating the possibility of a bullish continuation. The stock recently closed at ₹1,122 (11 Aug 2025), approaching its immediate resistance zone of ₹1,151 – ₹1,180, with a potential extension toward ₹1,321 if momentum sustains. On the downside, support levels are placed at ₹1,072, ₹1,021, and ₹992. Technical indicators show RSI at 70 (breakout zone), CCI at 103, and Stochastic at 93, signaling strong momentum. While WVAP trend remains bullish and volume surged to 9.41M vs 20-SMA volume of 7.7M, the MACD is still in bearish territory, suggesting caution. Given the 52-week breakout and strong price structure, the setup currently leans bullish for swing trades, provided price holds above key supports.
One97 Communications (Paytm): Shares have gained analyst attention following a 13% rally over the past month. SEBI-registered analyst Mayank Singh Chandel highlighted Paytm’s first-ever operational profit in Q1, marking a major turnaround from losses seen just 18 months prior, bolstered by the complete exit of Chinese investor Antfin in August 2025, which is expected to improve regulatory compliance. Meanwhile, the company continues to narrow its losses—its Q1 consolidated net loss fell to ₹2.9 billion, down from ₹3.6 billion a year earlier, with a 16% year-on-year increase in revenue to ₹29.8 billion. Technically, the stock is navigating a resistance zone between ₹1,000–₹1,150, with a breakout above ₹1,150 possibly signaling further upside.
Investment Outlook & Conclusion: The stock presents a balanced risk-reward scenario. On the bullish side, continued earnings growth, sector tailwinds, and improving technical structure could support upward momentum. However, downside risks include adverse market sentiment, sectoral weakness, or failure to sustain key support levels. In the short term, price action may remain volatile with potential pullbacks, while in the long term, sustained fundamentals and trend confirmation could offer attractive opportunities.
📊 STWP Trade Analysis – The setup reflects bullish continuation characteristics in classical technical analysis. For educational illustration, a possible framework could consider a reference entry near ₹1,130, supported by an illustrative stop loss at ₹1,046 for risk management. Example upside objectives include ₹1,213 (1:1 Risk-Reward) and ₹1,296 (1:2 Risk-Reward), while a potential pullback reference zone is placed between ₹1,090 – ₹1,080 as a possible retest area.
⚠️ Disclaimer (Read Carefully)
This post is for educational and informational purposes only.
The author is not a SEBI-registered investment advisor. No buy or sell recommendations are being made.
All views are based on chart patterns, publicly available data, and personal learning experience.
Trading involves risk. Losses can exceed your investment. Always consult a SEBI-registered advisor before making financial decisions.
By engaging with this content, you agree to these terms.
________________________________________
💬 Was this useful?
Drop your thoughts, questions, or setups in the comments — let’s grow together!
🔁 Share this post with fellow traders and beginners to spread clean, structure-based learning.
✅ Follow simpletradewithpatience for beginner-friendly setups, price action insights, and disciplined trading content.
🚀 Stay Calm. Stay Clean. Trade With Patience.
Trade Smart | Learn Zones | Be Self-Reliant 📊

GEPIL- CUP AND HANDLE BREAKOUTGEPIL gave classical breakout on weekly charts above 350. Classical bullish Cup and Handle breakout is there on daily and weekly charts. Breakout backed with volumes too
Breakout targets are 425/460/480.
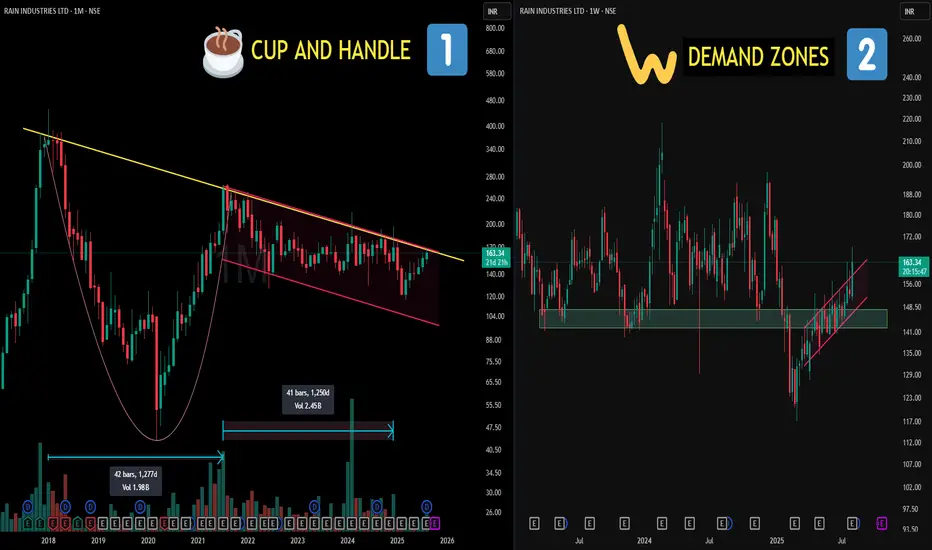
2500 Days of Structure? CUP & HANDLE Decoded!📌Left Side (Chart 1: Monthly TF)
🧠 Cup and Handle Pattern:
A bullish continuation pattern that resembles the shape of a tea cup on longer timeframes. The “cup” shows a gradual rounded bottom (accumulation phase), followed by a smaller downward or sideways "handle" (last shakeout), often before strength resumes. It reflects long-term accumulation and investor confidence.
📈 Cup Duration in this case : 1277 days (approx. 3.5 years)
🧠Parallel Channel (Handle):
A price structure where two trendlines contain price movement within a defined up or down slope. Often marks controlled consolidation or correction — neither side is dominating, until one breaks.
📈 Handle Formation in this case : 1250 days (approx. 3.4 years)
📌 Right Side (Chart 2: Weekly TF)
🧠 This is the zoom lens on the handle zone:
📍A key Demand Zone was breached temporarily… but reclaimed with conviction.
📍 Strong re-acceptance and consolidation followed, showing organized price behavior.
📍 The upper trendline of the parallel channel is where price recently pushed through — again, no forecasting — just a structural breakout from a well-defined zone.
GOLD LONGEntry- 101650-101600
SL- 101200
Target- 102700
Pattern- Gold is making a cup and handle pattern in 1hr TF and is also breaking out of an important resistance zone that 101550. Hence a long trade can be initiated in Gold.
Disclaimer- This is just for educational purpose please take advice before making any decision.
Jai Shree Ram.

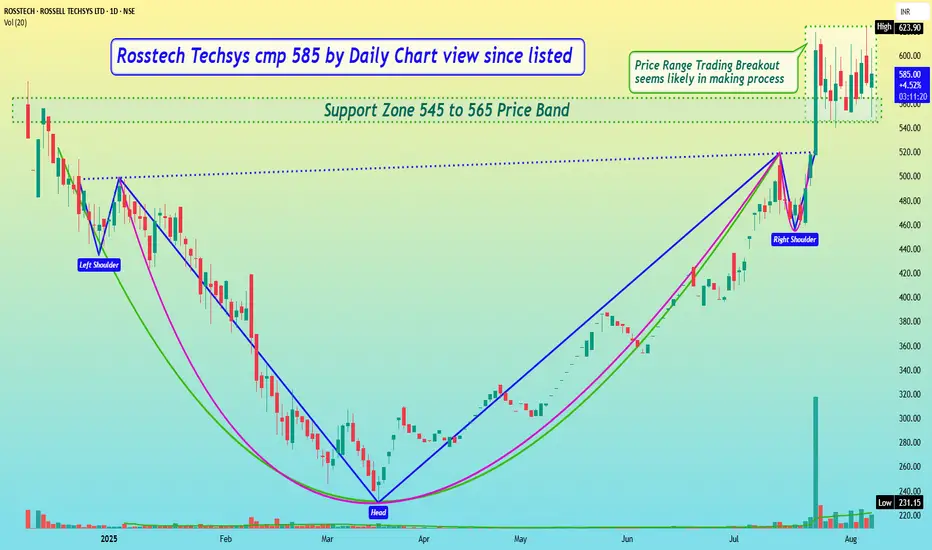
Rosstech Techsys cmp 585 by Daily Chart view since listedRosstech Techsys cmp 585 by Daily Chart view since listed
- Support Zone 545 to 565 Price Band
- Resistance Zone 600 to ATH 613.90 Price Band
- Price Range Trading Breakout seems likely in making process
- Multiple Technical patterns formed Rounding Bottom, Cup & Handle, Head & Shoulders
- Volumes are seen trending well above the average traded quantity over the past few days
Asian Paints | Cup & Handle Breakout Building Momentum
Description:
Asian Paints is forming a classic cup and handle on the daily chart, supported by a rounded bottom structure on the weekly. Price is attempting to breakout above ₹2500, with positive EFI and upward momentum.
📌 Breakout Level: ₹2500
📉 Stoploss: ₹2449 (ATR-based)
🎯 Targets: ₹2749 → ₹2886 → ₹3108 (Fibonacci extension)
🧭 Macro Context:
- Stable inflation and INR
- Improving margin outlook for the sector
- Paint stocks showing strength post consolidation
Strong price-action setup supported by fundamentals and structure.

GOLDHello & welcome to this analysis
Comex GOLD appears to have completed its triangle and is now likely to give a breakout above 3439 for an upside target of 3750.
The triangle goes invalid if we witness a sell off from current levels and it breaks 3250 on the downside.
MCX Gold appears to have a Cup & Handle formation (similar to a triangle) and is now likely to confirm a breakout above 101075 for upside targets of 103750 - 106200 (will depend a lot on $:INR).
The Cup and Handle pattern goes invalid if we witness a sell off from current levels and breaks 99250 on the downside.
Overall use dips to add/trail, shorting (intra day would be a different scenario) overnight from here looks like a very risky trade.
All the best

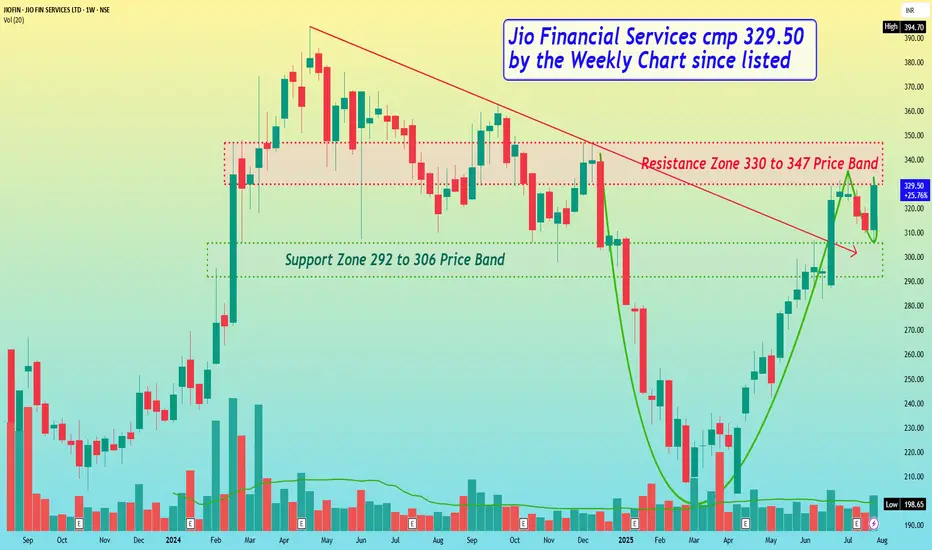
Jio Financial Services cmp 329.50 by the Weekly Chart since listJio Financial Services cmp 329.50 by the Weekly Chart since listed
* Support Zone 292 to 306 Price Band
* Resistance Zone 330 to 347 Price Band
* Price Breakout from Falling Resistance Trendline
* Volumes getting in sync with average traded quantity
* Bullish Cup and Handle done with Resistance Zone neckline
Skipper cmp 516.25 by Daily Chart viewSkipper cmp 516.25 by Daily Chart view
- Support Zone 480 to 507 Price band
- Resistance Zone 545 to 570 Price Band
- Bullish Cup and Handle done with Resistance Zone neckline
- Price Breakout above Falling Resistance Trendline needs to sustain
- Tremendously Huge Volumes traded on Friday by demand based buying

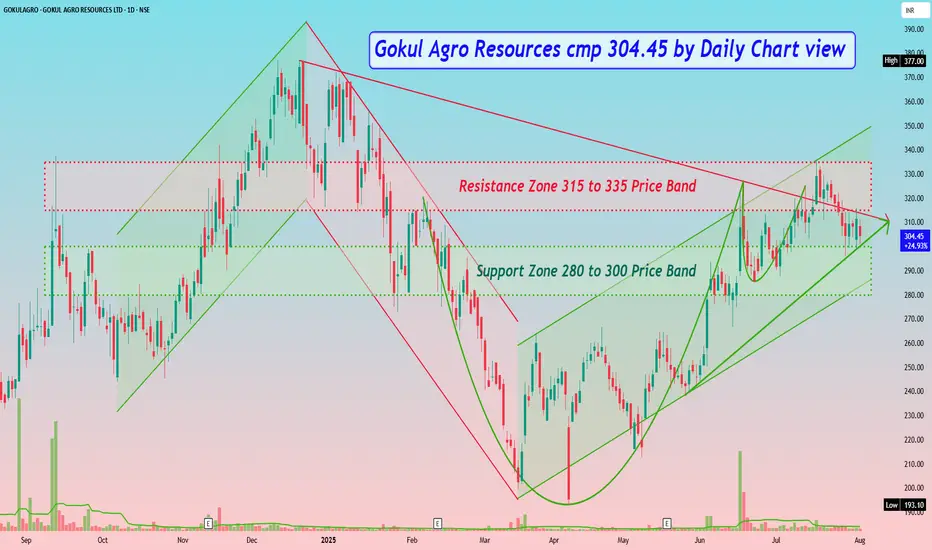
Gokul Agro Resources cmp 304.45 by Daily Chart viewGokul Agro Resources cmp 304.45 by Daily Chart view
- Support Zone 280 to 300 Price Band
- Resistance Zone 315 to 335 Price Band
- Falling Resistance Trendline hurdle need be crossed for breakout
- Rising Support Trendline seems well respected by current momentum
- Price traversing inside the Rising Support Channel is indicating bullishness
- Chart has formed Bullish Cup & Handle pattern by the Resistance Zone neckline
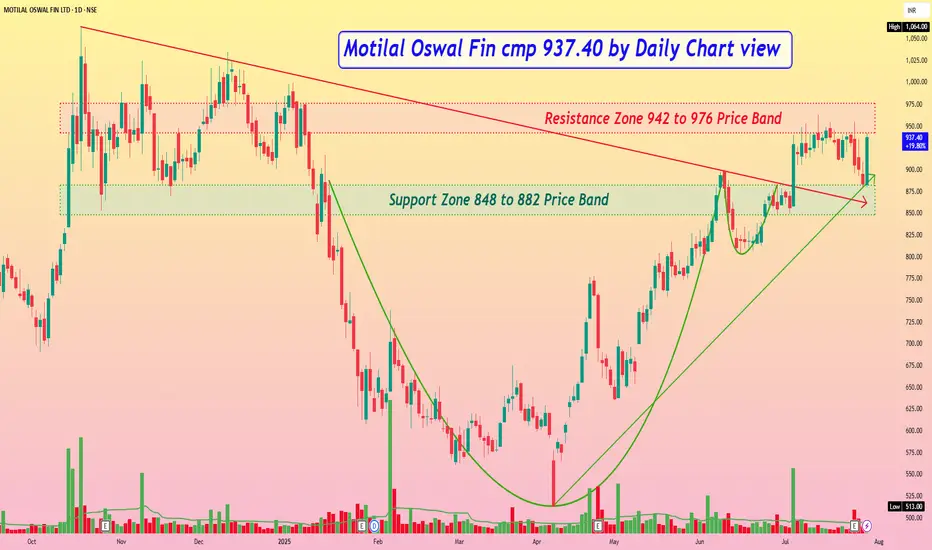
Motilal Oswal Fin cmp 937.40 by Daily Chart viewMotilal Oswal Fin cmp 937.40 by Daily Chart view
- Support Zone 848 to 882 Price Band
- Resistance Zone 942 to 976 Price Band
- Bullish Cup and Handle completed at Support Zone neckline
- Support Zone seen to be tested retested over the past 2 days
- Falling Resistance Trendline Breakout done a while back and sustained
- Selling pressure is seen around the Resistance Zone hurdle acting strongly
- Resistance Zone Breakout necessary for fresh upside as Price retraced multiple times
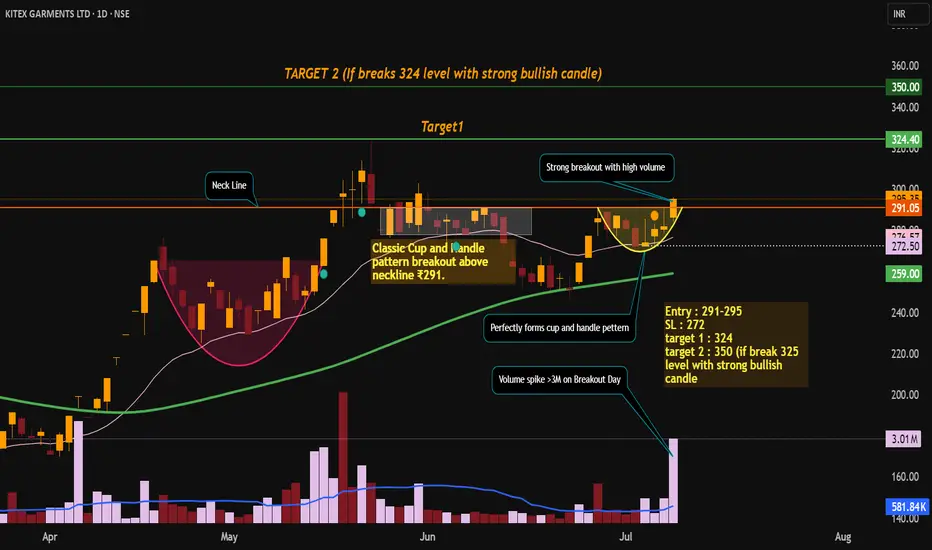
KITEX GARMENTS LTD – SWING TRADE PLANKITEX GARMENTS has delivered a volume-backed breakout from a bullish cup & handle pattern. The technicals are aligned with improving fundamentals, making this a high-probability swing trade setup.
✅ Cup & Handle Breakout 💥
📈 Entry: ₹291–₹295 | 🎯 Target: ₹324 / ₹350 | 🔐 SL: ₹272
🧠 Strong volume + solid fundamentals
Technical Analysis
Classic Cup and Handle pattern breakout above neckline ₹291.
Strong bullish close at ₹295.35 with high volume (3.01M vs avg 580K).
Price above 20(276) & 50 (259) EMA which confirms confirms bullish trend. Both the EMAs slopping upward which shows positive trend structure.
price can take support near ₹274–₹276 (handle + 20 EMA).
Resistance ₹324 (Target) (swing high), ₹350 (measured move target).
Volume spike confirms real breakout, not a fake breakout.
Demand zone breakout with institutional interest.
FUNDAMENTAL KEYS WHICH SUPPORT STOCK FOR BULLISH TREND.
KITEX is financially sound with low debt, stable returns, and improving growth. Fundamentals support bullish technical setup. High promoter confidence (>60%). Consistently company's sales growth is improving Q-o-Q.
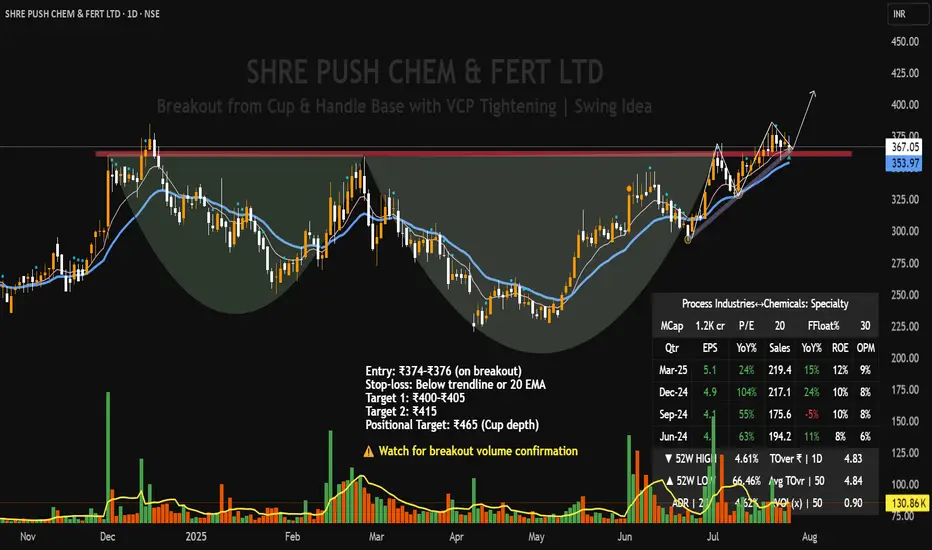
SHREE PUSHKAR CHEMICALS – Cup & Handle + VCP Breakout Setup |Technical Structure:
SHREE PUSHKAR CHEMICALS is forming a high-quality breakout setup on the daily chart, combining both a Cup & Handle pattern and a Volatility Contraction Pattern (VCP) within the handle zone.
Cup & Handle base formation extending from Nov 2023 to Jul 2025
Mini VCP within handle, showing tight range contraction, signaling institutional accumulation.
Ascending trendline support holding firm, along with the 9 EMA.
Volume contraction during each pullback
A confirmed breakout above ₹378 with volume can trigger a strong upside continuation.
Volume has steadily contracted across the handle, especially during pullbacks
Current price is tightening just under the breakout zone — ideal for a low-risk entry
A decisive breakout on volume >150K will act as a confirmation trigger.
Fundamentals
Market Cap : ₹1,200 Cr (Small-cap room for growth)
P/E Ratio: ~20x Reasonable for specialty chemicals
EPS Growth: 24% YoY Consistent profit improvement
Revenue Growth: 15% YoY Stable.
ROE: ~12% Healthy return metrics
Operating Margin: ~9% Sustainable profitability
This setup reflects strong technical discipline with a clean, low-risk structure. Ideal for swing traders looking for breakouts backed by volume and volatility contraction. Watch closely for confirmation with volume.
DCM Shriram - Continuation PatternA Continuation pattern is being formed. It may take some time to breakout, but it looks certain that when the breakout happens it could fly.
Strong ability to service debt as the company has a low Debt to EBITDA ratio of 0.09 times
The company has declared positive results in Dec'2024 after 3 consecutive negative quarters
PBT LESS OI(Q) At Rs 344.43 cr has Grown at 102.5 %
PAT(Q) At Rs 262.14 cr has Grown at 101.1 %
CASH AND CASH EQUIVALENTS(HY) Highest at Rs 1,756.50 cr
With ROE of 7.9, it has a Fair valuation with a 2.7 Price to Book Value
The stock is trading at a premium compared to its average historical valuations
While the stock has generated a return of 12.40%, its profits have risen by 5.3%
PEG ratio of the company is 6.26

Cartrade-A risky positional trade for ATH targets!Cartrade has given outstanding Q4 2024 results and bullishness in the stock is indicator of same.
However, these stocks come with good amount of risk with bigger rewards.
Stock has formed beautiful cup & handle pattern and is about to break it.
Once 1000 is crossed, we can see ATH levels soon. I had seen similar breakout in PBFintech (Policybazaar).
If you believe in new age startups, this stock is technically looking bullish.

Deepak Fertilizers - Cup and Handle ContinuationAs you all can see there is a beautiful cup followed by a handle on the Weekly timeframe.
After the pattern broke out, the stock managed the market sell off pretty well by retesting its previous supply zone (now demand zone) and maintained the sideways trend without spoiling the pattern.
This sudden surge implies that the stock is ready to continue its uptrend.
Talking about fundamentals:
- High Management Efficiency with a high ROCE of 17.10%
- The company has a high Debt to EBITDA ratio of 1.88 times
- Healthy long term growth as Operating profit has grown by an annual rate 40.09%
- Positive results in Dec 24
- OPERATING PROFIT TO INTEREST(Q) Highest at 4.94 times
- NET SALES(HY) At Rs 5,325.74 cr has Grown at 24.53 %
- DEBT-EQUITY RATIO(HY) Lowest at 0.67 times
- With ROCE of 14.4, it has a Fair valuation with a 1.9 Enterprise value to Capital Employed
- The stock is trading at a discount compared to its average historical valuations
- Over the past year, while the stock has generated a return of 106.57%, its profits have risen by 0.5%
- High Institutional Holdings at 20.38%. Their stake has increased by 0.7% over the previous quarter.

TATA CHEMICALS LTD – Cup & Handle BreakoutTata Chemicals has formed a classic “Cup and Handle” formation on the daily chart – a bullish continuation pattern indicating accumulation followed by breakout potential. This is a well-respected setup among technical traders and often leads to sharp upside momentum once the neckline resistance is broken.
Key Observations:
* Cup & Handle Formation
The stock has completed a large rounded bottom (the cup) from February to June, followed by a healthy pullback (the handle) in July. This indicates strong base building and investor interest.
* Breakout Level: ₹976–978
The price is now testing the neckline resistance zone around ₹976. A breakout and close above this level would confirm the pattern and open room for further upside.
* Bullish Momentum Building
The recent rally toward resistance has been with rising candles, and a breakout could invite fresh buying interest. Momentum indicators are supportive, and MACD (not shown in chart) is likely to cross bullish on confirmation.
* Volume Confirmation Important
Traders should look for above-average volume on the breakout day to validate the strength of the move.
Final View:
Tata Chemicals is at a crucial technical level. A confirmed breakout above ₹978 could trigger a bullish continuation supported by the strong base. Traders looking for swing opportunities should keep this stock on their radar.

MHRIL : Swing Trade#MHRIL #patterntrading #chartpattern #cupandhandlepattern #swingtrading #trendingstock
MHRIL : Swing Trade
>> cup & Handle chart pattern
>> Breakout soon
>> Trending Setup
>> Stock in Momentum
>> Good Strength & Volumes
Swing Traders can lock profit at 10% & keep trailing
Pls boost, comment & Follow for more Learnings
Disc : Charts shared are for Learning purpose and not a Trade recommendation. Consult your financial advisor or a SEBI Registered Advisor before taking position in it.
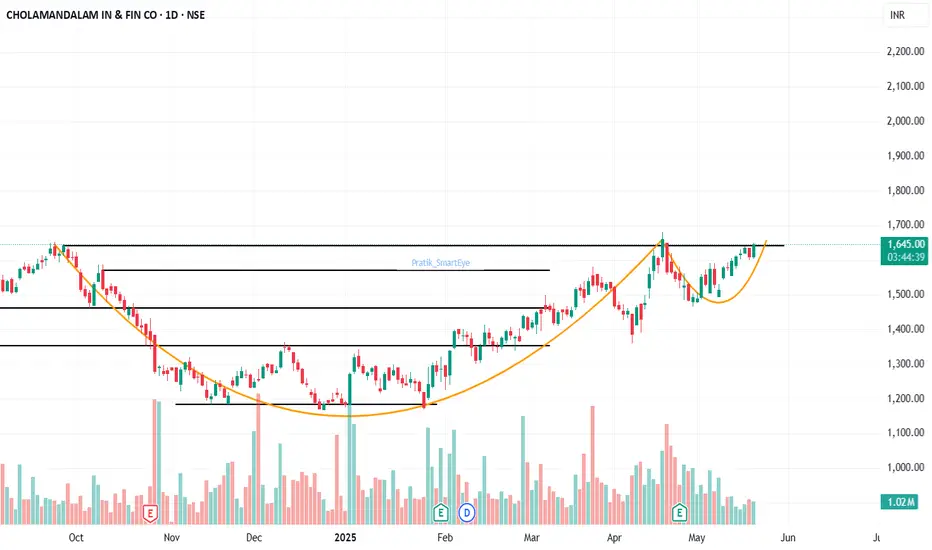
Chola Finance: as expected cup & handle pattern formed.Chola Finance: as expected cup & handle pattern formed sustaining above 1642.
At breakout levels. CMP 1643.
Pattern target of 2100.
View negated below 1500.
#PNBHOUSING - Keep in WL / C&H Set up in DTF📊 Script:
Key highlights: 💡⚡
📈 Cup & Handel Set up formation in Daily Time Frame.
📈 Price consolidating near Resistance, keep in WL
📈 Wait for Volume spike during Breakout, then Enter
📈 Can go for a swing trade
BUY ONLY ABOVE 1140 DCB
⏱️ C.M.P 📑💰- 1088
🟢 Target 🎯🏆 – NA%
⚠️ Stoploss ☠️🚫 – NA%
⚠️ Important: Market conditions are Okish, Position size 50% per Trade. Protect Capital Always
⚠️ Important: Always Exit the trade before any Event.
⚠️ Important: Always maintain your Risk:Reward Ratio as 1:2, with this RR, you only need a 33% win rate to Breakeven.
✅Like and follow to never miss a new idea!✅
Disclaimer: I am not SEBI Registered Advisor. My posts are purely for training and educational purposes.
Eat🍜 Sleep😴 TradingView📈 Repeat 🔁
Happy learning with MMT. Cheers!🥂
NAZARA TECHNOLOGIES LTD | Monthly Chart Breakout📊 NAZARA TECHNOLOGIES LTD (NSE: NAZARA) | Monthly Chart Breakout
📅 Date: June 1, 2025
📈 CMP: ₹1,295.10 (+28.04%)
📌 Ticker: NSE:NAZARA
📉 Chart Pattern Insight
🔥 Cup & Handle + Falling Wedge Breakout
Nazara Tech has broken out of a strong Cup & Handle pattern, reinforced by a Falling Wedge breakout — a powerful confluence suggesting a major trend reversal.
🎯 Breakout is confirmed with high volume and a clean monthly candle close above key resistances.
📐 Fibonacci Retracement Levels (From High ₹1678 to Low ₹477)
🔸 38.2% – ₹935.85 (was resistance, now flipped to support)
🔸 50% – ₹1,077.55
🔸 61.8% – ₹1,219.25 (just surpassed – strong bullish confirmation)
🧭 100% – ₹1,678 (All-Time High)
📊 Indicator: RSI + Moving Average Cross (Icon shown)
🔍 RSI is at 71.63 and rising sharply, indicating strong momentum
🔺 RSI crossover above MA confirms bullish strength and trend continuation
🧱 Volume Spike
📈 Volume this month is multi-month high, validating the breakout
🔑 Key Levels
Support: ₹935 (prior resistance, now retest zone)
Immediate Resistance: ₹1,300 (psychological), ₹1,400
Target Zones:
Short-Term: ₹1,450
Medium-Term: ₹1,600+
Long-Term: Retest of All-Time High ₹1,678+
🛡️ SL: ₹935 (monthly close basis)
📌 Trading Plan
Entry: Pullback near ₹1,220–₹1,250 or breakout retest
SL: ₹935 (below 38.2%)
Target: ₹1,450 / ₹1,600+
Time Frame: Positional – Multi-week to multi-month
⚠️ Disclaimer
This analysis is for educational purposes only. Please do your own research or consult a SEBI-registered advisor before investing.

Krishna Institute of Medical Sciences - Cup and Handle pattern"Hey there! 😊 In this chart, I’ve broken down Moving Averages, MACD, RSI, and ADX indicators, all tied in with Price Action. 📊✨ I’ve also included tips on how to interpret them effectively. It's super easy to follow and packed with insights! 💡 Let me know what you think—can’t wait to hear your thoughts! 🚀👍"
