KPEL| Cup and Handle | Breakout |DailyHere’s a **refined and concise high-level analysis** of **K.P. Energy Ltd (NSE: KPENERGY)**:
---
## 🔍 **K.P. ENERGY LTD – Technical Overview**
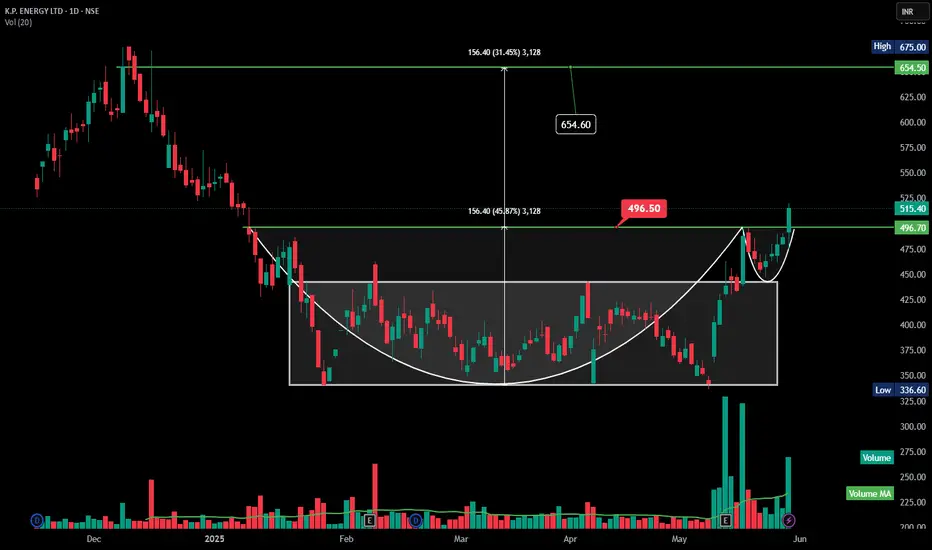
* ✅ **Pattern**: *Cup & Handle*
* 💥 **Breakout above** ₹496.50 with strong volume
* 📈 **Current Price**: ₹515.40
* 🎯 **Target**: ₹654.60 (based on pattern depth)
* 🔽 **Support**: ₹496.50 (breakout zone)
* 📊 **Volume Surge** confirms bullish strength
---
### 📌 **Trade Setup**
* **Entry** on retest near ₹500–₹505
* **Target**: ₹640–₹655
* **Stop Loss**: ₹495 (close basis)
---
📢 **Bias**: Strongly Bullish — textbook breakout with volume confirmation.
Cupandhandlepattern
LLOYDSENT | Cup and Handle | BreakOut | Daily | Good VolumeHere's the **technical analysis** of **Lloyds Enterprises Ltd (NSE: LLOYDSENT)** on the **daily chart**,
---
## 📊 **Lloyds Enterprises Ltd – Daily Chart Analysis**
---
### 🧩 **Chart Patterns Observed**
#### 2. **Cup and Handle Formation**
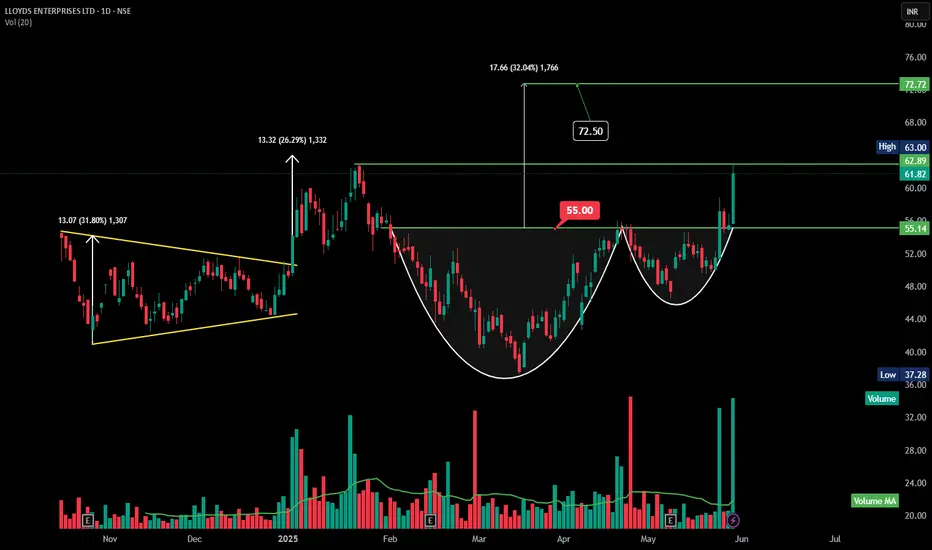
* A well-formed **cup and handle** pattern observed between March–May 2025.
* **Neckline breakout**: ₹55.00
* The price surged sharply after breakout, confirming pattern validity.
---
### 📏 **Price Action & Measured Targets**
| Move Type | Range | Target |
| --------------------- | ---------------------- | --------------------------------- |
| Cup & Handle Breakout | ₹55.00 → ₹72.50 | **₹72.50** (Measured Move Target) |
| Current Price | ₹61.82 | |
| Immediate Resistance | ₹63.00 | |
| Support | ₹55.14 (Breakout zone) | |
* Breakout move from ₹55 to ₹63 already achieved \~14.5% rally.
* **Next target**: ₹72.50 (as per the height of the cup added to breakout zone).
---
### 🔥 **Volume Analysis**
* Massive **volume spike** on breakout candle above ₹55.00 — signifies **strong buying interest**, likely institutional participation.
* Previous volume bars were average or decreasing → confirms **handle was low-volume** (ideal setup).
---
### 🧭 **Key Technical Levels**
| Level Type | Price (₹) |
| ------------------------ | --------------- |
| Resistance 1 (immediate) | ₹63.00 |
| Target Zone | ₹72.50 – ₹72.72 |
| Breakout Zone (Support) | ₹55.00–₹55.14 |
| Strong Support | ₹48.00 |
---
### ✅ **Technical Conclusion**
📌 **Bias**: **Strongly Bullish**
* Price broke above both **cup neckline** and **horizontal resistance** with confirmation.
* RSI likely to be nearing overbought; hence, a short pause/consolidation can occur around ₹63 before next leg up.
---
### 🎯 **Trading Strategy**
| Strategy | Plan |
| ----------------------- | ------------------------------------------------------- |
| **Swing Buy on Retest** | Enter on dip near ₹58–₹60 zone |
| **Target** | ₹72.50–₹72.72 |
| **Stop Loss** | Below ₹54.80 (close basis) |
| **Momentum Play** | Add above ₹63 on closing basis with volume confirmation |
🧠 Risk-Reward looks favorable (\~1:2+) for swing traders.
MOTILALOFS |Cup and Handle pattern | Daily Here is a detailed **technical analysis** of the **Motilal Oswal Financial Services Ltd (MOFSL)** daily chart
---
## 🔍 **Motilal Oswal – Daily Chart Technical Analysis**
### 🧩 **Chart Patterns Observed**
#### 1. **Falling Wedge Pattern (Bullish Reversal)**
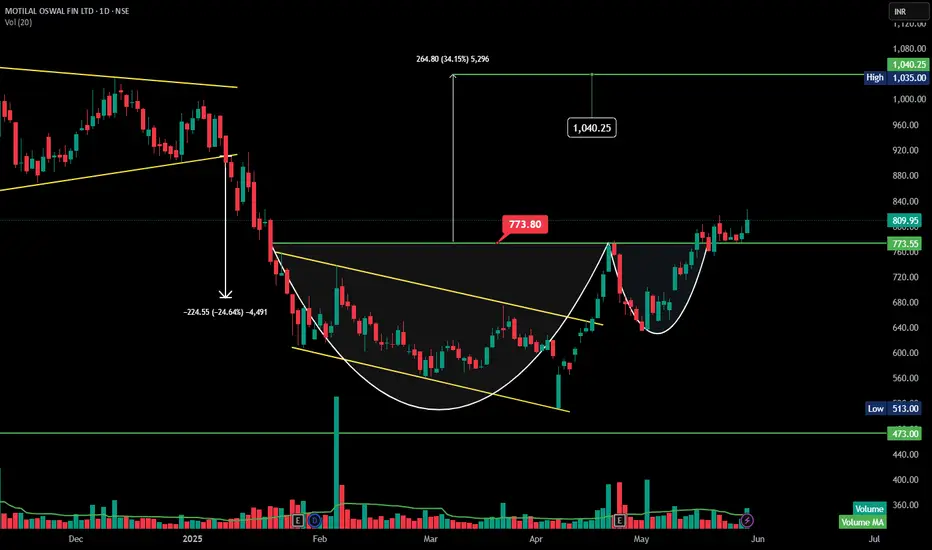
* After a significant downtrend of \~25% (from ₹909 to ₹685), the stock formed a **falling wedge**, a classic bullish reversal pattern.
* The breakout from this wedge marked the end of the downtrend and the start of base-building.
#### 2. **Cup and Handle Breakout**
* The stock formed a **smooth, rounded bottom** (the cup) between February and April.
* A shallow **handle formation** followed, confirming healthy consolidation before the breakout.
* **Breakout above ₹773.80**, which was the neckline of the cup pattern, has triggered bullish momentum.
---
### 📏 **Price Action & Measured Move**
| Component | Value |
| -------------------- | ------------------------------------------ |
| Cup Low | ₹513 |
| Neckline (Breakout) | ₹773.80 |
| Depth of Cup | ₹773.80 - ₹513 = ₹260 |
| Measured Move Target | ₹773.80 + ₹260 = **₹1040** *(minimum)* |
But the chart suggests a **larger swing target**:
* **Upside projection:** ₹773.80 + ₹264.80 = **₹1,040.25**
* This is based on broader trendline breakout from wedge to neckline move.
---
### 📊 **Volume Analysis**
Volume is missing during breakout
---
### 🔑 **Key Technical Levels**
| Level Type | Price (₹) |
| --------------------------- | --------- |
| Breakout Zone | 773.80 |
| Immediate Support | 773.55 |
| Strong Support (Trend Base) | 640 |
---
### 📌 **Technical Conclusion**
✅ **Bias:** Strongly **Bullish**
* The breakout above ₹773.80 confirms bullish momentum.
* With current price at ₹809.95, it has already moved \~36 points from the breakout — early entry window may be closing.
⚠️ **Next Steps:**
* Traders may **trail SL** to breakout zone (₹773–774).
* Watch for follow-through above ₹820 for confirmation toward **₹1,040 target**.
* Any retest of ₹780–790 zone may offer a **high-probability entry**.
---
### 🎯 **Trade Strategy**
| Strategy Type | Action |
| ------------- | ------------------------------------------ |
| Swing Trade | Buy on dips near ₹790–₹800; Target: ₹1,040 |
| Stop-loss | ₹772 (below breakout + handle support) |
| Risk-Reward | \~1:3 if targeting ₹1,040 |
---
CDSL Bullish Cup and Handle Breakout ConfirmLate Published "Only for Educational Purpose"
📊 Pattern Formation: Bullish Cup and Handle
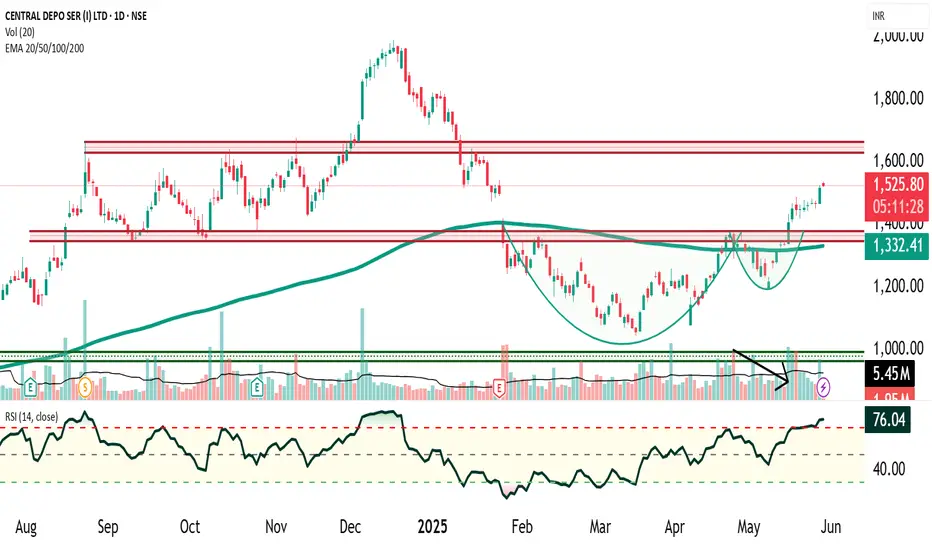
CDSL has officially broken out of a Bullish Cup and Handle chart pattern, signaling a strong technical breakout with high probability of an extended uptrend. This classic bullish continuation pattern took 4 months to form, indicating a well-developed structure with strong base formation.
Neckline Resistance: ₹1380
Breakout Confirmation: Occurred with rising volume, confirming buyer participation
Handle Formation: Characterized by a pullback on declining volume, a textbook sign of weak selling pressure and consolidation before a breakout
📈 Volume & Momentum Indicators
✅ Volume Surge : Confirmed breakout with significant increase in volume — a clear sign of institutional buying
✅ RSI (Relative Strength Index): Currently above 60, indicating strong bullish momentum and room for further upside
✅ Price > 200 EMA: Signals that CDSL is in a confirmed long-term uptrend; the price holding above the 200-day exponential moving average is a strong bullish sign
🎯 Price Target Calculation – Cup and Handle Measurement Rule
Measurement Rule Target:
📌 Target Price = Neckline + Depth of Cup
Neckline: ₹1380
Bottom of Cup (approx.): ₹1180
Cup Depth = ₹1380 - ₹1180 = ₹200
➡️ Projected Target = ₹1380 + ₹200 = ₹1580
🛡️ Stop-Loss (Risk Management)
Choose between Conservative and Aggressive exit strategies:
Conservative SL: Below the lowest low of the handle (approx. ₹1290)
Aggressive SL: Below the breakout candle low (approx. ₹1345)
🔥 Trending Takeaways
CDSL is exhibiting a bullish breakout setup with volume confirmation, strong RSI, and price above 200 EMA. This combination often precedes explosive price action and potential multi-week rally.
🚀 #CDSLBreakout #CupAndHandle #BullishBreakout #TechnicalAnalysis #StockMarketIndia #SwingTrading #MomentumStocks #NSEStocks #ChartPatterns #VolumeAnalysis #StockMarketNews #RSI60 #200EMA #BreakoutStocks #PriceActionTrading
FORTIS | Cup and Handle Breakout | DailyHere’s the **technical analysis** for **Fortis Healthcare (FORTIS)**
---
### 📝 **Technical Analysis – Fortis Healthcare (Daily Timeframe)**
**Date:** May 28, 2025
**Pattern Identified:** ✅ *Cup and Handle Breakout*
---
### 1. **Chart Pattern Overview**
* A well-formed **Cup and Handle** pattern is visible.
* The breakout level was **₹700**, and price is currently trading at **₹710.60**, confirming the breakout with a retest.
* The structure is bullish, suggesting **continuation of the uptrend**.
---
### 2. **Volume Analysis**
* Significant volume spike during the breakout phase above ₹700.
* Volume continues to remain strong, confirming **buyers' dominance** and **breakout strength**.
---
### 3. **Price Action Insights**
* Clean breakout from multi-month resistance zone of ₹700.
* Price is consolidating just above breakout level — indicates **healthy retest**.
* Next key level to watch: ₹744.50 (recent swing high).
---
### 4. **Target Projection**
* **Cup Depth**: ₹124
* **Breakout Point**: ₹700
* **Target Price** = ₹700 + ₹124 = **₹825**
➤ Potential upside: **+16%** from current levels
---
### 5. **Support & Stop-loss**
* **Immediate Support**: ₹700 (breakout level)
---
### 6. **Trend & Sentiment**
* The breakout has flipped the sentiment **strongly bullish**.
* Uptrend resumption is supported by price structure and volume confirmation.
---
### ✅ **Conclusion**
* **Pattern**: Cup and Handle
* **Breakout Level**: ₹700
* **Current Price**: ₹710.60
* **Target**: ₹825
* **Stop-loss**: ₹700 range
* **Action**: **Buy on dips / retest confirmation**

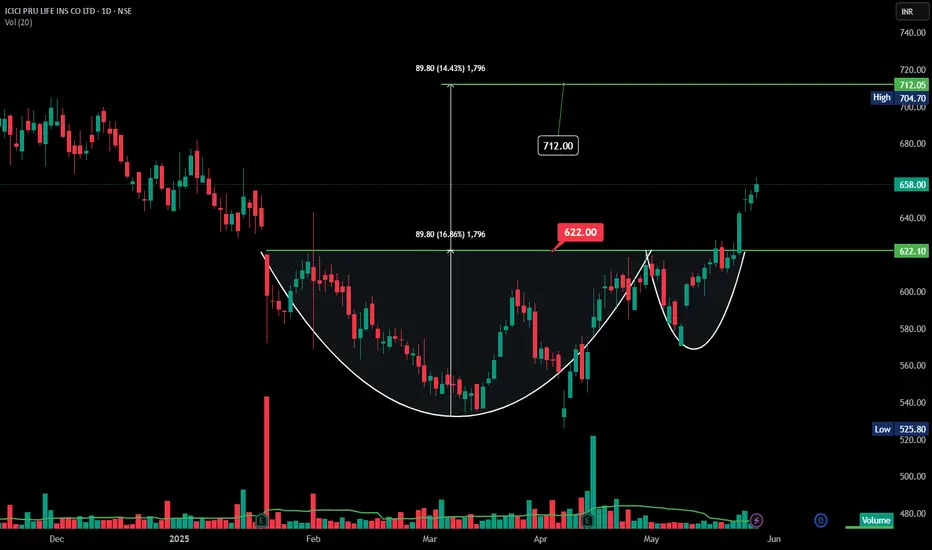
ICICIPRULI | Cup and Handle | Breakout | DailyHere's the **technical analysis** for **ICICI Prudential Life Insurance (ICICIPRULI)**
---
### 📝 **Technical Analysis – ICICI Pru Life (Daily Timeframe)**
**Pattern Identified:** ✅ *Cup and Handle Breakout*
---
### 1. **Chart Pattern Overview**
* A **classic Cup and Handle pattern** has formed and confirmed a breakout.
* The breakout happened above the **₹622** resistance level — this is now a **support**.
* The pattern signals a **bullish continuation**, with increased demand post-breakout.
---
### 2. **Volume Analysis**
* Volume spiked significantly during the breakout from the handle, suggesting strong **institutional participation** and high conviction buying.
* Volume > 850K, well above the 20-day average — a **positive confirmation**.
---
### 3. **Price Action & Strength**
* Stock is currently trading at **₹658**, comfortably above the breakout zone.
* Strong follow-up candles indicate **momentum continuation**.
* No signs of bearish reversal or heavy profit booking.
---
### 4. **Target Projection**
* **Cup Depth** = ₹89.80
* **Breakout Point** = ₹622
* **Target Price** = ₹622 + ₹89.80 = **₹712.00**
➤ Potential upside: **8%** from current levels
---
### 5. **Support & Stop-loss**
* **Support** = ₹622 (previous resistance)
* **Aggressive Stop-loss** = ₹640
* **Conservative Stop-loss** = Below ₹622
---
### 6. **Trend & Sentiment**
* Overall trend is **bullish**, and the stock has broken out of a multi-month consolidation.
* Sentiment is turning favorable with improving volumes and structure.
---
### ✅ **Conclusion**
* **Pattern**: Cup and Handle Breakout
* **Target**: ₹712
* **Current Price**: ₹658
* **Support**: ₹622
* **Action**: **Buy on dips**, with SL below ₹622 for swing targets.
---
TATAELXSI | Cup and Handle | Daily |### 📝 **Technical Analysis – Tata Elxsi (Daily Timeframe)**
**Chart Pattern:** ✅ *Cup and Handle Breakout*
---
### 1. **Chart Structure & Pattern**
* The chart displays a **Cup and Handle pattern**, a bullish continuation pattern.
* The **cup** is broad and rounded, indicating accumulation and gradual buying interest.
* The **handle** is a short consolidation phase with lower volume before the breakout.
* The **breakout zone** was around **₹5,940**, which acted as a strong resistance earlier.
---
### 2. **Volume Confirmation**
* Significant **volume spike** during breakout confirms genuine buying interest.
* The breakout was not a false one — strong bullish candle with volume above 175K supports this.
---
### 3. **Price Action**
* After breakout, Tata Elxsi is sustaining above ₹6,470 — showing **strength and follow-through**.
* This price action reflects **buy-on-dips** sentiment.
---
### 4. **Target Projection**
* **Depth of the Cup**: ₹1,216 (approx).
* **Breakout Level**: ₹5,940
* **Target (Breakout + Depth)** = ₹5,940 + ₹1,216 = **₹7,145**
➤ This gives a potential **upside of 20%** from breakout zone.
---
### 5. **Support & Stop-loss**
* **Key Support** = ₹5,940 (previous resistance turned support).
* **Aggressive SL** = ₹6,200
* **Conservative SL** = ₹5,940
---
### 7. **Conclusion**
* **Trend**: Bullish
* **Pattern**: Cup and Handle Breakout
* **Target**: ₹7,145
* **Support Zone**: ₹5,940
* **Action**: Can consider buying on dips with SL below ₹5,940

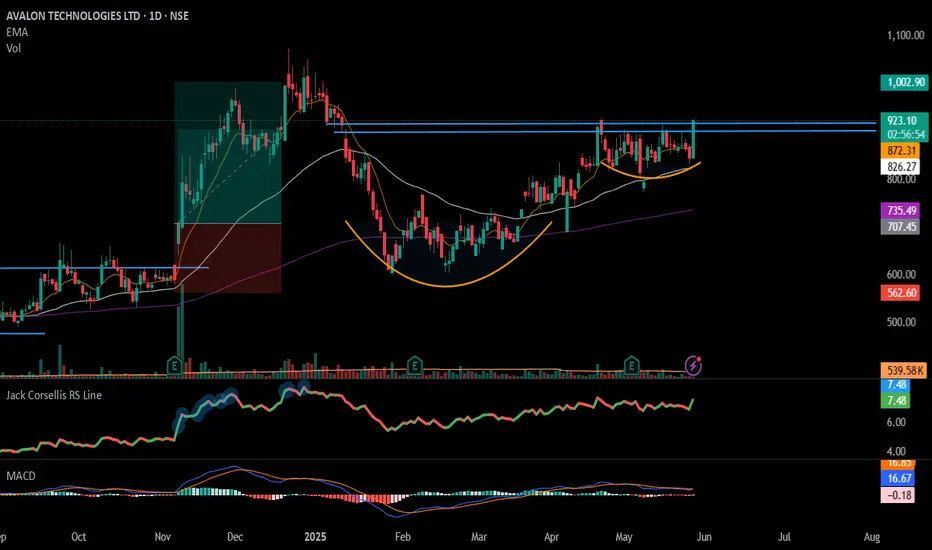
#AVALON - Cup & Handel Potential BreakOut / Keep In WatchList📊 Script: AVALON
Key highlights: 💡⚡
📈 Cup & Handel Potential BreakOut in Daily Time Frame.
📈 Price consolidating near Resistance.
📈 Wait for Volume spike during Breakout
📈 MACD Bullish
📈 Can go for a swing trade
BUY ONLY ABOVE 930 DCB
⏱️ C.M.P 📑💰- 915
🟢 Target 🎯🏆 – NA%
⚠️ Stoploss ☠️🚫 – NA%
⚠️ Important: Market conditions are Okish, Position size 50% per Trade. Protect Capital Always
⚠️ Important: Always Exit the trade before any Event.
⚠️ Important: Always maintain your Risk:Reward Ratio as 1:2, with this RR, you only need a 33% win rate to Breakeven.
✅Like and follow to never miss a new idea!✅
Disclaimer: I am not SEBI Registered Advisor. My posts are purely for training and educational purposes.
Eat🍜 Sleep😴 TradingView📈 Repeat 🔁
Happy learning with MMT. Cheers!🥂
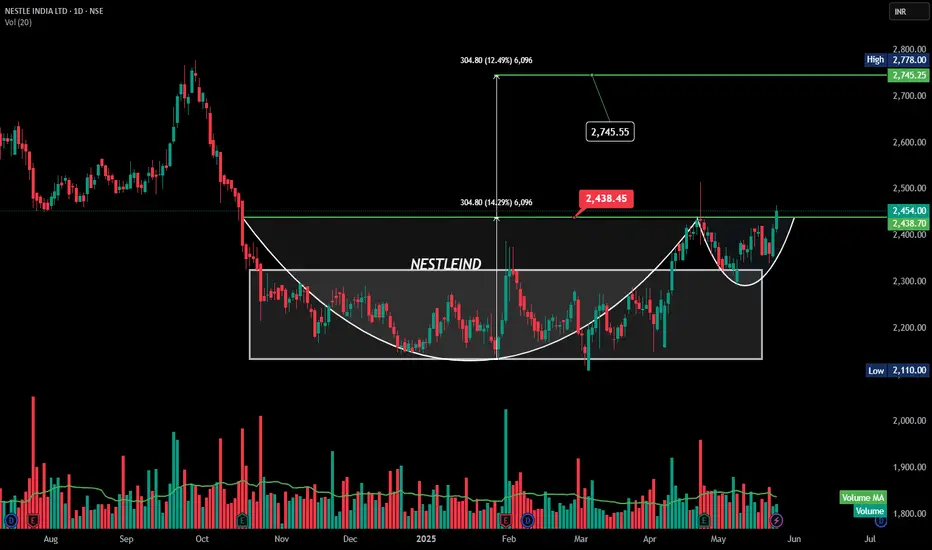
NESTLEIND |Cup & Handle Breakout | DailyThis chart of **Nestle India Ltd** shows a **Cup and Handle** breakout pattern — a strong bullish continuation signal.
---
### 🟢 **Cup & Handle Breakout – Nestle India Ltd**
#### **Pattern Highlights:**
* **Cup Formation:** Long rounding bottom from Nov 2024 to April 2025.
* **Handle:** Minor consolidation and dip in May 2025.
* **Breakout Point (Neckline):** ₹2,438.45
* **Target Projection:**
Height of cup ≈ ₹305
📈 Target = ₹2,438 + ₹305 = **₹2,745** (marked)
### ✅ Key Takeaways:
* **Breakout is with volume**, confirming strength.
* **Next resistance zones**: ₹2,745.60 and ₹2,768.60.
* **Supports post-breakout**: ₹2,438 (neckline).
Would you like a full YouTube-ready set (title, description, tags, disclaimer) for this chart as well?
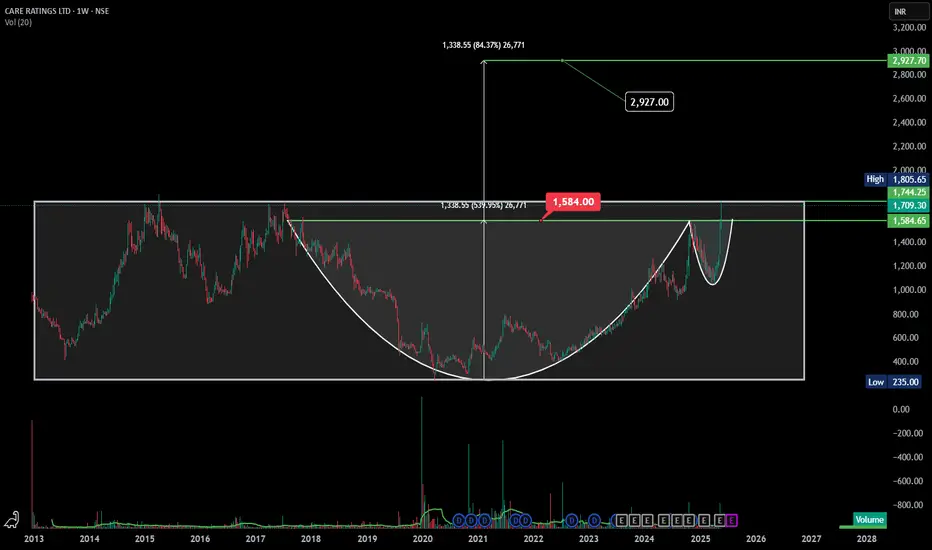
CARERATING ATH Breakout | Cup & Handle Pattern - ₹2927 Here’s the **technical analysis** for **CARE Ratings Ltd (NSE: CARERATING)**
---
### 📊 **Technical Analysis – CARE Ratings Ltd (Weekly Time Frame)**
#### ✅ **Pattern Identified: Cup and Handle Breakout**
* A **multi-year Cup and Handle pattern** has completed.
* Price broke out **above the neckline/resistance zone of ₹1584**, confirming the bullish breakout.
* This breakout follows a prolonged accumulation and consolidation phase from **2018 to 2023**, which adds to its reliability.
---
### 📈 **Breakout Details:**
* **Breakout Level (Neckline):** ₹1584
* **Current Price (May 25, 2025):** ₹1709.30
* **Target (Pattern Projection):** ₹2927
* **Measured Move:** ₹1338.55 (Cup depth) projected above breakout level
* **Potential Upside:**+84% from breakout point
---
### 🔎 **Volume & Momentum:**
* **Volume Surge** confirms buying interest and institutional accumulation.
* Recent breakout candle shows strong bullish momentum with a close well above the resistance.
* The **handle portion** formed a tight consolidation, suggesting reduced selling pressure.
---
### 🟢 **Support Levels:**
* **Major Support:** ₹1584 (previous resistance turned support)
* **Secondary Support:** ₹1350 zone (handle low)
---
### 🚨 **Resistance Levels:**
* **Immediate Resistance:** ₹1745–₹1800 zone (short-term supply zone)
* **Major Resistance:** None until the projected target of ₹2927
---
### 📌 **Conclusion:**
CARE Ratings has given a **textbook Cup & Handle breakout** on the weekly chart with high volume and strong price action. The pattern suggests **long-term bullish potential**, making it a **strong candidate for swing or positional trading**. Traders may watch for a **retest of ₹1584** for low-risk entry opportunities.
---
RELIANCE POWER | Cup and Handle Breakout | Multi-Year Bullish- Technical analysis (RELIANCE POWER LTD, Weekly timeframe):
Dark horse bet
---
### 📊 **Chart Pattern:**
**Cup and Handle** formation (long-term)
---
### 🧩 **Pattern Breakdown:**
* **Cup Formation:**
From \~2018 to mid-2023, the price shows a deep, rounded bottom formation, typical of a cup base. This indicates a long accumulation phase after a downtrend.
* **Handle Formation:**
A smaller consolidation happened after the breakout from the cup, forming a handle, suggesting a pause before a potential continuation.
---
### 🔍 **Key Technical Levels:**
* **Breakout Level:** ₹50.50
The breakout above this level confirms the completion of the cup and handle pattern.
* **Current Price:** ₹51.90
Price has broken out with strong volume, confirming bullish strength.
* **Targets based on pattern projection:**
* **Short-Term Target:** ₹68.09
(based on the height of the cup added to the breakout point)
* **Resistance Zone:** ₹68.00
* **Support Levels:**
* Immediate: ₹50.50 (breakout retest zone)
* Stronger: ₹34.44 and ₹21.59 (previous accumulation zones)
---
### 📈 **Volume Analysis:**
* Volume is significantly increasing during the breakout from the handle, confirming strong buying interest.
* Volume MA is trending up, indicating a sustained move.
---
### 🧠 **Conclusion:**
* **Bias:** Bullish
* **Pattern Strength:** Strong (due to multi-year formation and breakout with volume)
* **Risk Management:**
Watch for retest of ₹50.50–₹51 zone. A failure to hold here could lead to a pullback toward ₹34.44.
---

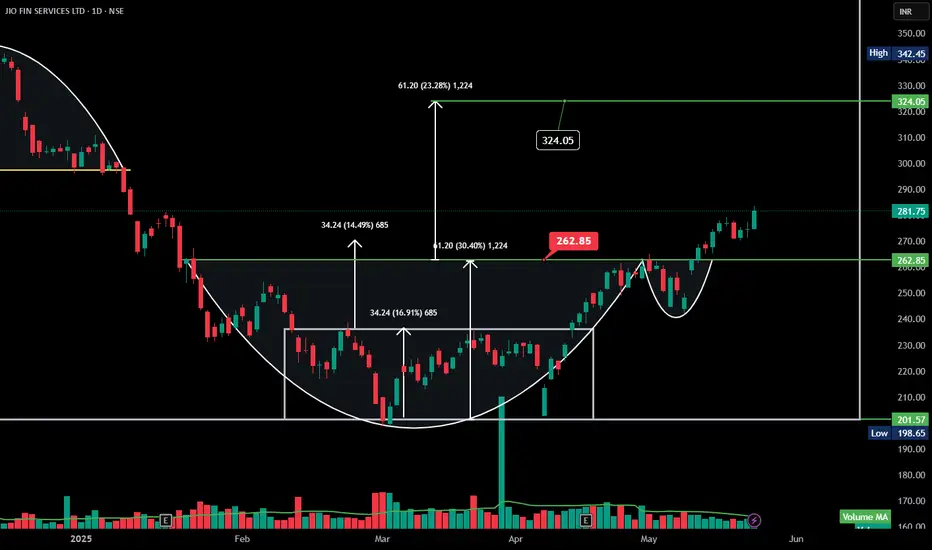
JIOFIN | Cup & Handle Breakout! Target ₹324 Here is the **technical analysis** for **JIO FIN SERVICES LTD (NSE)** based on your chart:
---
### 📊 **Technical Analysis – JIO FIN SERVICES LTD**
**Pattern Identified:** Cup and Handle
**Breakout Level:** ₹262.85
**Target Price:** ₹324.05
**Current Market Price:** ₹281.75
**Potential Upside:**15% from current levels
---
### ✅ **Bullish Signals:**
* **Cup and Handle Formation:** A textbook bullish continuation pattern signaling accumulation followed by a breakout.
* **Breakout Confirmation:** Price has broken above the resistance zone (₹262.85) with strength and follow-through buying.
* **Volume Confirmation:** Breakout was accompanied by higher-than-average volume, reinforcing the validity of the pattern.
* **Measured Move Target:** Based on the cup depth (₹61), the projected target is ₹324.05.
---
### 📌 **Key Levels:**
* **Immediate Resistance:** ₹324.05 (target zone)
* **Support Zones:**
* ₹262.85 (handle breakout support)
* ₹201.57 (previous swing low, base of cup)
---
### 📈 **Conclusion:**
JIO FIN SERVICES is displaying strong bullish momentum after confirming a **Cup and Handle** breakout. As long as the price holds above ₹262.85, the stock may trend toward ₹324+. A retest of the breakout zone can be a good opportunity to accumulate.
---
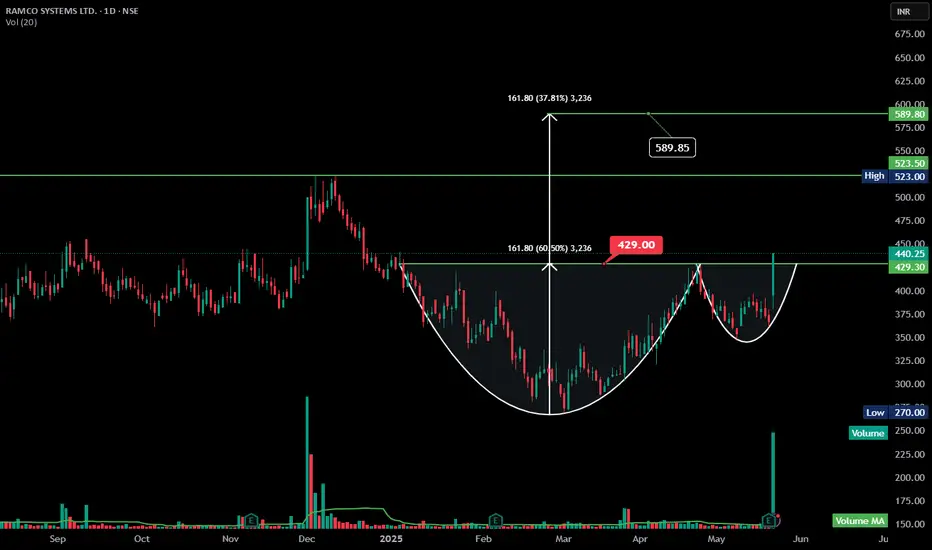
RAMCOSYS Bullish Cup and Handle Breakout | Daily**technical analysis** for the RAMCO SYSTEMS LTD chart:
---
### **Technical Analysis – RAMCO SYSTEMS LTD (NSE: RAMCOSYS)**
**Pattern:** Cup and Handle
**Breakout Level:** ₹429
**Current Price:** ₹440.25
**Volume Confirmation:** Strong volume on breakout day (1.82M), supporting validity of the breakout.
**Target Price:** ₹589.80 (based on height of cup added to breakout point)
**Percentage Upside from Breakout:** \~37.81%
**Support Levels:** ₹429 (previous resistance), ₹380 (handle base)
**Stop-Loss (if trading):** Below ₹400 for short-term traders
**Analysis Summary:**
Ramco Systems has broken out of a classic Cup and Handle pattern with strong bullish momentum and a nearly 20% single-day gain. The breakout is supported by significant volume, indicating strong buying interest. The projected target lies around ₹589 based on the pattern measurement. Traders should watch for sustained volume and price action above ₹429 for continuation.
---
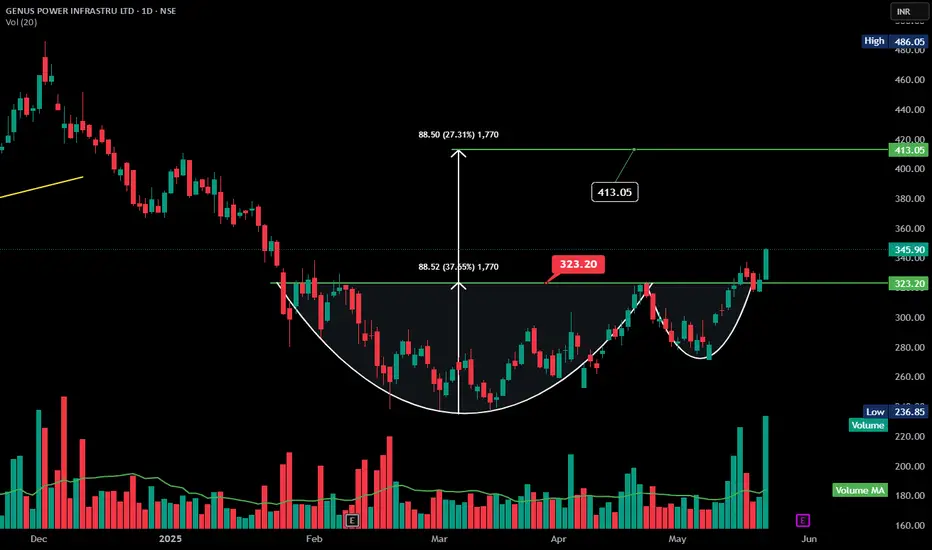
GENUSPOWER Breakout | Cup and Handle Pattern Here's a **technical analysis summary** for **Genus Power Infrastructures Ltd (NSE: GENUSPOWER)** based on the chart you provided:
---
### 📊 **Technical Analysis – Genus Power**
* **Pattern Formed**: **Cup and Handle** breakout
* **Breakout Level**: ₹323.20
* **Current Price**: ₹345.90 (+6.22%)
* **Target Price**: ₹413.05 (based on pattern height projection)
* **Volume**: Significant volume spike confirming breakout
* **Price Action**: Strong bullish momentum with follow-through after handle formation
* **Support Zone**: ₹323.20 (previous resistance turned support)
* **Breakout Strength**: Backed by increased volume and momentum indicators
---
📈 **Interpretation**:
The breakout above ₹323.20 from a textbook **cup and handle** pattern indicates a **bullish trend continuation**. Volume surge adds strength to the breakout, making ₹413 a reasonable short-to-mid-term target.
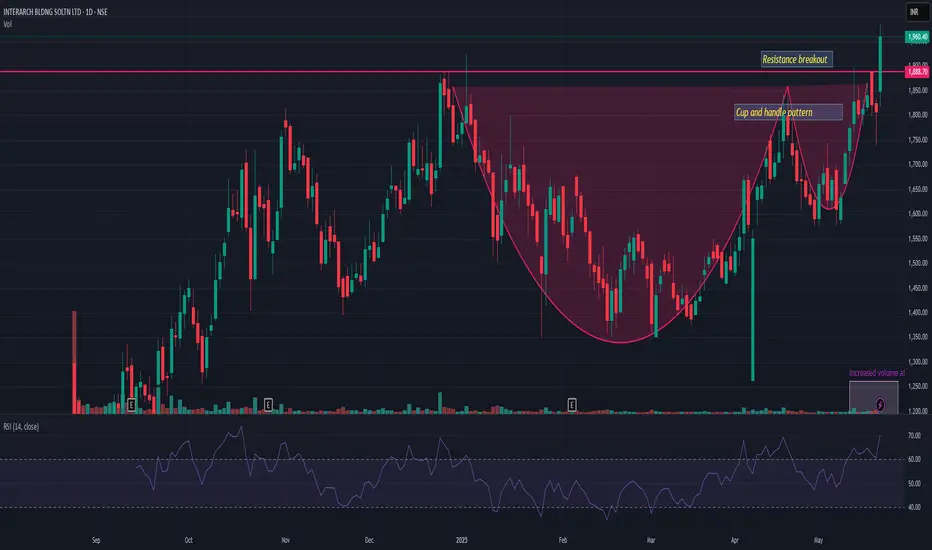
INTERARCHINTERARCH has given resistance breakout with decent volume. Posted very good result on both front QoQ and YoY. Cup and handle pattern also observed and given recent breakout of the same. Closing below 1750 may change the view. And on upper side pattern resistance may be possible near 2300. Looks very strong for momentum
IDBI Bank Breakout -Volume | Can test ₹109 | Cup & Handle ExpHere’s a **technical analysis infographic summary for IDBI BANK LTD** based on the chart you provided:
---
### 📊 **IDBI BANK LTD – Daily Chart Summary**
* **Pattern Formed:** ☕ **Cup and Handle (Bullish Continuation)**
* The cup formation is clearly visible and a breakout has occurred above the neckline resistance.
* **Breakout Zone:**
* **Neckline resistance:** ₹87.55 (now acting as support)
* **Breakout confirmation with volume**
* **Measured Move Target:**
* Cup Depth: ₹21.56
* Target = ₹87.55 + ₹21.56 = **₹109.00**
* **Current Price:** ₹94.52 (as of the latest candle)
* **Volume Analysis:** 📈
* Significant surge in volume on breakout = strong buying interest.
* Volume well above moving average – confirms breakout strength.
* **Support Levels:**
* Immediate: ₹87.56
* Lower: ₹68.00 and ₹65.91 (base of the cup)
* **Resistance Ahead:**
* Minor: ₹95.99 (recent high)
* Target zone: **₹107.99 – ₹109.00**
---
### 📌 **Technical View:**
**Bullish breakout confirmed** from a classic cup pattern. Price is heading towards the projected target of ₹109 with strong volume support. Dips toward ₹87–₹90 may provide accumulation opportunities.
---

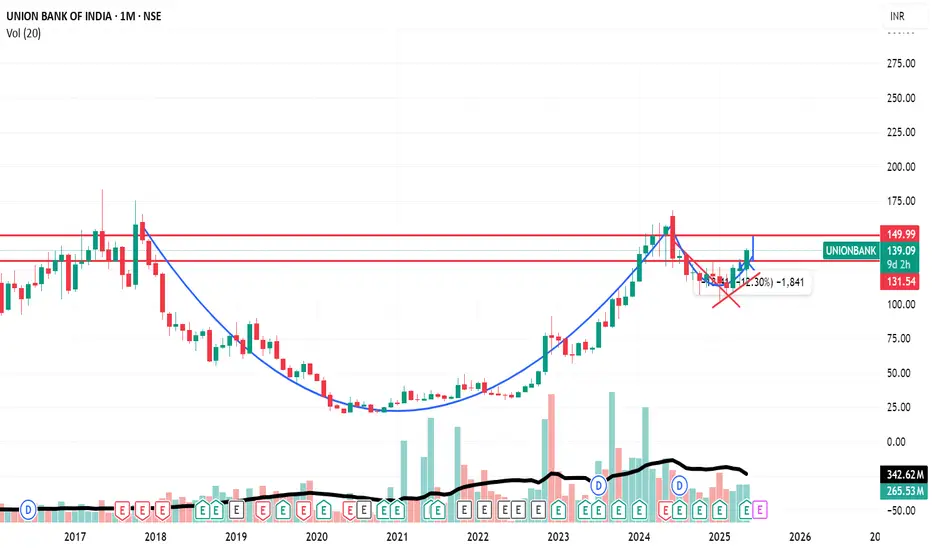
Union Bank Cup and Handle breakout with double bottom on daily.Union bank is about to breakout of a cup and handle pattern with strong signals of breakout of double bottom on a daily timeframe. Good script to invest.
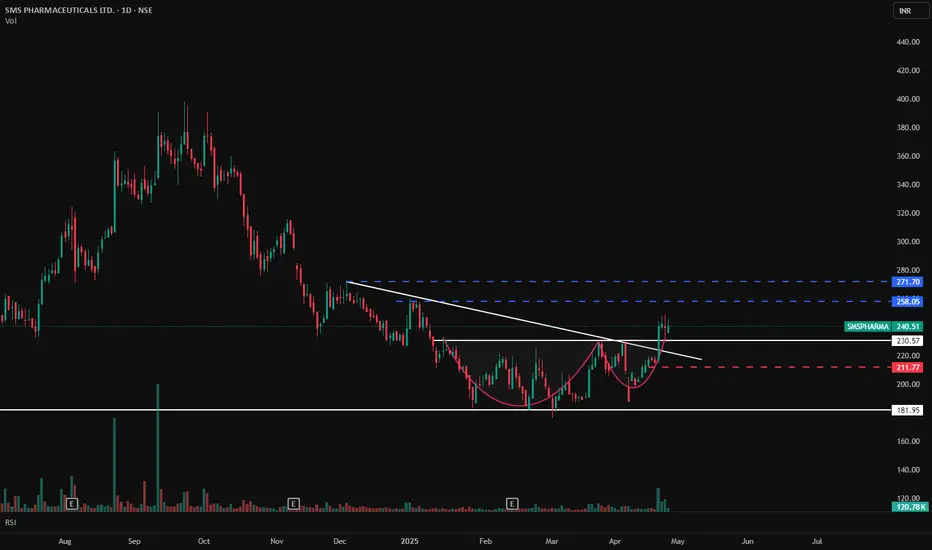
SMS PHARMA - Cup & Handle Breakout with Volume Confirmation📊 SMS PHARMA – Cup & Handle Breakout with Volume Confirmation
🕰️ Timeframe: 1D | 📐 Pattern: Cup & Handle Formation
🔍 Technical Setup:
SMS Pharma has formed a classic Cup & Handle pattern, which is a bullish continuation pattern. The breakout has occurred above the neckline resistance with a clean breakout candle, confirming bullish momentum.
The falling trendline resistance has also been decisively broken, adding further confidence to the breakout strength.
🔑 Key Levels to Watch:
🔵 Resistance (Upside Targets):
₹258.05
₹271.70
🔴 Support Zones:
₹230.57 (neckline support)
₹211.77 (handle base)
₹181.95 (major horizontal support zone)
📊 Volume & Indicators:
🔺 Volume Surge at breakout confirms strength and participation — a good sign for trend continuation.
📈 RSI: 64.58 — close to overbought zone, but still indicating strength. Minor consolidation near ₹240 would be healthy before further up move.
🧠 Bias: Bullish
📉 Any pullback to ₹230–₹235 can offer a good entry opportunity with risk managed below ₹211.
⚠️ Disclaimer: This is an educational analysis and not investment advice. Do your own research before making any trading decisions.
📈 Follow @PriceAction_Pulse for more breakout setups and swing trading ideas!
💬 Drop your thoughts in the comments — will this Cup & Handle breakout hit the ₹270 zone?
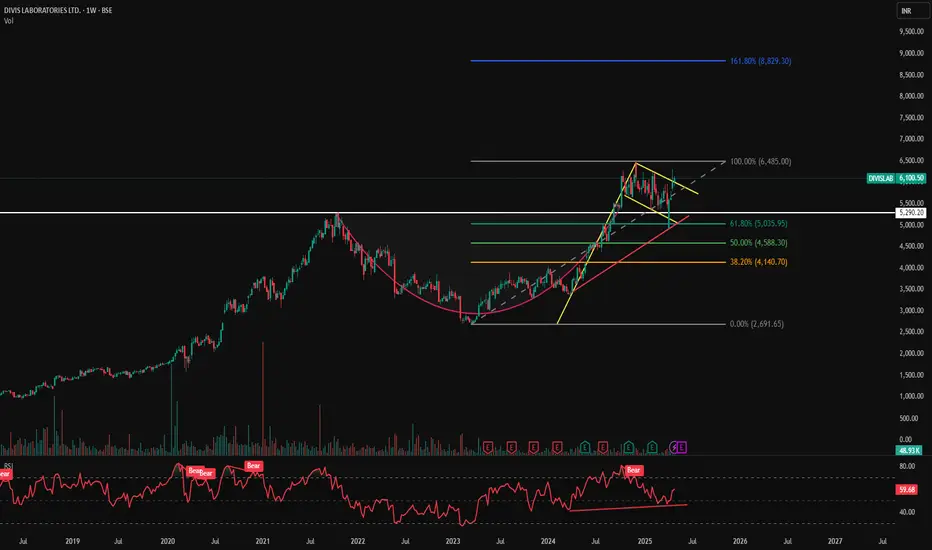
DIVISLAB - Cup Pattern Breakout with Bullish Flag Consolidation📊 DIVISLAB – Cup Pattern Breakout with Bullish Flag Consolidation
🕰️ Timeframe: 1W | 🔍 Pattern: Cup Formation + Bullish Flag | 🚀 Long-Term Breakout Potential
📈 Technical Breakdown:
DIVISLAB has formed a massive Cup pattern on the weekly timeframe and is currently consolidating inside a Bullish Flag after hitting the neckline breakout. This is a classic continuation setup following a long accumulation.
Post breakout, the price tested the upper region and is now preparing for a potential next leg toward Fibonacci extension levels.
🔑 Key Support & Resistance Levels:
🔵 Resistance / Upside Targets:
₹6,485.00 (Cup breakout top)
₹8,829.30 (Fib extension 161.8%) 🟦
🔴 Support Zones:
₹5,290.20 – Local horizontal support
₹5,035.95 – Fib 61.8% retracement (strong support)
₹4,588.30 – Fib 50%
₹4,140.70 – Fib 38.2%
₹2,691.65 – Long-term base (0% Fib)
🧭 Strategic View:
🟢 Bias: Bullish
🔁 Retest Zone: ₹5,290–₹5,035 can be re-entry zones
🎯 Target Zones: ₹6,485 followed by ₹8,829 for positional long
🛑 Invalidation: Below ₹5,000 zone
⚠️ Disclaimer: This is an educational chart setup and not trading advice. Please conduct your own research and risk management.
📣 Follow @PriceAction_Pulse for more such clean breakouts and chart pattern analysis!
🔁 Drop a comment if DIVISLAB is on your radar for the next breakout rally 📈
DELHIVERY- CUP AND HANLDE PATTERN BREAKOUT ( Bullish)Delhivery has formed CUP AND HANDLE pattern on the Daily charts and has given a breakout .
A Cup and Handle price pattern resembles a cup with a handle, where the cup is in the shape of a "u" and the handle has a slight downward drift. A cup and handle is considered a bullish signal signalling an uptrend.
Delhivery is trading above its 11 & 22 day EMA. RSI is at 73, MACD is above zero line signalling positive momentum.
CMP- Rs. 318
Target Price- Rs390 ( 25 % upside)
SL - 300 ( Breaking the confirmation Line)
Disclaimer: This is not a buy/sell recommendation. For educational purpose only. Kindly consult your financial advisor before entering a trade.

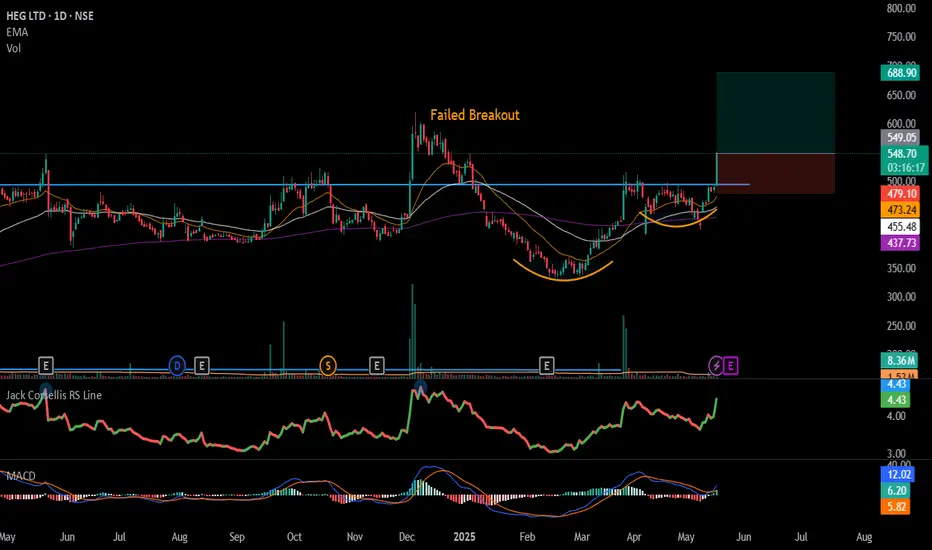
#HEG - Cup & Handel Set up in Daily Time Frame📊 Script: HEG
Key highlights: 💡⚡
📈 Cup & Handel Set up in Daily Time Frame.
📈 Price consolidated near Resistance.
📈 BO with Volume
📈 MACD Crossover
📈 Do not Enter Trade as we have Earning coming up
BUY ONLY ABOVE 545 DCB
⏱️ C.M.P 📑💰- 547
🟢 Target 🎯🏆 – NA%
⚠️ Stoploss ☠️🚫 – NA%
️⚠️ Important: Market conditions are Okish, Position size 50% per Trade. Protect Capital Always
⚠️ Important: Always Exit the trade before any Event.
⚠️ Important: Always maintain your Risk:Reward Ratio as 1:2, with this RR, you only need a 33% win rate to Breakeven.
✅Like and follow to never miss a new idea!✅
Disclaimer: I am not SEBI Registered Advisor. My posts are purely for training and educational purposes.
Eat🍜 Sleep😴 TradingView📈 Repeat 🔁
Happy learning with MMT. Cheers!🥂
SARLAPOLY - Cup & Handle Breakout With Fibonacci Confluence📊 SARLAPOLY – Cup & Handle Breakout with Fibonacci Confluence
🕰️ Timeframe: 1D | 📐 Pattern: Cup Formation + Trendline Breakout
🔍 Technical Overview:
SARLAPOLY has completed a Cup pattern and given a strong breakout above the descending trendline resistance, accompanied by a massive volume spike.
The breakout aligns well with the 61.8% Fibonacci retracement level (~₹100.94), increasing confidence in the breakout's validity.
🔑 Key Technical Levels:
🔵 Resistance / Upside Targets:
₹117.88 (Fib 78.6%)
₹120.00
₹123.68
₹125.00
₹127.90
₹132.25 (100% Fib retracement)
🔴 Support Zones:
₹101.13 (recent breakout level / Fib 61.8%)
₹94.66 (previous resistance zone – now support)
₹91.27 (Fib 50%)
₹69.07 (23.6% Fib + structure support)
📊 Volume & Indicators:
📈 Breakout Volume Surge – Volume confirmation indicates institutional interest and breakout strength.
🧮 Fibonacci Retracement – Plotted from swing low (₹50.30) to swing high (₹132.25), gives clear confluence zones.
🔺 Trendline Breakout – Downward sloping trendline broken cleanly, confirming bullish intent.
☕ Cup Formation – Classic rounding bottom visible, suggesting accumulation phase is complete.
🧠 Bias: Bullish
📉 Watch for a retest around ₹100–₹101 zone as a potential re-entry point with SL below ₹94.66 for positional swing.
⚠️ Disclaimer: This is an educational analysis and not financial advice. Always do your own research before making investment decisions.
📈 Follow @PriceAction_Pulse for more price action setups, breakout alerts, and swing trade ideas!
💬 Comment below if you’re watching SARLAPOLY for the next leg up 📊

PREMEXPLN - Cup & Handle Breakout | Volume Surge📊 PREMEXPLN – Cup & Handle Breakout | Volume Surge + Key Fibonacci Confluence!
🕰️ Timeframe: 1D | 📐 Pattern: Cup & Handle | 📊 Momentum: Bullish
📈 Technical Chart Overview:
Premier Explosives has executed a clean breakout above a long-term descending trendline and a cup & handle base with a massive spike in volume, hinting at a powerful trend reversal.
Price surged nearly +19% intraday, confirming strength near the 61.8% Fibonacci retracement from the previous swing high at ₹910.30 to the swing low at ₹253.40.
🔍 Chart Highlights:
☕ Cup & Handle Pattern: Formed over several months, signaling accumulation and breakout
📐 Descending Trendline: Broken with strength and volume confirmation
📊 Volume Spike: Volume highest since April 2024 – strong buyer interest
🟢 Breakout Zone: ₹472.65–₹480.00 (key previous resistance)
🔴 RSI (14): At 67.72 – approaching overbought zone, suggesting strong momentum
🧱 Support & Resistance Levels:
Level Type Price (₹)
🔼 Resistance 1 504.10 (Fib 61.8%)
🔼 Resistance 2 581.10 (Fib 50%)
🔼 Resistance 3 659.90 (Fib 38.2%)
🔻 Support 1 440.00 (Breakout Retest Zone)
🔻 Support 2 308.75 (Horizontal demand zone)
🔻 Support 3 253.40 (100% Fib low)
🔧 Indicators Used:
Fibonacci Retracement – Plotted from ₹910.30 to ₹253.40
RSI (14) – Showing bullish divergence and breaking out of consolidation
Volume Bars – Confirming breakout with institutional strength
Bull/Bear Icons – Track momentum shifts visually over RSI
🧭 Trade Outlook:
✅ Bias: Bullish
🛒 Entry Zone: Retest near ₹472.65–₹480 (ideal pullback entry)
🎯 Targets: ₹504 → ₹581 → ₹660+
❌ Invalidation: Close below ₹440 with volume
💬 Summary:
PREMEXPLN looks strong on the daily chart after breaking a classic cup & handle pattern with volume confirmation. The breakout aligns perfectly with Fibonacci retracement zones, suggesting room for continued upside. Monitor for a potential retest entry.
⚠️ Disclaimer: This is a technical analysis chart for educational purposes only. Do your own research and consult a financial advisor before trading.
🔔 Follow @PriceAction_Pulse for more breakout charts, swing trades & price action insights!
💾 Save and share if PREMEXPLN is on your watchlist this week.
