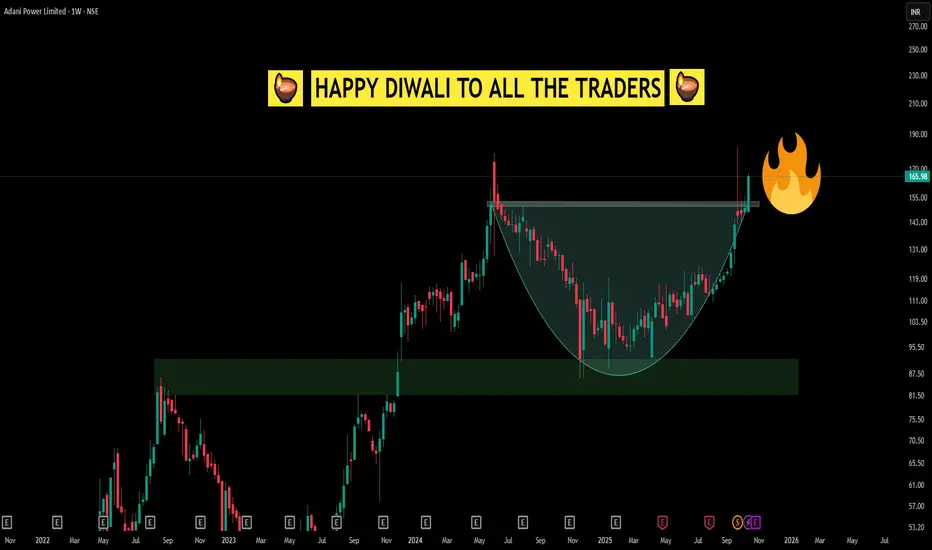
Simple CUP Pattern looking like a Diwali Diya Happy Diwali to All Traders!
This Diwali, the chart tells a special story—a classic cup breakout, but look closely and you'll notice it also resembles a beautifully lit diya. Just like Diwali celebrates the light conquering darkness, this breakout is a reminder of the power of patience, conviction, and disciplined observation in trading.
The cup pattern, much like the diya, signifies a period of accumulation, resilience, and hope before an illuminating breakout. As traders, we learn that enduring through the consolidation (the “darkness”) allows us to witness the rewarding move (the “light”) when the right moment comes.
May this Diwali fill your life and trading journey with wisdom, clarity, and prosperity. Wishing everyone strong breakouts, bright candles, and the perseverance to hold your lamp high, both in the markets and in life.
Cupbreakout
WAAREE ENERGIES LTD - Cup Breakout with Rising RSI⚡ WAAREE ENERGIES LTD – Cup Breakout with Rising RSI
🕒 Timeframe: 1D | NSE: WAAREENER
📅 Date: April 22, 2025
💰 CMP: ₹2,444.20
📈 Volume: 2.15M
🔍 Chart Observations
☕ Cup Formation visible on the daily chart – smooth rounding bottom structure, signifying accumulation.
📐 Breakout from Downtrend Line confirms bullish intent with strong momentum and volume.
🧱 Key Levels
🔵 Resistance Zones (Targets):
₹2,674.55 – recent swing high
₹2,869.00 – key psychological resistance
🔴 Support Level:
₹2,229.60 – neckline of cup & breakout retest zone
📉 Trendline:
Long descending trendline (white) has been broken on the upside
📊 Technical Indicators
📈 RSI (Relative Strength Index)
Currently at 63.93, comfortably in bullish territory
Recent “Bull” label marks bullish RSI divergence & breakout
Still has room to rise before overbought zone
✅ Conclusion
Cup pattern breakout with strong volume & positive RSI = bullish structure
Sustained move above ₹2,444 could invite targets of ₹2,670+ in coming sessions
Ideal setup for swing traders with a clear SL below ₹2,229
📉 Chart by: PriceAction_Pulse
📘 For educational use only. Always DYOR before making any trading decisions.

Castrol India LtdCastrol India Limited have given a break out of third wave in the longer time frame since it's listing Wave 3 will end on December 2029 we might C Castrol India around 1200 to 1300 at that time detail analysis with proper timing and levels along with RSI has been provided in the chart

Anticipating Breakout in Expleosol | Price action reading I daily make educational content videos for swing/positional trading

Long term Bullish view, Swing and Index trades for 9 September I daily make educational content videos on Financial markets
