BUY TODAY SELL TOMORROW for 5%DON’T HAVE TIME TO MANAGE YOUR TRADES?
- Take BTST trades at 3:25 pm every day
- Try to exit by taking 4-7% profit of each trade
- SL can also be maintained as closing below the low of the breakout candle
Now, why do I prefer BTST over swing trades? The primary reason is that I have observed that 90% of the stocks give most of the movement in just 1-2 days and the rest of the time they either consolidate or fall
Cup & Handle Breakout in KTKBANK
BUY TODAY SELL TOMORROW for 5%
Cupnhandle

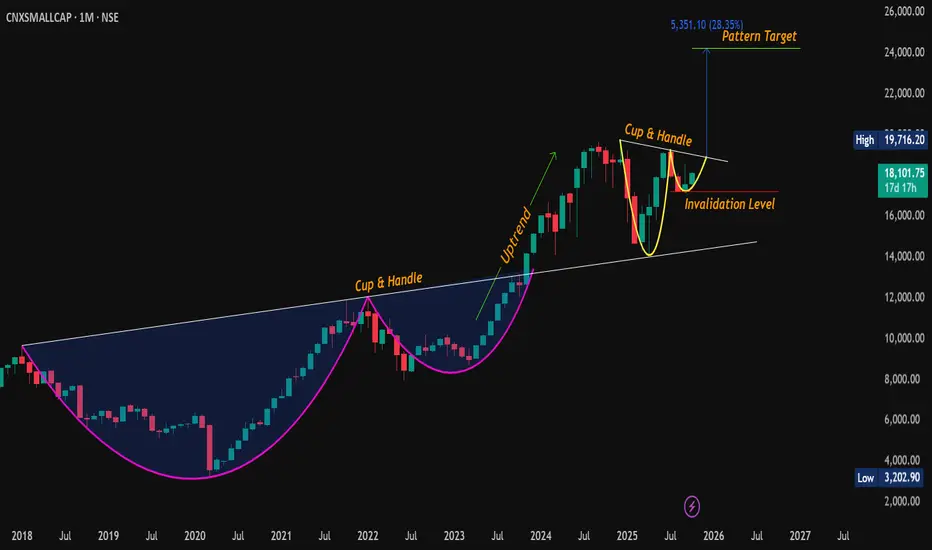
#CNXSMALLCAP | Monthly Cup & Handle Breakout Brewing!Classic Cup & Handle pattern is forming on the monthly chart of Nifty Small Cap Index , signaling potential for a strong bullish continuation if key resistance levels are cleared.
🔹 CMP: 18,102
🔹 Pattern: Cup & Handle (MTF)
🔹 Resistance Zones: 18505 - 18603 / 19075 - 19307 / 19716 (ATH)
🔹 Support Zones: 17601 - 17561 and Handle bottom 17209
🔹 Pattern Target: 24200 (+33% from CMP)
🔹 Pattern Invalidation Level: 17209 MCB
Watch for a strong breakout above the neckline . Monthly close above this level could trigger a fresh rally into uncharted territory.
#CNXSMALLCAP | #SmallCap | #SmallCapIndex | #CupAndHandle | #ChartPattern | #PriceAction | #BullishContinuation
📌 Disclaimer: This analysis is shared for educational purposes only. It is not a buy/sell recommendation. Please do your own research before making any trading decisions.
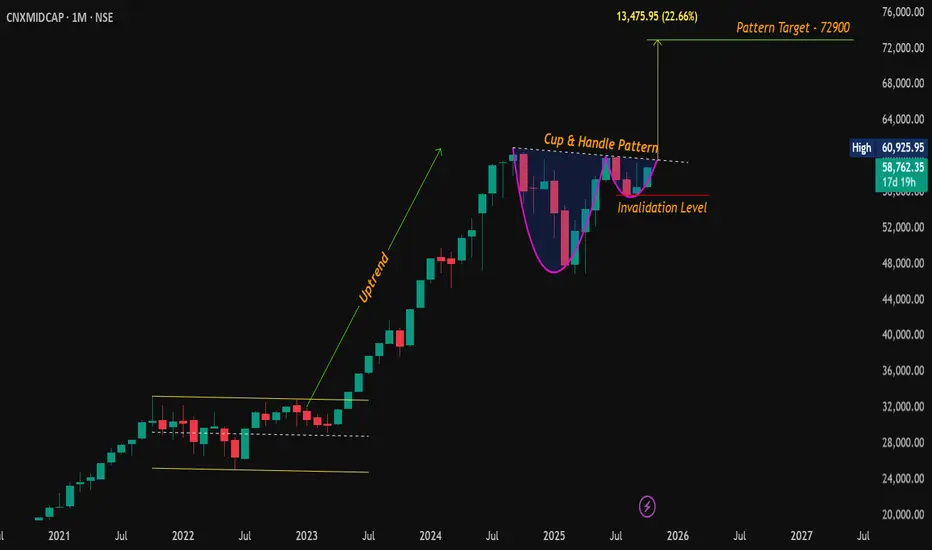
#CNXMidCap | Monthly Cup & Handle Breakout Setting Up!Classic Cup & Handle pattern is forming on the monthly chart of Nifty Mid Cap Index , signaling potential for a strong bullish continuation if key resistance levels are cleared.
🔹 CMP: 58,762
🔹 Pattern: Cup & Handle (Monthly Time Frame)
🔹 Breakout
🔹 Resistance Zones: 59,678 – 60,381 / 60,926 (All-Time High)
🔹 Support: 56,113
🔹 Pattern Target: 72,900 (+24% from CMP)
🔹 Invalidation Level: 55,660 (Monthly Close Below)
Watch for a strong breakout above 60,926 . M onthly close above this level could trigger a fresh rally into uncharted territory.
#CNXMIDCAP | #MidCap | #MidCapIndex | #CupAndHandle | #ChartPattern | #PriceAction | #BullishContinuation
📌 Disclaimer: This analysis is shared for educational purposes only. It is not a buy/sell recommendation. Please do your own research before making any trading decisions.
BUY TODAY SELL TOMORROW for 5%DON’T HAVE TIME TO MANAGE YOUR TRADES?
- Take BTST trades at 3:25 pm every day
- Try to exit by taking 4-7% profit of each trade
- SL can also be maintained as closing below the low of the breakout candle
Now, why do I prefer BTST over swing trades? The primary reason is that I have observed that 90% of the stocks give most of the movement in just 1-2 days and the rest of the time they either consolidate or fall
Cup & Handle Breakout in TANLA
BUY TODAY SELL TOMORROW for 5%

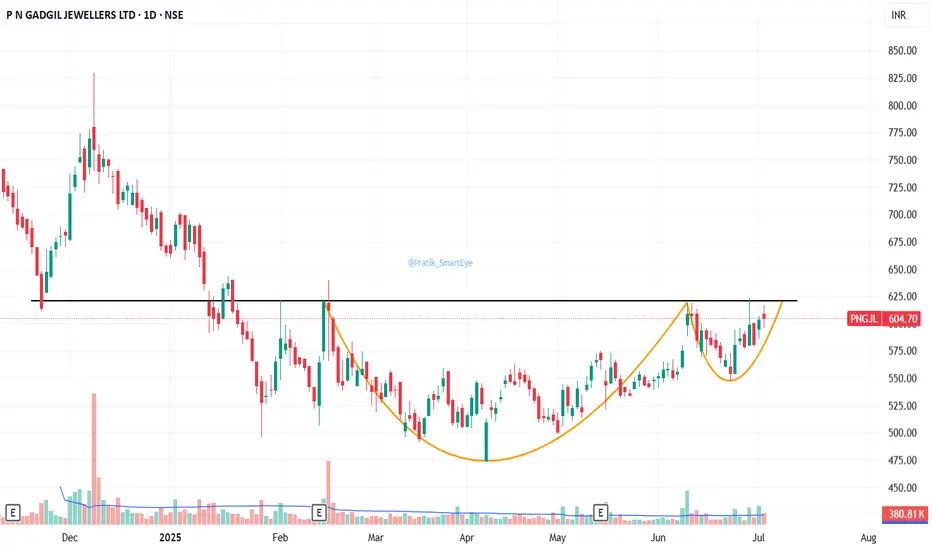
PNGJL: Forming IPO Base with Cup & HandlePNGJL: Forming IPO Base with Cup & Handle pattern,
breakout closing above 621. CMP 609.95
Resistance 663/723/780/830
Support 575
Strong Q1 FY26 Quarterly update.

PNGJL: forming a base with Cup & Handle patternPNGJL: forming a base with Cup & Handle pattern. Sustained close above 621 needed for breakout confirmation.
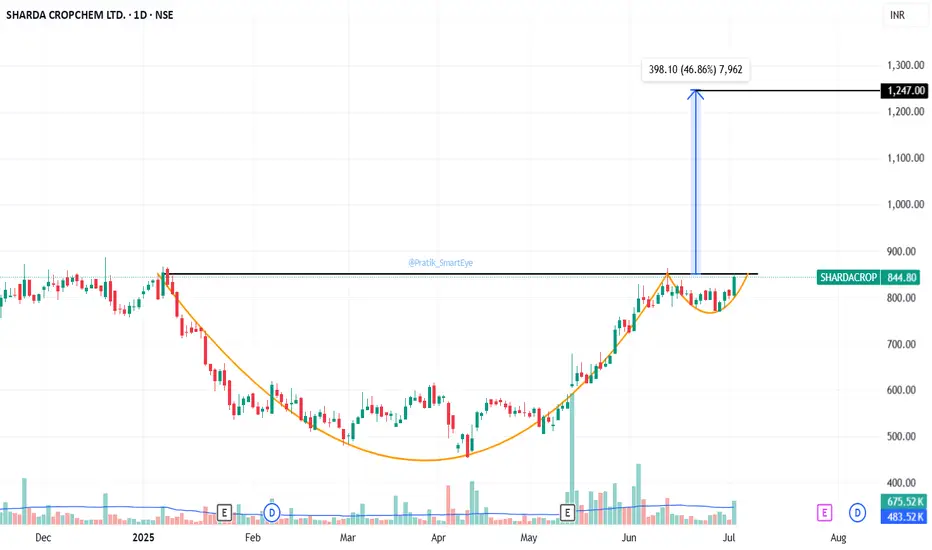
Sharda Cropchem: Breakout with C&HSharda Cropchem: Breakout with Cup & Handle Pattern at 850. CMP 844.
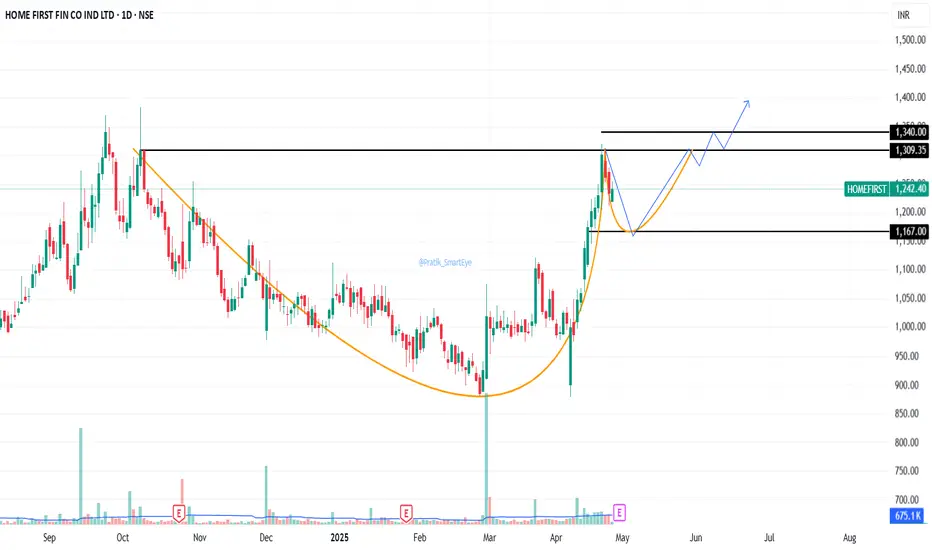
Home First Fin.: Cup & Handle Breakout.Home First Fin.: Cup & Handle Breakout. CMP 1342.
Resistance at 1740.
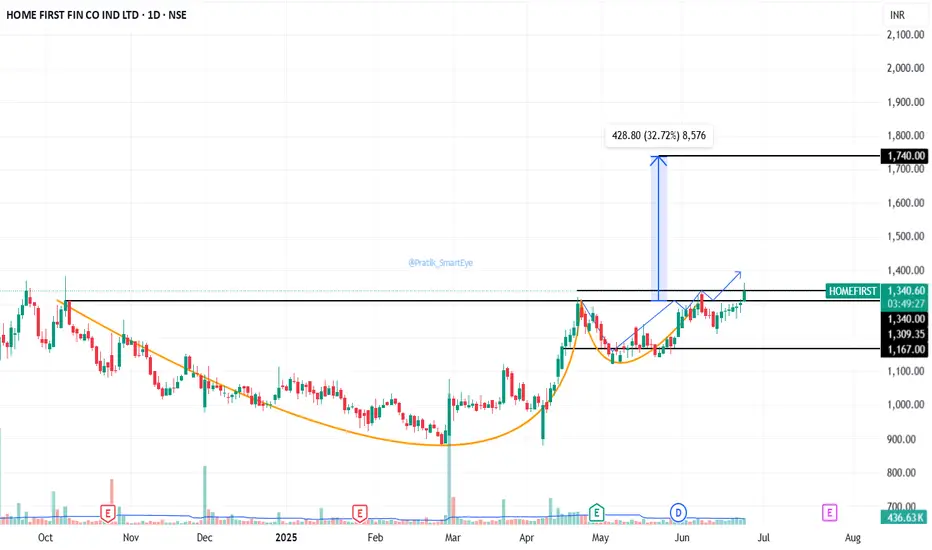
Home First: Cup & Handle pattern in formationHome First: Cup & Handle pattern in formation. Cup formed at 1309. Handle in progress.
Expect to take support and bounce. Reversal confirmation needed.
If support of 1167 is broken then view is negated.
Results expected on 30Apr
ICICI Bank Cup and Handle breakout DailyICICI Bank (NSE) Technical Analysis
Pattern Observed:
A Cup and Handle breakout pattern is visible.
The cup formation is well-rounded, and the handle was a shallow correction before the breakout.
Key Levels:
Breakout Zone: ₹1,364 (handle resistance breakout).
Current Price: Around ₹1,428.
Resistance Levels:
₹1,436 (recent high, minor resistance).
Major Target: ₹1,538 based on the measured move of the cup depth.
Support Levels:
₹1,364 (previous breakout zone — now support).
₹1,190 (major historical support).
Volume Confirmation:
Breakout above the handle accompanied by a good surge in volume, confirming the strength of the breakout.
Target Projection:
Height of Cup = ~173 points.
Projected Target = Breakout Point + Height
₹1,364 + 173 ≈ ₹1,538 (matches with your chart).
Strength Indicator:
Strong bullish momentum post-breakout.
Volume increasing on up-days — a healthy sign for continuation.

Neogen Chemicals could fire based on proven Technicals A decent Cup and handle Pattern up for grabs.
The base had a double bottom.
The handle also sort of made a double bottom.
I'm pretty confident of 30% + here.
Having said that do your own due diligence and always have a Stoploss to rescue you.

ALPA -Cup and Handle -Breakout -Daily -Unusual VolumeAnalysis of ALPA Laboratories Chart:
Cup and Handle Pattern:
The chart shows a well-defined cup and handle formation, which is a bullish continuation pattern. The cup part indicates a rounded bottom consolidation, while the handle signifies a short-term correction or pullback before the breakout.
The depth of the cup highlights a significant period of accumulation, followed by a breakout. The pattern started in early 2022 and was completed by 2023.
Shakeout & Volume Analysis:
The chart highlights that there was no significant volume during the breakout, leading to what is referred to as a "shakeout or false breakout." This indicates that weak hands were shaken off before the stock eventually surged.
However, the chart marks a retest after the shakeout, during which the stock bounced back with huge volume. This volume surge indicates strong buying pressure and institutional accumulation, validating the breakout as genuine.
Price Targets:
Based on the cup and handle pattern, the projected price target for the stock is 170 INR, as noted in the chart.
The price target calculation is typically done by measuring the depth of the cup and adding it to the breakout point, which appears to align with the chart's projection.
Recent Breakout:
The stock has recently broken out above a resistance level of 108.82 INR, with a strong surge in volume, indicating the potential for further upward momentum.
The breakout shows clear upward movement, with the stock currently trading at around 132 INR, gaining around 19.28% for the day.
Current Resistance and Support:
Resistance is noted at around 170 INR, as the price target based on the breakout.
Support lies around 108.82 INR, where the retest and bounce occurred, providing a strong support level going forward.
Conclusion:
ALPA Laboratories has shown a strong bullish breakout following a textbook cup and handle pattern. The significant volume during the retest and breakout indicates that the stock may have more upside, with a target of 170 INR in the coming weeks or months.

INDUSINDBK - Cup and Handle breakout - DailyName - INDUSINDBK
Pattern - Cup and Handle breakout
Timeframe - Daily
Volume - Avg
Cmp - 1464
Can test - 1570
SL - 1450
Q1 FY 2023-24 Key Highlights Consolidated financial results
o Net Interest Income (NII) grew by 18% YoY to ₹4,867 crores from ₹4,125 crores
o NIM improved to 4.29% as at Q1 FY24 as compared to 4.21% as at Q1 FY23 and 4.28% as at Q4 FY23
o Quarterly Net Profit grew by 30% YoY to ₹2,124 crores from ₹1,631 crores
o Deposits grew by 15% YoY to ₹3,47,047 crores from ₹3,02,719 crores
o Gross NPA and Net NPA ratios improved to 1.94% and 0.58% from 2.35% and 0.67% YoY respectively
and PCR at 71% as at June 30, 2023
o CRAR as on June 30, 2023 at 18.40% as compared to 18.14% on June 30, 2022
Always welcome for any comments with your feedback or give it a like if you find it useful.
==========================================================================
Disclaimer: This analysis is for informational purposes and not financial advice. The author is not a registered financial advisor. Individuals should conduct their research and seek professional advice before making investment decisions

WIPRO -Cup and Handle breakout - DailyName - WIPRO
Pattern - Cup and Handle breakout
Timeframe - Daily
Volume - Very Good
Cmp - 550
Can test - 604
SL - 542
Here’s a summary of Wipro Ltd’s Q1 FY25 results:
Financial Highlights
Net Profit: Wipro reported a net profit of INR 3,003 crore, a 4.6% increase from the same quarter last year1.
Revenue: The consolidated revenue for the quarter was INR 21,964 crore, which represents a 3.8% decline year-over-year (YoY)1.
Operating Margin: The IT services operating margin improved to 16.4%, up by 40 basis points quarter-over-quarter (QoQ)2.
Operational Highlights
Large Deal Bookings: Large deal bookings for the quarter were at $1.2 billion, an increase of 31.1% QoQ and 9.5% YoY2.
Voluntary Attrition: Voluntary attrition was at 14.2% on a trailing 12-month basis2.
Comparative Performance
Quarter-over-Quarter: Compared to the previous quarter, net income increased by 5.2%2.
Outlook
Wipro expects revenue from its IT Services business segment to be in the range of $2,617 million to $2,670 million for the next quarter2.
Always welcome for any comments with your feedback or give it a like if you find it useful.
==========================================================================
Disclaimer: This analysis is for informational purposes and not financial advice. The author is not a registered financial advisor. Individuals should conduct their research and seek professional advice before making investment decisions

LTTS - Watchlist - Ascending triangle - Cup and handle -Wkly LTTS - Forming Ascending triangle and cup and handle patterns on weekly charts.
Need to close above 5890 for breakout, which can test 8000 levels in a 6 to 12 month timeframe.
We can have it in watchlist for next week.
Strengths
The company is virtually debt-free.
The company has a good ROE track record of 27.20%.
The company has delivered average profit Growth of 23.19% in the last 3 years.
The company has delivered good income growth over the past 3 years of 20.47%.
The company has effective cash conversion ratio of 106.58.
Always welcome for any comments with your feedback or give it a like if you find it useful.
in.tradingview.com

Looks like a nice cup &Observation only - Not advice -
Handle looks complete
Any break above previous highs its an open blue sky above.
TGT 1 given

NATCOPHARM - CUP AND HANDLE FORMATION (BO FROM SUPPLY ZONE)Hi All,
This idea is about Natco Pharma
Fundamentals
Market Cap - 21712 Cr
Stock PE - 15
ROE - 25.9%
ROCE - 30%
Promoter Holding - 49.7
Quick Ratio - 3.42
D/E - 0.06
NATCO Pharma Limited (NATCO) is a vertically integrated, research and development focused pharmaceutical company engaged in developing, manufacturing, and marketing complex products for niche therapeutic areas.
Technicals
Since May 21, NATCO has formed a complete CUP and HANDLE formation on weekly chart and has now sustained the breakout for over 2 weeks. The earlier supply zone is now acting as demand zone indicating positive price action.
This is for mid/long term investors only
Hope you enjoy the idea,
Happy Trading,
Thanks,
Stock-n-Shine

ALEMBICLTD - WEEKLY CHART WITH CUP AND HANDLE BREAKOUTHi All,
This idea is about Alembic Ltd
Alembic Limited is engaged in the businesses of Pharmaceuticals, Real Estate, and Power Assets.
Fundamentals:
Market Cap ₹ 3,087 Cr.
Current Price ₹ 120
High / Low ₹ 122 / 72.2
Stock P/E 11.5
Book Value ₹ 85.1
ROCE 4.86 %
ROE 12.6 %
Equity capital ₹ 51.4 Cr.
EPS ₹ 10.5
Promoter holding 70.9 %
Market Cap to Sales 19.6
Sales growth 23.8 %
Technicals
As can be seen in the weekly chart of Alembic Ltd, if the price crosses 123 resistance it has an upside of 13% before meeting TOP RESISTANCE. Beyond that the stock will venture into uncharted territory of making ATH
Trade should not be taken before the price close above MAJOR RESISTANCE
Cup and handle formation with trend line resistance
Happy Trading,
Thanks,
Stock-n-Shine

MUTHOOTFIN - CUP AND HANDLE FORMATION WITH BREAKOUTHi All,
This idea is about Muthoot FInance
Very interesting pattern has emerged on Weekly chart.
Cup and Handle formation and then a successful breakout from both sip line and long term resistance.
Relative Strength has turned positive as compared to Nifty.
High relative volume crossing benchmark level of 2
Traders are advised to wait till price is as close to 10 SMA on daily TF as possible.
FnO trade can also be taken
Happy Trading,
Thanks,
Stock-n-Shine

Cup and Handle Pattern in Finolex Industries on Weekly ChartFinolex Industries has making good chart pattern on Weekly time frame.
Buy (Half qty) at 235
Buy (Full qty) at 250
SL at 200
Target 1: 280
Target 2: 305
Target 3: 350

GODREJCP CUP N HANDLE PATTERNGodrej Consumer Products Limited is an Indian Multinational consumer goods company based in Mumbai, India. GCPL's products include soap, hair colourants, toiletries and liquid detergents.
It is one of leading FMCG firms in india as well as globally, their range of product mainly covers shampoo, hair colours, grooming kits.
1.5 billion people globally use Godrej products from soaps and hair care to home care and health every day.
We recently identify a cup n handle pattern in Godrej consumer products.
CMP: 1315
SL : 1270
T1 : 1390
T2. : 1400
T3 : 1440
Note : It is recommendation it is only for educational purpose

SASKEN - CUP AND HANDLE BREAKOUT WITH RETEST~ #SASKEN - Completed restest of C&H pattern breakout
~ Ready to make new Highs
~ Cup and Handle Breakout with retest
~ Long-term breakout
~ Looks good for positional trade
~ Next target could be 1835 , 2000, 2200
~ Weak Below - 1430
~ Duration 4 to 5 months

cup and handle pattern A cup and handle is a technical chartcup and handle pattern SL - 358
A cup and handle is a technical chart pattern that resembles a cup and handle where the cup is in the shape of a "u" and the handle has a slight downward drift. A cup and handle is considered a bullish signal extending an uptrend, and it is used to spot opportunities to go long.
