Ethereum Breakout UpdateETHEREUM AT A BREAKOUT POINT
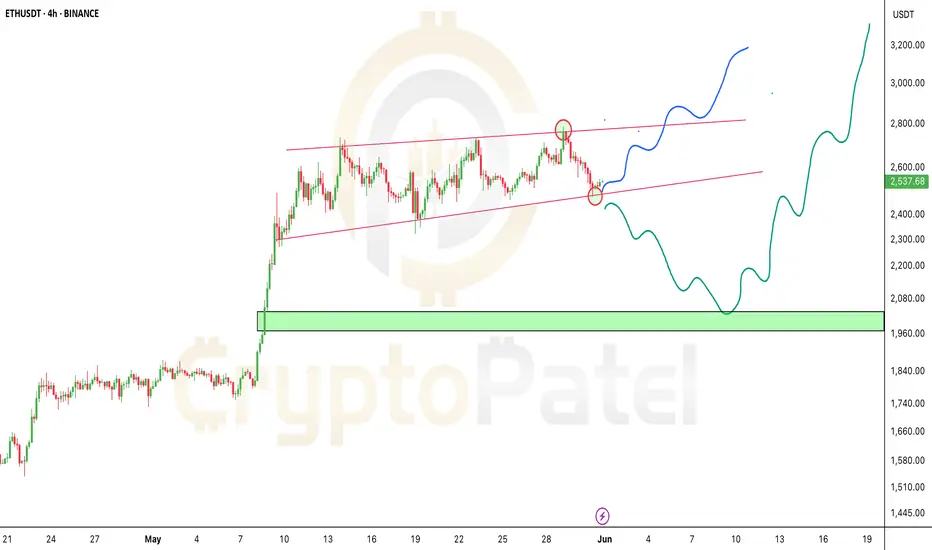
CRYPTOCAP:ETH is sitting right on its key trendline support. What happens next could be BIG!
🔵 If support holds → $3,000+ is coming!
🔻 If it breaks → ETH could dip to $2,000 before the next pump!
This is the moment where patience meets opportunity.
Don’t chase — wait for the move and ride the wave!
D-ETH
Ethereum Macro Chart Breakdown – Eyeing $10K+ Targets! Ethereum Macro Chart Breakdown – Eyeing $10K+ Targets!
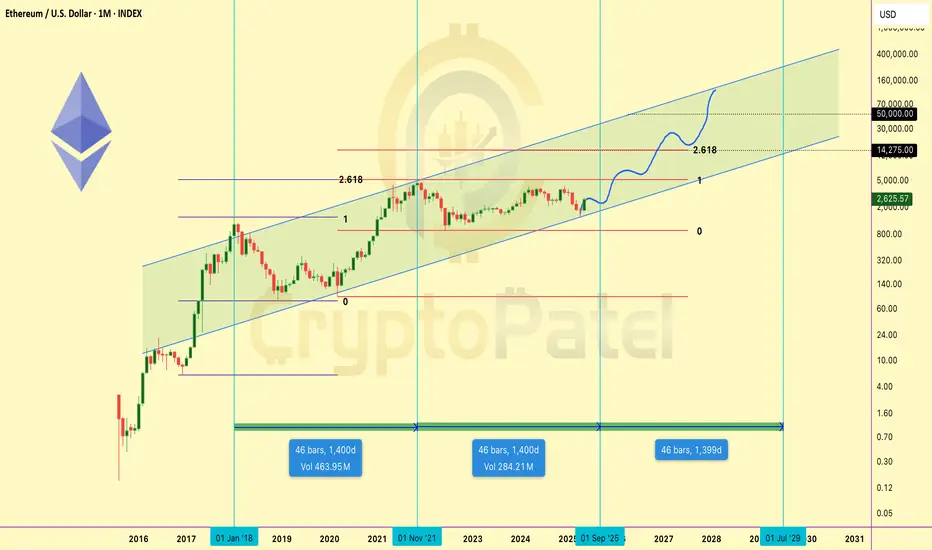
Let’s zoom out and look at the bigger picture for CRYPTOCAP:ETH – this isn't just a pump; it’s a potential parabolic supercycle forming.
Technical Outlook:
Fractal Pattern Analysis
Ethereum is following a similar macro-structure to its 2017–2021 cycle, where after a long consolidation and accumulation phase, it exploded nearly 30x from bottom to top.
Current price action mirrors the post-2019 structure, and we’re at the same breakout stage right now.
Fibonacci Projections
Using the Fibonacci extension from the previous bear market low to the bull market top, and applying the same ratio from the 2022 bottom:
🔹 1.618 Fib = ~$10,000
🔹 2.618 Fib = ~$14,000
These targets align with Q4 2025–Q1 2026, based on previous cycle timings.
Structural Support
ETH is now trading above its 100-week EMA and holding bullish structure on higher timeframes. Previous resistance at $2,500 has flipped into strong support.
Momentum & Fundamentals
🔹 Layer 2 scaling is booming (Arbitrum, Base, zkSync)
🔹 Institutional ETH ETFs are launching
🔹 ETH powers Web3, DeFi, AI infra, RWAs, and more
🔹 Ultra-sound money supply dynamics + staking yield
🔹 Ecosystem growth is organic and robust
Projected Targets:
🎯 Short/Mid-Term (Q4 2025): $10,000 – $14,000
🚀 Ultra Long-Term (2029–2030): $40,000 – $50,000
If you still believe ETH is “just another altcoin,” you’re missing the bigger picture. Ethereum isn’t a meme — it’s the backbone of digital value, smart contracts, and future finance.
I’m long and accumulating ETH on dips. This isn’t just a trade — it’s a conviction play.
🗨️ Drop your ETH target in the comments 👇
🔁 Share this with someone sleeping on ETH!
Note: This is NFA So DYOR
ALTCOIN SEASON LOADING🚨 ALTCOIN SEASON LOADING...
The ETH/BTC pair just gave a major bullish signal
✅ Up 45% in 1 month
✅ Reclaiming strength after long consolidation
✅ Leading the way for ALTCOINS to fly
This is not just bullish for Ethereum — it's even more bullish for other altcoins 👇
Short-term Retracement Expected:
I'm watching 0.022–0.020 BTC as a key accumulation zone on ETH/BTC
That’s the area where smart money will reload before the next leg up.
My Bull Run Target: 0.08 BTC per ETH
If we hit that, it’s time to start rotating profits from ETH into other alts.
Altseason isn’t coming...
It’s already warming up.

Is $WLD the Next 10x Altcoin This Bull Run? Is MIL:WLD the Next 10x Altcoin This Bull Run? 🚀
Based on the chart, this looks like a good time to start accumulating.
👉 My zone: $1.21–$1.00
👉 Bull target this cycle: $10
Strong bullish structure above $0.60 — but don’t forget: risk management is key.
#Altcoin #Worldcoin

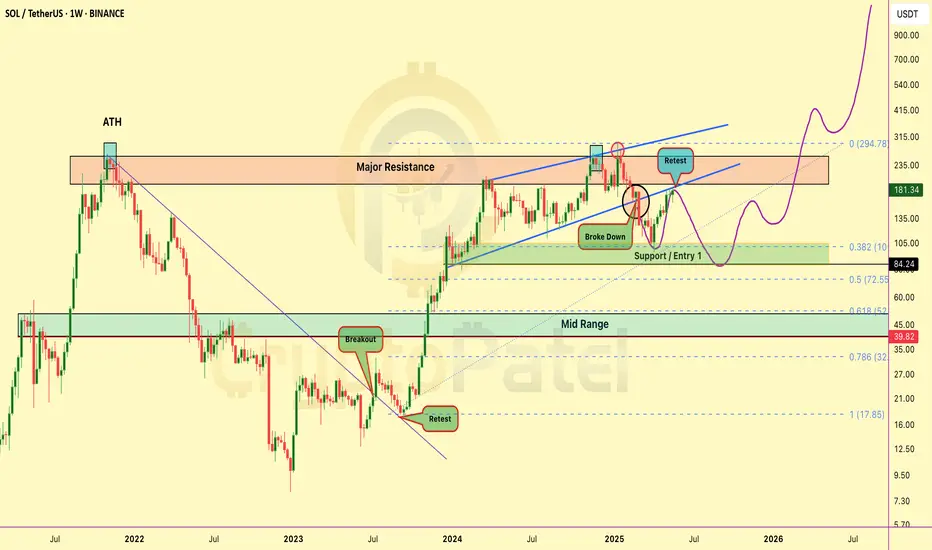
Bearish Setup Loading on Solana? Bearish Setup Loading on Solana? Watch This Key Level Closely
Solana just retested the breakdown zone after losing key support — currently sitting in a danger zone.
Short Interest Zone: $180 – $190
If this area holds as resistance, we could see another move below $150 soon.
Bearish Setup Invalidation: Break above $200 will flip this bias.
Long-Term View? I’m still super bullish on SOLANA in the bigger picture — my long-term target remains $1000 🚀
Risk Management is Key
Never trade without a STOP LOSS — protect your capital.
This is NOT financial advice — DYOR before investing.
Let the chart guide you, not emotions. Stay sharp.
Bitcoin Dumped form $111800 to $107800 so What next?🚨 Hope you caught the top short at that Bearish OB!
CRYPTOCAP:BTC dropped from $111.5K → $107.8K
Next Key Level: $105K
Hold = Bull Mode On 🟢
Break = Say Hello to < $100K again 😬
Reminder: Don’t gamble your hard-earned money. Trade smart.

ETHEREUM MEGA CYCLE ALERT🚨 ETHEREUM MEGA CYCLE ALERT 🚨
CRYPTOCAP:ETH just bounced from the same support zone that sparked its last bull run 🔥
This could be the start of Wave 5 — and if history repeats…
🎯 Target: $10,000 ETH
Last time this pattern showed up? ETH went 10x.
Don’t fade the chart.
👉 Like & Retweet if you’re riding this wave
👇 Tag a friend who’s still sleeping on ETH!

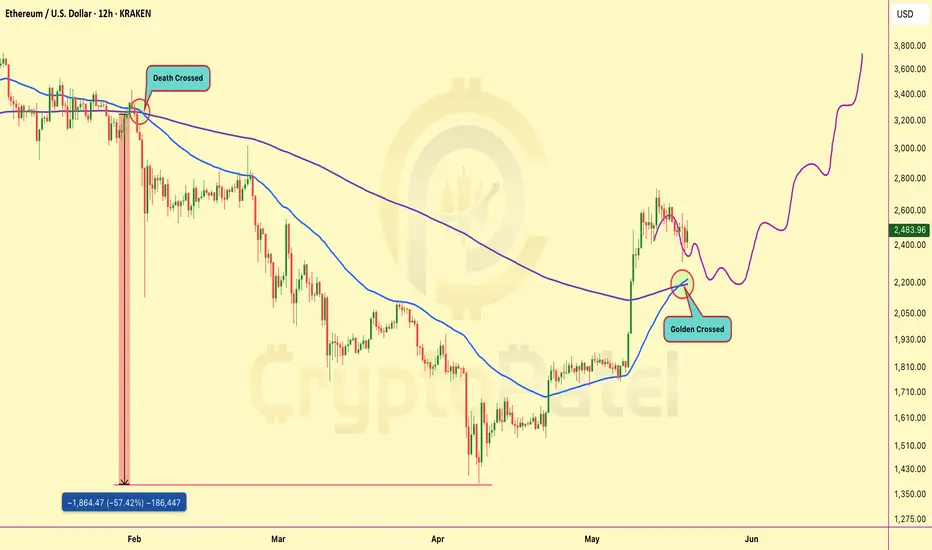
Ethereum Golden Crossed so What Next? $5000?🚨 CHART ALERT: CRYPTOCAP:ETH just flashed a GOLDEN CROSS on the 12H after months of bleeding!
Last time we saw a DEATH CROSS, #Ethereum crashed -57%.
Now it's doing the opposite — this could be the start of a massive pump! 🚀
TARGET? Maybe $3,800-$5000+ soon! 📈
$SEI to $2? Trump-backed + Institutional Buys = Next Altcoin NYSE:SEI to $2? Trump-backed + Institutional Buys = Next Altcoin Rocket!
#SEI already pumped +100% from our entry! Hope you enjoyed the ride.
But I’m still massively bullish on this setup.
▶️ Price is consolidating near strong support at $0.20–$0.14
▶️ This is a golden accumulation zone for the next leg up!
▶️ Backed by Trump’s Liberty Financial & multiple institutional buys
▶️ My targets for this bull run: $1 → $2 → $3 → $4
Still early. Still bullish. Still time.
Note: Not Financial Advice so Do your Own Research before investing.
#Altcoins

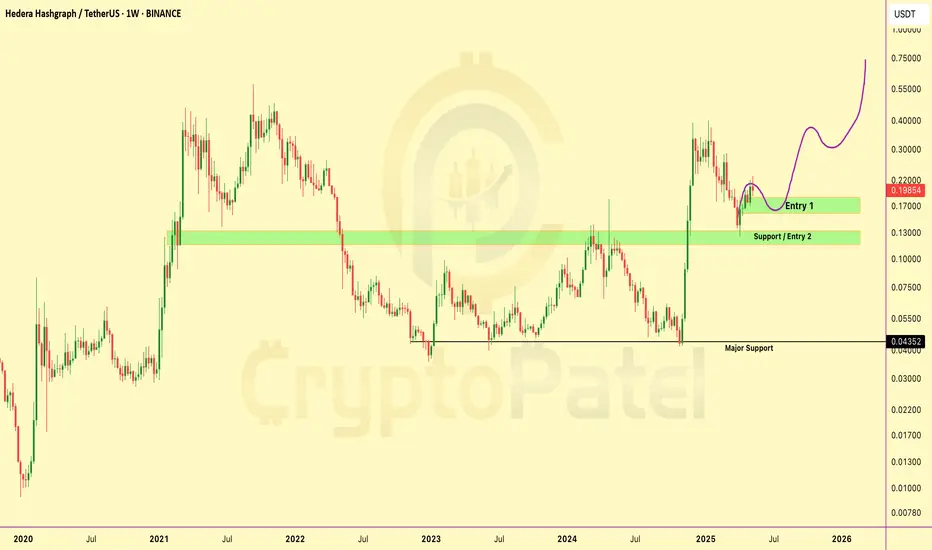
HBAR/USDT Chart Analysis and Price ProjectionMassive CRYPTOCAP:HBAR Rally Loading – Only If This Zone Holds!
Price is holding the critical support at $0.130 — a confirmed base here could trigger a major upside move toward $0.50–$1 🚀
▶️ Accumulation Zone: $0.180–$0.160
▶️ Invalid below $0.124
▶️ Above = ultra bullish structure in play!
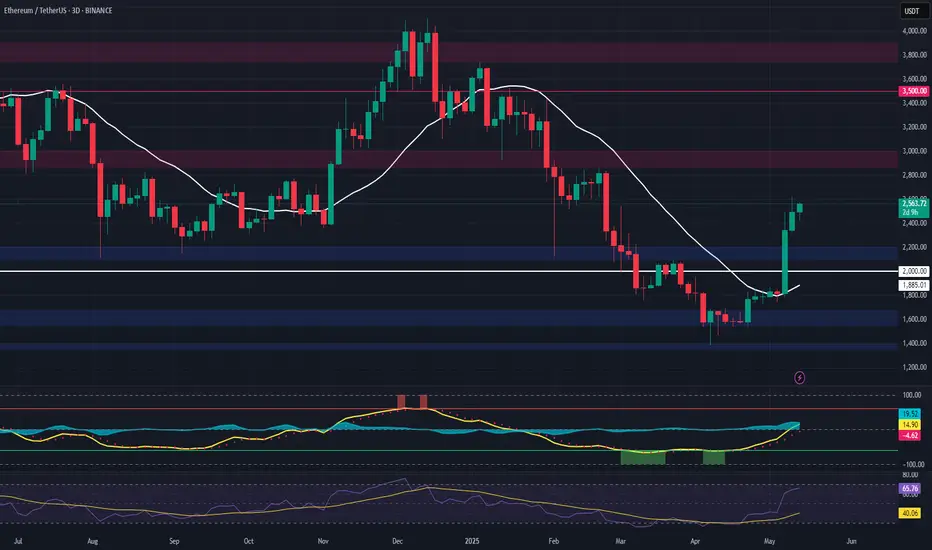
$ETH Pullback Loading: Is $1,800 the Next Big Buy Zone?Ethereum (ETH/USDT) Technical Outlook – Dip Analysis
After a strong bullish impulse breaking the downtrend, ETH is now entering a corrective phase.
Key Observation: Price has filled a major FVG (Fair Value Gap) near $2,500 and is showing signs of rejection.
🔻 Short-Term Bias: Bearish Retracement
We anticipate a pullback into the lower FVG zone between $1,854–$2,186, aligning with the +OB (Order Block) at ~$1,854-$1790 — a strong demand zone.
🟩 Buyers may step in here, making it a potential accumulation zone before the next leg up.
If this zone holds, ETH could resume its uptrend targeting the upper OB/FVG zone near $3,400–$3,600.
Strategy: Watch for bullish confirmation in the $1,800–$2,000 zone for potential long setups.

EOS Super bullish toward $10 because WLFI Buying$EOS/USDT Weekly Technical Breakdown
🔰 Price Action:
EOS is currently trading at $0.85, following a rejection from the key weekly resistance zone between $1.24–$1.31. This zone has acted as a historical supply area, and the failure to break above it has triggered a short-term corrective move.
🔰 Bullish Development:
EOS has recently broken out of a multi-year falling wedge pattern, signaling a potential long-term trend reversal. Post-breakout, the asset is now retesting lower levels — a common occurrence before continuation.
🔰 Key Demand Zones:
Primary Accumulation Zone: $0.83–$0.69
Major Weekly Support: $0.47–$0.40
These zones coincide with historical consolidation and low-volume nodes, making them ideal for long-term positioning.
🔰 Institutional Interest:
Trump-backed World Liberty Financial has accumulated 3.64M NYSE:EOS for 3M USDT, with an average entry at $0.824 — aligning perfectly with the current range. This reinforces the strength of the accumulation zone and may signal smart money inflow.
🔰 Upside Resistances to Monitor: $2.87 / $5.03 / $10.57 / ATH: $14.90
NYSE:EOS is showing signs of structural reversal on the HTF. As long as the price holds above the $0.69 base, bullish continuation remains valid. A reclaim and weekly close above $1.31 could trigger the next impulsive leg toward $5+.

Ethereum (ETH) – Early Recovery Setup After Liquidity SweepEthereum has printed a bullish deviation below key liquidity ($1,500) and reclaimed the 20-day EMA, flipping prior resistance into support — a classic signal of early reversal momentum.
We're now watching for a pullback into the $2,100–$2,200 demand zone to offer an optimal spot entry before a potential move into higher timeframe targets.
🔹 Entry Zone:
$2,100 – $2,200 (pullback into reclaimed support/demand)
🎯 Take Profit Targets:
🥇 $3,000
🥈 $3,500
🥉 $3,900
🛑 Stop Loss:
Close below $2,000 (to invalidate reclaim of structure)
BTC Bulls Must Defend $103K… Or Say Hello to $99K Again Bitcoin completed a clear 5-wave Elliott Impulse and is now forming an ascending wedge (abcde structure), typically hinting at a possible correction.
Key Levels to Watch:
🔴 Key Bull Level: $103,085 – must hold to maintain bullish structure
🟠 Support 1: $99,265 – breach = deeper pullback
🟡 Support 2: $95,965 – last stronghold for bulls
Outlook:
🔼 A breakout above the wedge = continuation toward $110K+
🔽 Breakdown below $103K = expect correction toward lower supports
Strategy:
➡️ Wait for confirmation. A wedge breakdown = potential short trade setup.
➡️ Breakout = bullish continuation. Always manage risk wisely.
Stay sharp, traders!

The Next Big L2 Gem? $ARB Is Breaking Out —Why It Could it 10x🚨 The Next Big L2 Gem? AMEX:ARB Is Breaking Out — Here's Why It Could 10x+ 🚨
🔰 What is Arbitrum?
Arbitrum is Ethereum’s top Layer-2 scaling solution using Optimistic Rollups.
It powers faster, cheaper transactions without compromising security.
🔰 Ecosystem Highlights
▶️ Arbitrum One – DeFi & dApps
▶️ Arbitrum Nova – Gaming & Social apps
▶️ Hosts major projects: Uniswap, Aave, GMX
▶️ Among the top L2s by TVL dominance
🔰 Tech & Innovation
▶️ Runs on fraud-proof optimistic rollups
▶️ Nitro upgrade boosted throughput + cut gas fees
▶️ Gives near-Ethereum experience with 10x lower costs
🔰 Tokenomics
▶️ Total Supply: 10B ARB
▶️ Airdrop: 1.162B (11.6%) to users & DAOs
▶️ Remaining: Treasury + future ecosystem rewards
➡️ Small circulating supply = potential supply squeeze on demand surge
🔰 Backers & Partnerships
▶️ Built by Offchain Labs
▶️ Investors: Lightspeed, Pantera, Coinbase Ventures
▶️ Listed on Binance, Coinbase, KuCoin
▶️ Integrated by top Ethereum protocols (Uniswap, etc.)
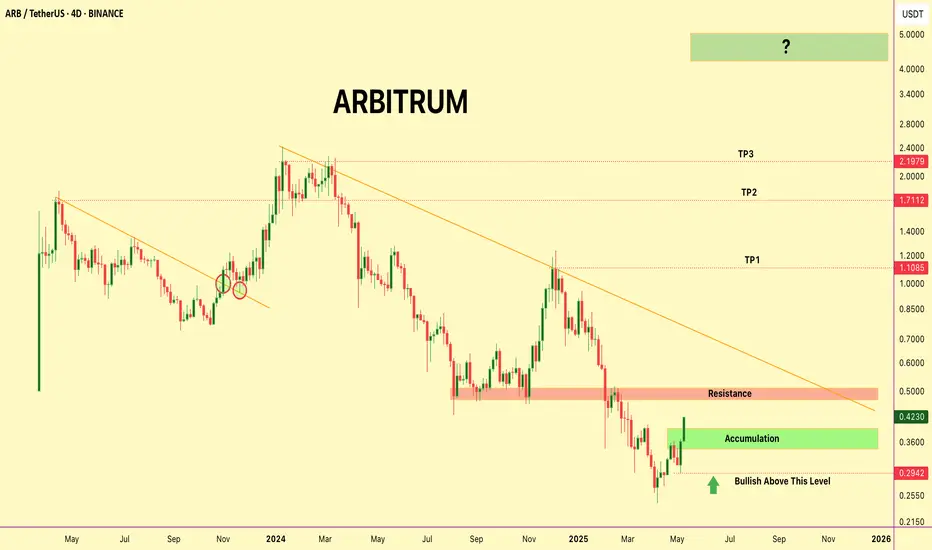
🔰 TECHNICAL BREAKDOWN: ARB/USDT HTF Chart
✅ Accumulation Zone: $0.29–$0.42
▶️ Above $0.4028 = momentum shift zone into Super Bullish
▶️ Next resistance: $0.48–$0.52 (watch for breakout!)
▶️ Targets: $1.10 / $1.71 / $2.19 / $5
⚠️ Hold above $0.2942 to keep setup valid
✅ Strong volume + higher lows = bullish confirmation
▶️ DYOR | NFA
🔰 Why 10x–50x Is Possible
▶️ Top Ethereum L2 by usage
▶️ Real utility, not meme hype
▶️ Limited unlocked supply = buyer advantage
▶️ L2 sector will explode if ETH demand grows
▶️ Could capture a huge chunk of ETH's scaling market
🔰 Final Take
▶️ AMEX:ARB is more than hype — it's infrastructure.
▶️ In a bull market, this is the kind of setup that runs hard.
▶️ Keep it tight on your watchlist.
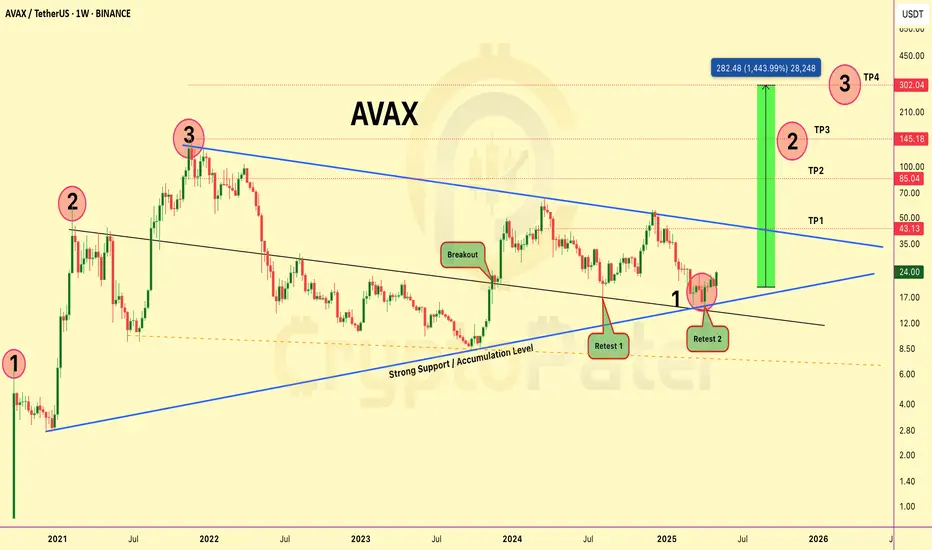
$AVAX Weekly Chart Update – Massive Breakout Brewing!🚨 CRYPTOCAP:AVAX Weekly Chart Update – Massive Breakout Brewing!
#AVAX is showing a textbook falling wedge breakout on the weekly timeframe, and the setup looks 🔥 for a potential 10x+ move!
Here’s what’s happening:
✅ Structure: Multi-year falling wedge since 2021
✅ Breakout: Confirmed in late 2023
✅ Retests: ✅ Retest 1 & ✅ Retest 2 both held perfectly
✅ Support Zone: Strong accumulation by big players
✅ Accumulation Zone: $24-$20 — still in early entry zone!
🔰 Targets: $43/$85/$145/$302+ (Cycle extension target)
▪️ Measured move suggests +1400% upside potential
▪️ This is one of those charts you don’t want to ignore. Accumulation is likely done. Smart money already positioned. Now it’s about patience and trend continuation.
Chart looks ready. Momentum building. Are you riding this AVAX train? 🚀
Ethereum Wyckoff Accumulation – Weekly Chart BreakdownEthereum Wyckoff Accumulation – Weekly Chart Breakdown
ETH is showing a textbook Wyckoff Accumulation pattern playing out on the 1W timeframe — and if it holds, we could be gearing up for a major breakout rally in the coming months.
Phase Breakdown:
✅ Phase A: Selling Climax (SC) marked the bottom. Automatic Rally (AR) set the resistance. Secondary Tests (ST) confirmed demand at lower levels.
✅ Phase B: Smart money accumulated heavily within the range — no directional move, just shakeouts and traps.
✅ Phase C: The Spring — price dipped below support to liquidate weak hands. Classic bear trap.
✅ Phase D (NOW): Recovery begins. If we see a Sign of Strength (SOS) above resistance with volume, Phase E (markup) is confirmed.
✅ Phase E: Full breakout mode. Higher highs, higher lows. Price discovery.
🟢 Accumulation Zone: $1,600–$1,300
🟢 Key Resistance: ~$3,600–$4,000
🟢 Projection Zone: $4,800 to $7,800+ (if SOS confirms)
✅ Bias: Bullish
Note: Watch for a clean breakout above the resistance zone. Low volume pullbacks = strength.
This is the kind of setup you don’t want to ignore.

Bitcoin At Big Resistance level so What Next?#BTC/USDT Update – Price at Critical Resistance
The chart structure remains unchanged from our previous update.
🔸 After entry, price dipped ~5% below our zone, but has now printed a strong bullish candle, signaling potential upside momentum.
🔸 However, Bitcoin is currently trading at the upper boundary of the ascending channel, acting as resistance.
Key Level to Watch:
If the HTF candle closes above $99,500, it will signal strength, and I’ll consider closing short positions and initiating fresh long setups.
Important Note:
The current pattern resembles a liquidity trap, not a clean bullish continuation. That’s why I remain cautious.
✅ Plan:
🔸 Wait for confirmation > $99,500
🔸 Use tight stop-loss – no blind trades.
Stay sharp, monitor price action closely.

Will Ethereum Break $1875 Resistance this Time?🚨 BREAKOUT WATCH: If Ethereum breaks above the key $1875 resistance, it opens the door for a bullish rally toward $3000 in the coming weeks.
Strong breakout = high momentum setup.

Bitcoin Ready to Dump Again till $85000?CRYPTOCAP:BTC just tapped a key Short POI near resistance!
Bears stepping in hard below $99,550 — this is prime sniper zone.
▶️ Trade Setup (SMC x ICT):
▶️ Entry: $93,800–94,200
▶️ Targets: $90,000 → $86,000
▶️ Stop Loss: $99,600 (above structure)
Liquidity swept ✅
FVGs below ✅
Momentum shifting ✅

Will Veracity Give 40x Return in Near Future?NASDAQ:VRA Targeting ATH Again – Potential for Huge Gains from Current Levels!
Weekly candle breaking major resistance at $0.0025. If price holds above this level, expect a strong upward move.
Potential Target: 40x from resistance if it hits the previous ATH!
Best Accumulation: FVG: $0.002183 - $0.001639
Perfect entry if price retraces to this level!

PLAN BUY ETH NEW WEEK✅ Scenario 1 – Buy at 1830 (Current Price):
Reason to Buy:
Price is close to the EMA 20 and EMA 33 levels – acting as dynamic support.
The 1830–1845 area has been tested multiple times without a clear breakdown.
The upward trendline from the 1720 low is still being respected.
The market may be forming a tight consolidation, preparing for a breakout.
Trading Plan:
Buy Entry: 1,830 USDT
Stop Loss (SL): below 1,800 (around 1,790–1,795)
Take Profit (TP): 1,980 – 2,150 (previous highs and major resistance zone)
Risk/Reward Ratio: Approximately 1:2.5 to 1:4 (excellent if breakout confirms)
⚠️ Scenario 2 – Buy at 1,740 (If Current Trendline Fails):
Reason to Buy:
The 1,740–1,760 zone is a strong support from the longer-term ascending trendline (black line).
Coincides with the EMA 200 on the 4H timeframe – a typical retracement zone during pullbacks.
Potential for a double-bottom pattern if price reacts positively here → forming a higher low.
Trading Plan:
Buy Entry: 1,740 USDT
Stop Loss (SL): below 1,700 (around 1,695)
Take Profit (TP): 1,920 – 2,000 – 2,150
Risk/Reward Ratio: Greater than 1:3 if ETH maintains its higher-low structure
🧠 Strategy Notes:
In both scenarios, ETH must break through the psychological resistance of 1,850–1,880 to confirm bullish momentum.
Volume during the current accumulation phase is relatively low, signaling a potential breakout waiting to happen – watch for large-volume candles on H4/H1.
The long red candle near 1,800 might have been a “bear trap” if the price doesn’t break below recent lows.

Will Ethereum hit $12000 in current Bull Market?CRYPTOCAP:ETH just confirmed a monthly hammer close — strongest bullish signal of 2025 so far.
Last similar structure led to a +60% rally.
Price action + volume = Strong reversal setup.
Bias: Long | Accumulation Phase Activated 🚀
Note: NFA & DYOR
