Will Ethereum hit $12000 in current Bull Market?CRYPTOCAP:ETH just confirmed a monthly hammer close — strongest bullish signal of 2025 so far.
Last similar structure led to a +60% rally.
Price action + volume = Strong reversal setup.
Bias: Long | Accumulation Phase Activated 🚀
Note: NFA & DYOR
D-ETH

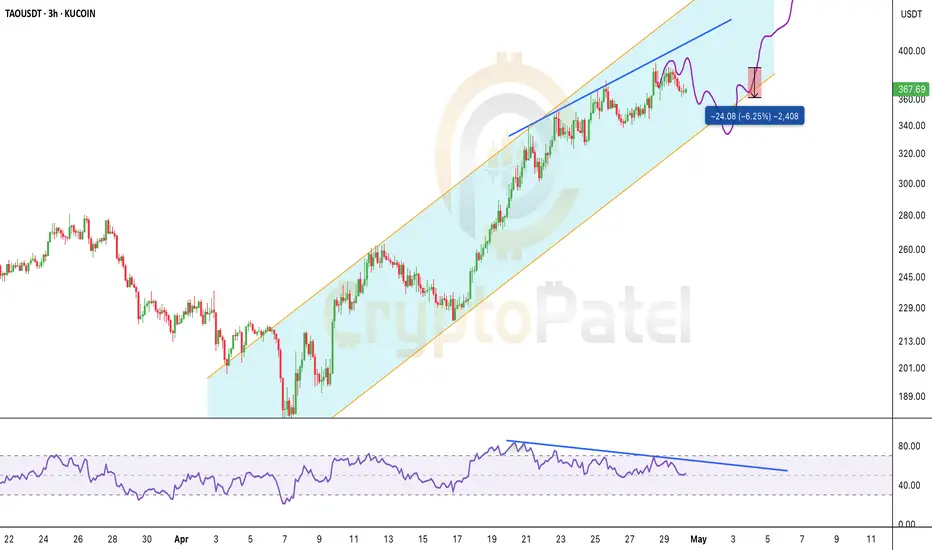
$TAO Update ( 6.20% Down From Our Entry)GETTEX:TAO Update ( 6.20% Down From Our Entry)
Short entry at $385 — triggered perfectly.
Price hit $386 before dropping — now down 6.2% from entry.
▶️ Bearish Divergence still valid
▶️ FVG rejection confirmed
▶️ Holding below $390 = bearish bias intact
Not financial advice — but never be greedy.
✅ Consider partial profits
🔁 Adjust SL to $400 from $410 if managing tighter risk
Let the setup work.
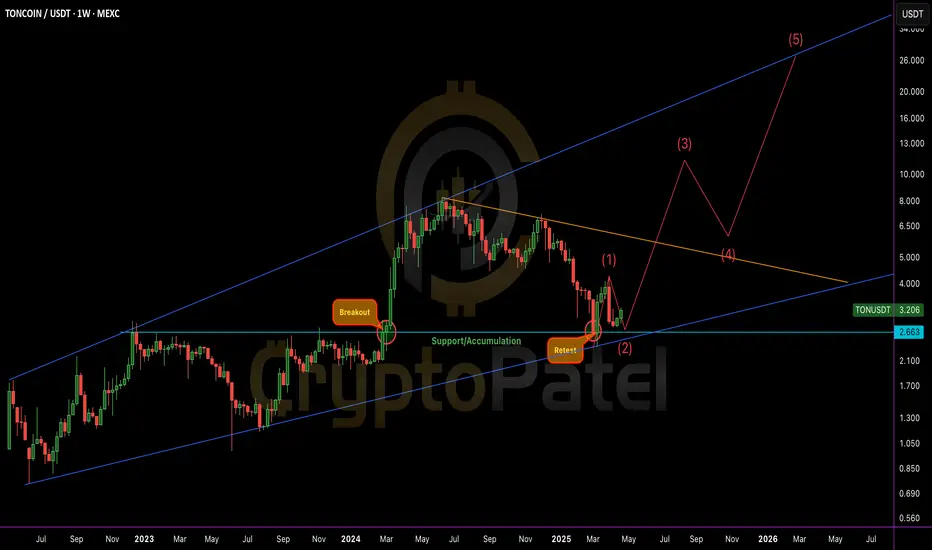
Accumulation Done. Retest Passed. Next: Moon Mode Activated!Accumulation Done. Retest Passed. Next: Moon Mode Activated! 🚀
#TONCOIN is shaping up beautifully! Here’s the full breakdown:
🔹 Breakout & Retest:
TON broke out of a major channel resistance last year around $2.66, followed by a clean retest at the same zone — confirming strong Support and Accumulation.
🔹 Current Structure:
After the successful retest at $2.66 (Support/Accumulation Zone), TON has started a fresh bullish structure.
Price is now building momentum above key dynamic trendlines.
🔹 Smart Money Concepts (SMC) Observation:
✅ Breaker Block (Accumulation Phase) confirmed at the $2.6–$2.7 zone.
✅ Classic Reclaim + Retest + Rally setup — typical Smart Money Accumulation behavior.
🔹 Inner Circle Trader (ICT) Concepts:
✅ Market Structure Shift (MSS) visible: from lower highs/lower lows ➔ shifting to higher highs and higher lows (bullish orderflow).
✅ Strong bullish Fair Value Gap (FVG) likely forming if TON pushes beyond the next local resistance (~$4).
🔹 Elliott Wave Theory Insight:
✅ Probable start of a 5-wave bullish impulsive move:
* Wave 1: Current push from retest zone.
* Wave 2: Minor correction expected.
* Wave 3: Parabolic rally (targeting $8–$10+).
* Wave 4 & 5: Following standard Elliott extensions.
🔹 Potential Targets (Mid to Long Term):
🎯 $5.00
🎯 $8.50
🎯 $13.00
🎯 $20-$50+ (in case of major altseason or BTC strength continuation)
🔹 Invalidation:
A confirmed weekly close below $2.30 would invalidate this bullish setup. Until then, dips are opportunities!
Summary:
TON looks primed for a major breakout continuation. Smart money seems to be accumulating heavily around the $2–$3 zone.
✅ Retest successful.
✅ Bullish structure confirmed.
✅ Massive upside potential.
🔔 Keep a close eye — TON might enter the "Next Big Move" phase soon!
Trade Recommendation – USDCAD Buy Position (30-Minute Chart)PAIR: USDCAD
TRADE TYPE: BUY
TIMEFRAME: 30-Minute (M30)
ANALYSIS TIME: 10:35 AM, April 25, 2025 (UTC+7)
STRATEGY: Trend-following + EMA33 (High/Low) + Pullback Signal
✅ Trade Setup:
Entry: BUY around 1.3865
Stop Loss (SL): 1.3838
Take Profit (TP): 1.3957
Risk-Reward Ratio: 1:3.2 (high reward-to-risk setup)
🔍 Technical Analysis:
Short-term trend: Price is in a mild uptrend, forming higher lows.
EMA 33 (High/Low): Price is hovering near EMA33, showing a potential pullback bounce.
Price Structure: After a short-term correction, USDCAD is consolidating and showing signs of a potential breakout above recent highs.
Volume: Increased buying volume during bullish moves indicates strong buying interest.
📌 Trade Management Tips:
Hold the position if price breaks above 1.3885 with strong volume.
Consider trailing stop or move SL to breakeven once price hits 1.3900.
This setup is suitable for short-term swing trading within M30–H1 timeframe.

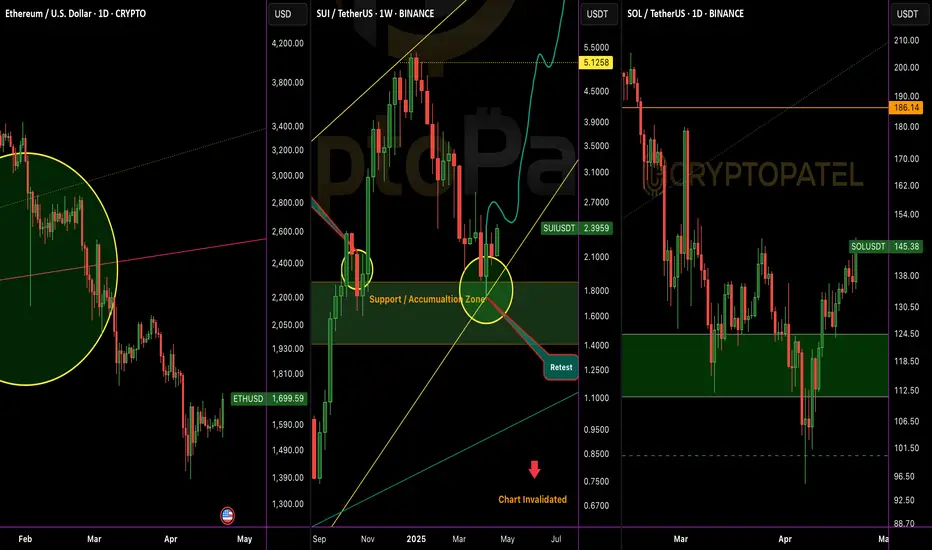
Bitcoin And Altcoins Price Difference🚨 2 months ago, #Bitcoin hit $90K and alts were flying:
CRYPTOCAP:ETH – $2,850
CRYPTOCAP:SUI – $3.50
CRYPTOCAP:SOL – $180
Today, BTC is BACK above $90K… but alts are in the dip!
CRYPTOCAP:ETH – $1,700
CRYPTOCAP:SUI – $2.40
CRYPTOCAP:SOL – $145
Never Forget to Buy at F*** Dip you Planning for Long Run
ETH/USD BUY Recommendation 1620-1625 – April 21, 2025🔔 ETH/USD BUY Recommendation – April 21, 2025
(Based on short-term technical analysis)
📌 Current Price: 1,625 USD
✅ Entry Zone: Around 1,625 – 1,618 USD
🔰 Stop Loss: Below the strong support zone at 1,608 USD
🎯 Take Profit Target 1: 1,774 USD
🎯 Take Profit Target 2: 1,826 USD
📈 Risk:Reward Ratio: Approximately 4:1 – 5:1
🧠 Technical Analysis:
ETH has broken above the 50 and 100 Moving Averages, signaling a bullish momentum after a consolidation phase.
The breakout candle on April 21 was supported by a strong spike in volume, confirming renewed buying interest.
The 1,618 – 1,608 USD zone is a key support area and previous local bottom.
The 200 MA (black curve) is still sloping downward but remains at a safe distance, allowing room for short-term upside.
📣 Trading Strategy:
Traders may consider opening a Long position around 1,618 – 1,625 USD, targeting the resistance zones at 1,774 USD and potentially 1,826 USD.
Apply strict risk management; avoid risking more than 2% of your portfolio on a single trade.
⚠️ Note: The crypto market is highly volatile — stay updated to adjust your trading plan. This is best suited for short-term Swing Trading over 3–5 days.
FL me now! Gook Luck!

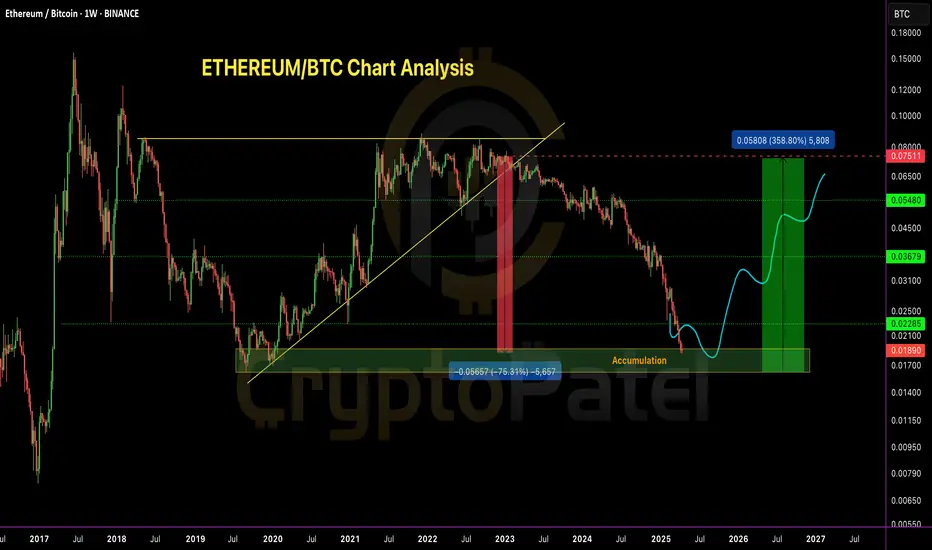
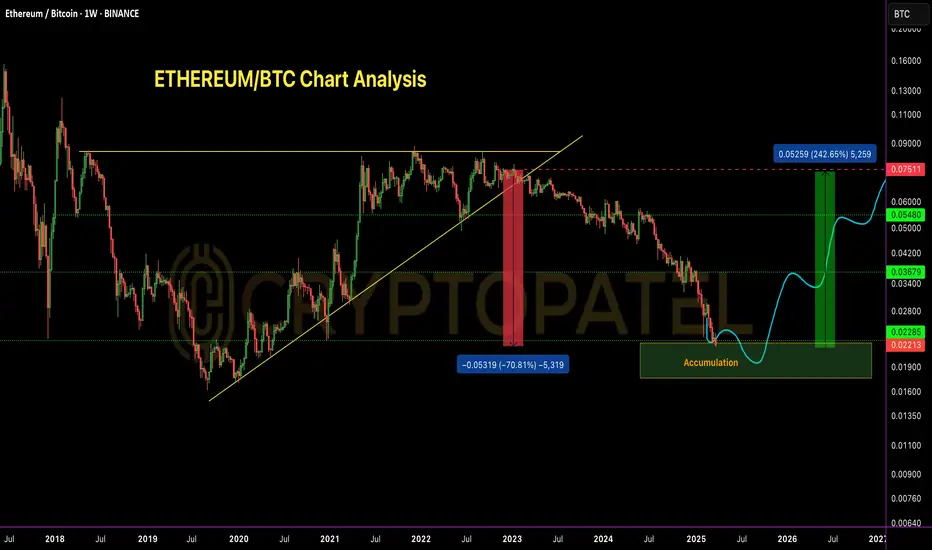
ETH/BTC Profit Update – As Predicted! ( 75% Down From Level )ETH/BTC Profit Update – As Predicted!
Many was Laughing But ETH/BTC is now down 75% from my previous exit call at 0.075 BTC — hope you enjoyed the ride and took profits when it mattered ✅
Current Price: ~0.019 BTC
We are now entering a strong accumulation zone between 0.019–0.015 BTC.
What to do now?
Start accumulating ETH slowly — build a position by buying dips to get a solid average entry for the next cycle.
Bull Market Targets: 0.05 BTC/0.07 BTC/0.09 BTC
Pro tip : Keep these Targets in mind not just for ETH/BTC… but also to plan exits on ETH/USDT during altseason!
This zone could be a game-changer. Act smart. Accumulate patiently.
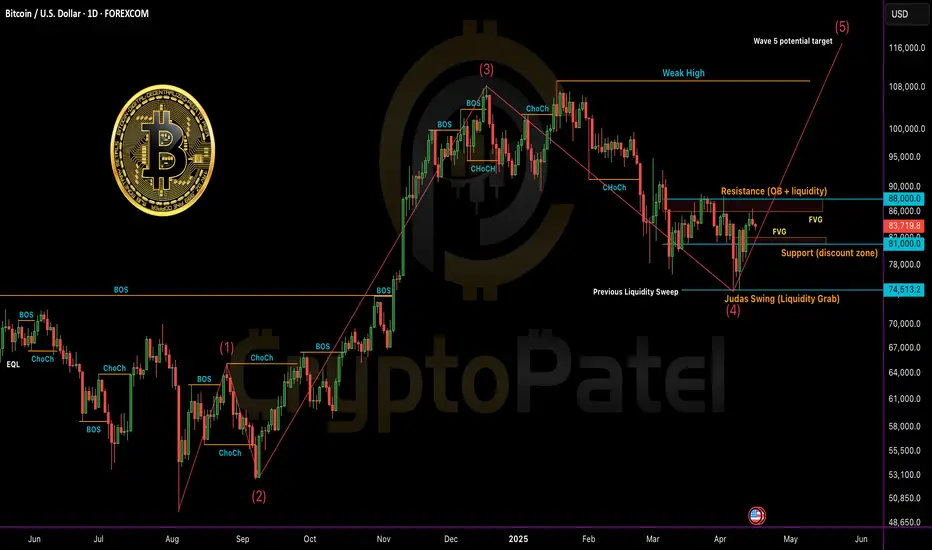
Bitcoin (BTC/USDT) – Full Technical Breakdown - Timeframe: 1DBitcoin (BTC/USDT) – Full Technical Breakdown - Timeframe: 1D
Market Structure & SMC (Smart Money Concepts)
✅ CHoCH (Change of Character) confirmed from $105K top → current lower high around FWB:88K zone.
📉 Break of Structure (BOS) to the downside occurred at $91K.
🟠 Bearish Order Block (OB): $86K– FWB:88K (price currently reacting here).
Liquidity Levels:
Sell-side: Swept at $76K
Buy-side: Sitting above FWB:88K
Fair Value Gap (FVG): Unfilled zone between $81K– GETTEX:82K may act as magnet for price.
ICT Model Alignment
Judas Swing: Sharp liquidity grab below $76K → followed by rebound — classic manipulation before real move.
PD Array Setup:
Resistance: FWB:88K (bearish OB + buy-side liquidity)
Support: $81K (discount zone + FVG)
Elliott Wave Outlook
Wave 1: July–Sept 2024
Wave 3: Nov–Feb rally to $105K (extended wave)
Wave 4: Correction to $76K likely complete
Wave 5 Target: Potential $115K+ if structure holds
Fractal Observation
🔹 Current price structure is mimicking Nov 2023–Jan 2024 pattern
🔹 If history rhymes: consolidation → breakout → retest → parabolic rally
Key Levels to Watch
🔼 Bullish Confirmation: Daily close above FWB:88K → targeting GETTEX:92K –$100K
🔽 Bearish Rejection: Drop below $81K → next support at $74K–$76K
Strategy Summary
🔹 Short-Term Bias: Cautiously Bullish
🔹 Entry Zone: Retest near GETTEX:82K (FVG + OB)
🔹 SL: Below $79.5K
🔹 TP Zones: FWB:88K → GETTEX:92K → GETTEX:98K
📈 R:R = Minimum 1:5 (High confluence)
Keep your eyes on HTF closures and manage risk. Liquidity traps are in play.
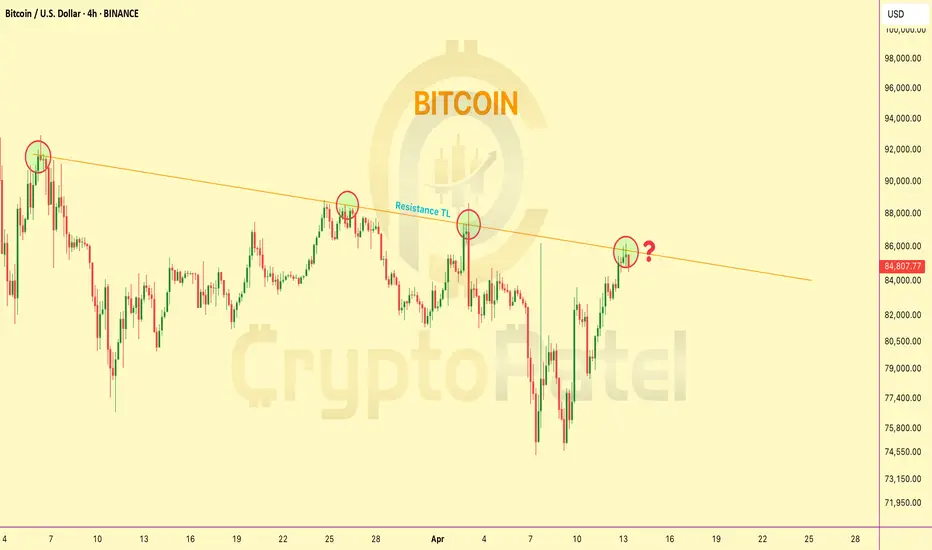
Bitcoin trading at Resistance level so What Next?🚨 Bitcoin 4H Chart Update
CRYPTOCAP:BTC is now trading right at the trendline resistance on the 4H chart
So what’s next?
1️⃣ Breakout and blast toward $100K?
2️⃣ Or another rejection down below $70K?
The decision point is HERE.
This breakout could change the game.
👇 Drop your thoughts –
Trade Idea: BUY GOLD (XAUUSD) at 2,993 – Target 3,035🔍 Technical Analysis (1H Chart):
Strong support zone at 2,993 – 2,984 USD:
This area has held well multiple times in recent sessions.
Confluence with the EMA33 low (2,998 USD) acting as dynamic support.
Price previously rebounded from this zone with a noticeable increase in volume.
Structure:
After a pullback to 2,993, the price rebounded to 3,017, indicating bullish demand.
A retracement back to 2,993 would offer a good entry point for a trend continuation buy.
Resistance / Profit Target at 3,035 USD:
This is the most recent local high and aligns with the downtrend line and higher EMA levels.
If price breaks above 3,035, the next potential target zone would be around 3,045–3,050 USD.
🧾 Trade Setup:
Entry: Buy Limit @ 2,993 USD
Stop Loss: Below 2,984 USD
Take Profit:
TP1: 3,031 – 3,033 USD (minor resistance)
TP2: 3,035 USD (major resistance)
🎯 Risk-to-Reward Ratio (R:R): ~1.8 to 2.5 – suitable for intraday or short swing trade setups.
⚠️ Risk Management Tips:
If price doesn't pull back to 2,993 and breaks 3,035 directly, wait for a retest of 3,031 for a breakout-entry strategy.
Keep an eye on upcoming U.S. economic news or Fed events, which could bring volatility.
Adjust stop-loss or secure partial profits during U.S. session for safety.

The Market Looks Brutal Right Now... But Stay With MeThe Market Looks Brutal Right Now... But Stay With Me
It feels like a bloodbath out there… but here’s the truth:
A fast and brutal dump is honestly better than a slow, painful bleed. It shakes out the weak hands quickly—and sets the stage for stronger recoveries.
We've seen this movie before:
▪️ The Covid flash crash
▪️ War shocks like Russia vs Ukraine
▪️ Black swan events like FTX blowing up
▪️ The chaos of the LUNA death spiral
➡️ Each time, fear dominated the feed.
➡️ Each time, the "This time it's different!" crowd got louder.
➡️ And each time, those who stayed calm and DCA’d into real projects walked away with massive wins.
So why should this time—just because of tariffs or macro FUD—be any different?
It’s not.
Zoom out.
The long-term trend is built on strong fundamentals, not headlines.
Stick to the plan: accumulate multi-cycle, high-cap coins. Ride the wave.
The short-term noise fades, but smart strategy compounds.

Ethereum Still down from 2018 ATHIf you had invested in Ethereum exactly 7 years ago (2,646 days),
you would be at a 7.5% loss at today’s lowest price. 😳
Yes, even ETH — one of the biggest and strongest cryptos — is down.
That’s how tough the market is right now. 🩸

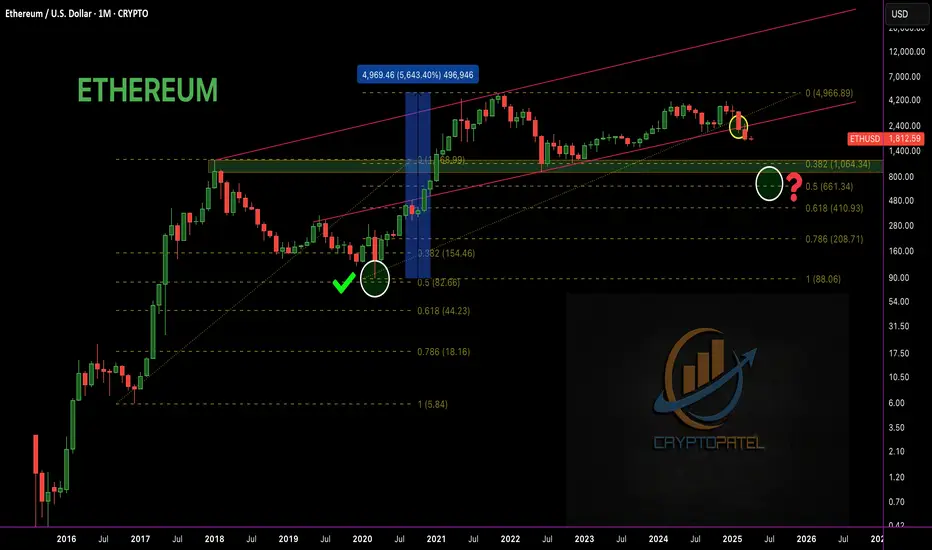
Will $ETH Drop Below $1,000 Before Heading to $7,000+? Will CRYPTOCAP:ETH Drop Below $1,000 Before Heading to $7,000+?
🟣 Historically, #ETH respected the 0.5 Fib retracement in bull markets – In the last bull run, ETH retraced to 0.5 Fib at $89 — then exploded to $4,867
🟣 That’s +56,000% in just 1.5 years!
This cycle, the 0.5 Fib level sits around $661. With the monthly trendline breakdown, the big question is:
Will #Ethereum dip below $1,000 and test $700 before making a new ATH?
If ETH reaches sub-$1,000 zones, I'm personally buying heavy and holding for 1–2 years. No FA – just Fib, patience & conviction.
ETH will reward those who ride the wave, not fear the dip.
Hold strong. Next 1–2 years = massive opportunity.
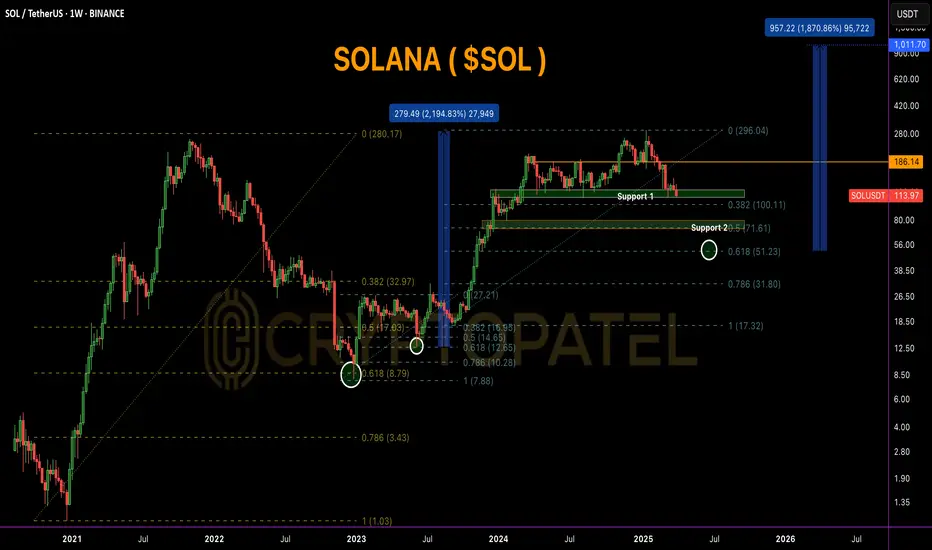
SOLANA Weekly Chart Breakdown–2020 Fractal Signals Massive Bull#SOLANA Weekly Chart Breakdown – 2020 Fractal Signals Massive Rally Ahead!
CRYPTOCAP:SOL is trading at $114.35, currently sitting on a key Fibonacci 0.382 support zone ($100–$115). This area has historically acted as a strong bounce level and is perfect for early accumulation.
If this zone fails, the next major support is the golden pocket ($50–$72) — also marked as Support 2, aligning with the 0.618 Fib retracement.
Historically, this level triggered a 2,100% rally back in 2020-21. If this fractal pattern repeats, we could be looking at a future target near $1,000+.
Breakout level to watch:
▪️ $186 = Bullish confirmation
▪️ $296 = Previous ATH
▪️ $1,011 = Fibonacci-based bull cycle target
Accumulation Plan:
▪️ Zone 1: $100–$115 → Light spot entries
▪️ Zone 2: $50–$72 → Heavy long-term accumulation
✅ Holding above $100 keeps the bullish structure intact.
✅ Break above $186 = start of the next bull wave.
Smart accumulation now can lead to 10x+ returns in the upcoming cycle!
It's All About SO/USDT Overview.
Bitcoin Short played out perfectly and Down 7%Bitcoin Short played out perfectly.
Price respected the SMC chart structure — 4H candle failed to close above FVG + -OB zone.
Post Trump Tariff news, market triggered high-leverage stop hunts with a fake pump before a sharp dump.
📉 Entry: $88,440 ✅
📈 Exit: $82,200 ✅
✅ ~7% move captured. Trade closed in profit.

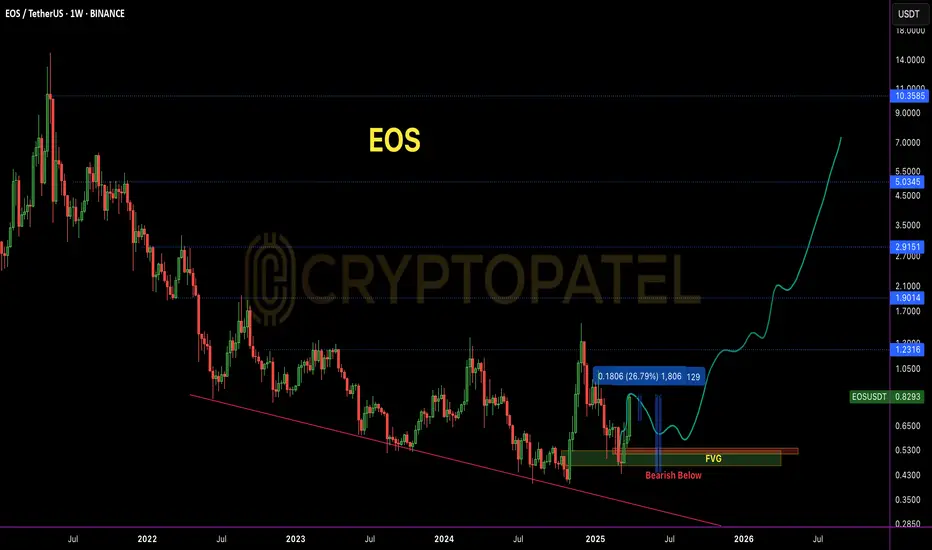
EOS Broke Out After Months — But Is This Just the Beginning?NYSE:EOS Broke Out After Months — But Is This Just the Beginning?
#EOS was once a top-tier asset, trading above $15. However, due to consistent development delays and unmet commitments, the price structure gradually broke down, eventually bottoming near the $0.40 zone — a key historical demand area.
Recent Development: EOS witnessed a sharp rally of +94% in the last month, with a strong +26% daily candle, backed by bullish news:
✅ Formation of Vaulta Banking Advisory Council (includes ex-Binance Canada CEO)
✅ CMO Tristan Dickinson teased a major upcoming announcement
Current Market Structure:
▶️ Price broke out of a long-term accumulation range
▶️ Volume spike confirms genuine interest
▶️ However, one FVG (Fair Value Gap) is still unfilled between $0.60–$0.50 zone on the 4H chart
Ideal Entry Zone (Pullback Play):
▶️ Watch for a retest near $0.60–$0.50
▶️ FVG fill + potential bullish OB (Order Block) = Confluence zone for long setups
🛑 Invalidation / Stop-Loss:
▶️ Breakdown below $0.43 on high volume will invalidate the structure
▶️ SL is wide, but RR (Risk-Reward) setup is favorable for swing traders
Long-Term Upside Targets:
First target: $0.95–$1.10 (range high breakout)
Mid-term target: $1.45+
Long-term potential if fundamentals sustain
⚠️ Manage your position size. NFA | DYOR | Risk Management is Key
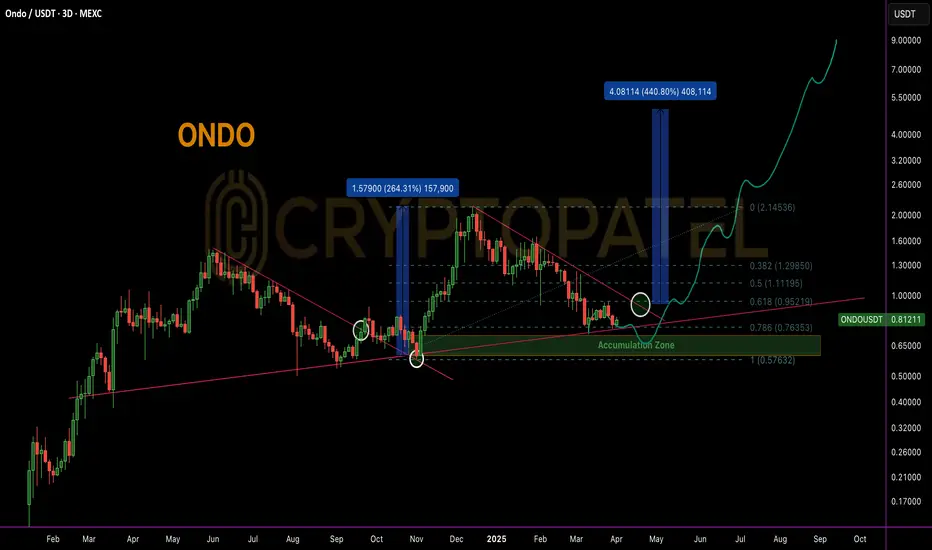
$ONDO Near Golden Entry Zone: Is $ONDO Ready for a 5x Move?LSE:ONDO Technical Analysis & Bull Market Outlook
LSE:ONDO is currently trading near a key accumulation zone, aligning with the 0.786 Fibonacci retracement level, which historically signals a high-probability bounce area in strong trending markets.
Accumulation Strategy
Ideal accumulation zone lies between $0.80 - $0.60. DCA (Dollar-Cost Averaging) approach recommended on major dips for optimal positioning before the breakout confirmation.
Historical Breakout Behavior
In the last HTF (High Time Frame) breakout, ONDO delivered a +200% move post-breakout. Based on current consolidation and market structure, a potential 400%-500% upside is anticipated if similar breakout structure plays out.
Upside Targets in Bull Case: $2/$5/$10
Why Still Bullish?
* Clean structure on daily and 4H TFs.
* Strong demand near 0.786 FIB.
* Institutional interest confirmed:
Trump’s World Liberty Finance acquired 342,002 LSE:ONDO , investing $505,218 at an average entry of ~$1.47 — current price is trading ~45% lower, indicating strong long-term conviction.
Not financial advice. Strictly TA-based view. Manage risk accordingly.
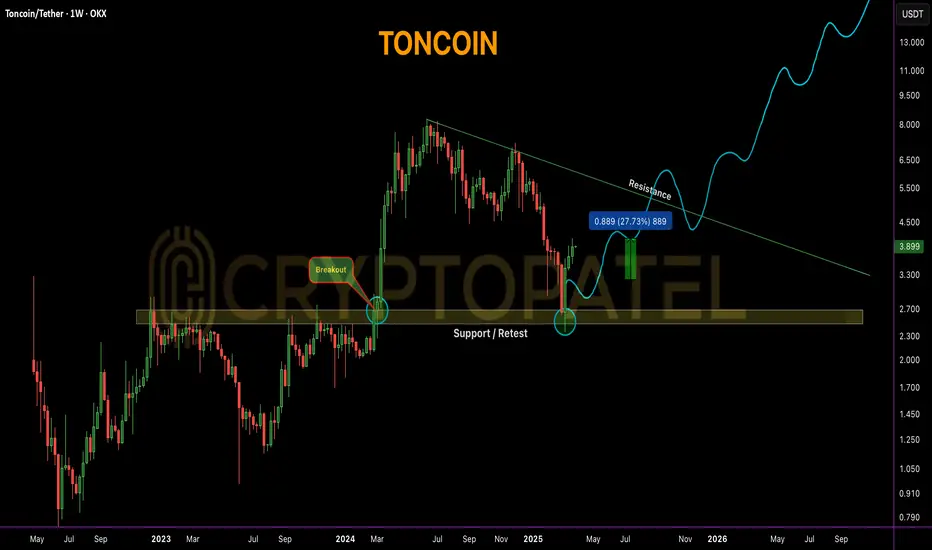
$TON Alert: FVG, Accumulation Range & Bullish Roadmap ExplainedCRYPTOCAP:TON Traders Alert: FVG Zone, Accumulation Range & Bullish Roadmap Explained!
#TONCOIN is currently trading around $3.90, up +27% from our earlier entry near $3.20.
🔹 Scalpers may consider booking partial profits at current levels due to short-term resistance zones.
Key Levels:
🔹 Support: $2.50, $2.95–$3.33 (FVG zone), $2.50 (major demand zone)
🔹 Resistance: $4.15 – $4.50 (next breakout levels)
FVG Zone (Daily TF): $3.33 – $2.95
If price revisits this imbalance zone, it may offer a high-probability entry opportunity.
Long-Term View: As the native token of Telegram’s TON blockchain, #TON has strong utility. If adoption continues, potential upside targets could be:
Targets: Mid-Term: $10+ | Long-Term: $50 – $100
Accumulation Zone (for long-term investors): $3.50 – $2.50
Price bounced strongly from $2.50, confirming it as a solid base.
⚠️ This is not financial advice. Always DYOR before investing.
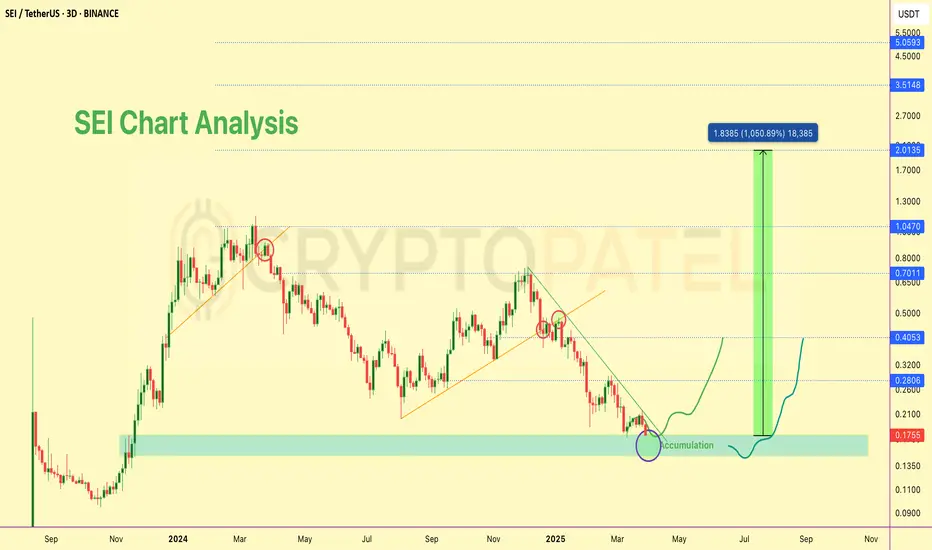
$SEI/USDT- Long-Term Technical Setup and $5 Potential in BullRun📊 $SEI/USDT – Long-Term Technical Setup
NYSE:SEI is holding strong at the $0.18 support zone, showing early signs of accumulation. This level has historically acted as a demand area, making it a key zone to watch.
🔹 Structure: Forming higher lows – bullish trend intact
🔹 Volume: Accumulation pressure building
🔹 Sentiment: Backed by large-scale buyers (e.g., Trump’s World Liberty)
📈 Long-Term Targets:
➡️ $0.45 → $1.00 → $2 / $3 / $5 (macro targets similar to CRYPTOCAP:SUI )
🛑 Invalidation: Close below $0.15
⚠️ Not financial advice. DYOR.
#SEI #CryptoTA #Altcoins #DYOR #TechnicalAnalysis
ETH/BTC – 70% Drop Achieved | Perfect Short ExecutionETH/BTC – 70% Drop Achieved | Perfect Short Execution
As projected in my analysis dated 10th Nov 2022, ETH/BTC has completed the anticipated 70% correction from the top.
Short Entry: 0.075 BTC ✅
TP1: 0.055 BTC – ✅
TP2: 0.037 BTC – ✅
TP3: 0.023 BTC – ✅
All targets achieved with precision.
Bearish structure played out as expected.
Current Outlook:
CRYPTOCAP:ETH Price has now entered a historical demand zone, coinciding with major multi-year support levels.
Accumulation Phase Activated –
Starting to scale into long positions from current levels, targeting mid-to-long term reversal setup.
Patience required – this could be the base of the next macro leg up.
Note: NFA & DYOR
#Ethereum
#Ethereum Is Down Now, But History Says a $10K Rally Is Coming…#Ethereum Is Down Now, But History Says a $10K Rally Is Coming…
1⃣ CRYPTOCAP:ETH rallied 228x post-2016 BTC halving
2⃣ ETH did 27x post-2020 halving
3⃣ Currently -57% from ATH post-2024 halving
📅 Projection: Q4 2025 ATH
🔼 Target Range: $7,000 - $10,000
Based on cyclical trend extension, Fibonacci macro structure, and historical BTC-ETH correlation.
What’s your ETH EOY 2025 target? RT & Comments if you Agree👇
#Altseason
Note: This is Not financial Advice so DYOR before Investing.

$ETH has dropped -40% since Eric Trump recommended buying it.JUST IN : CRYPTOCAP:ETH has dropped -40% since Eric Trump recommended buying it.
Just a gentle reminder to always DYOR (Do Your Own Research) before making investment decisions.
#Ethereum

Will Ethereum Drop below $1000 or Hit $10,000 in This Bull Run?One Golden Rule in Trading: Always buy the dip on fundamentally strong projects with 5x–10x potential in the near future.
Patience + conviction = profits.
#Ethereum CRYPTOCAP:ETH
