#BTCUSDWhat’s Next in Bitcoin? 🚀💡
After completing its 5-wave bull run 📈, Bitcoin entered a corrective phase starting on October 3, 2025, which recently completed its A wave on February 5, 2026.
🔍 Breaking down the A wave:
1️⃣ Wave 1: Low formed on October 11
2️⃣ Wave 2: Flat correction completed on October 30
3️⃣ Wave 3: Sharp decline to $80K on November 21 ⚠️
4️⃣ Wave 4: Flat correction rebound, completed on January 13, 2026 🔄
5️⃣ Wave 5: Final drawdown to $60K 💥📉
✨ What’s next?
Bitcoin is now poised to enter its B wave, a classic ABC 3-wave structure:
⚡ Initial bounce: sharp and fast
⏳ Followed by grinding upward momentum
🎯 Potential target: $95K zone
💬 This corrective rally will be crucial in shaping sentiment, positioning traders, and setting the stage for the larger C wave. Stay alert, watch the signals 👀, and prepare for volatility ahead 🌊.
D-US30

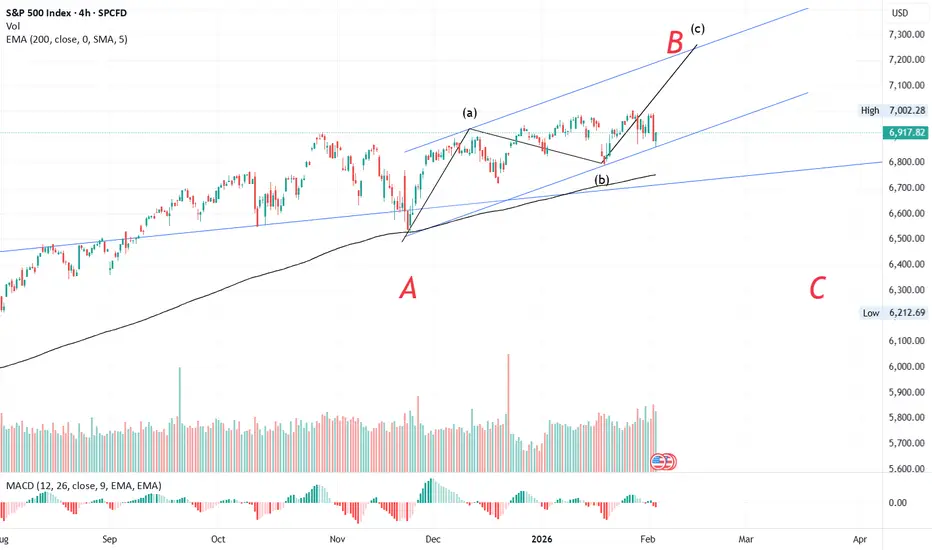
#S&P📊 S&P 500 Wave Analysis Update
The S&P began its corrective phase on 29 Oct 2025, forming its A wave by 21 Nov 2025. From there, the index rallied into its B wave, retracing more than 61.8%, which signals the development of a flat correction.
Breaking down the B wave:
- The a wave formed on 5 Dec 2025.
- The subsequent b wave retraced less than 61.8%, indicating a zig-zag structure.
- This sets the stage for the c wave, which has the potential to extend towards the 7200–7300 zone.

TRADE SETUP US 30 short positions can be taken near upper rectangle zone marked with red arrows and long can be tried near lower rectangle near green arrows with sl above or below marked zones

GBPUSD - 15M (IDEA)FOREXCOM:GBPUSD
Hello traders , here is the full multi time frame analysis for this pair, let me know in the comment section below if you have any questions, the entry will be taken only if all rules of the strategies will be satisfied. wait for more Smart Money to develop before taking any position . I suggest you keep this pair on your watchlist and see if the rules of your strategy are satisfied...
Keep trading
Hustle hard
Markets can be Unpredictable, research before trading.
Disclaimer: This trade idea is based on Smart money concept and is for informational purposes only. Trading involves risks; seek professional advice before making any financial decisions. Informational only!!!

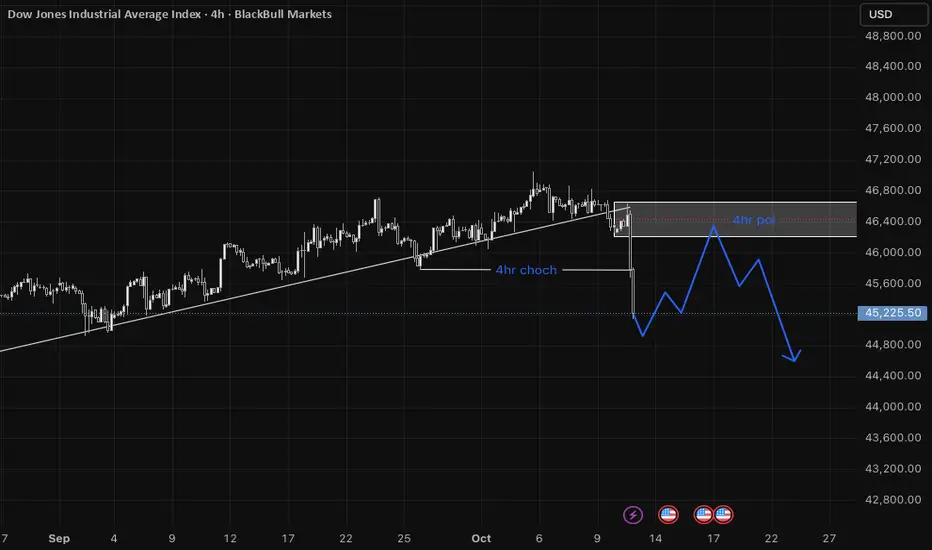
US30 | 4H–15M Bearish Confluence SetupPrice has displayed a Change of Character (ChoCH) on the 4-hour timeframe, breaking the existing bullish trendline and leaving behind a 4H imbalance. This shift indicates potential weakness in the prevailing bullish structure.
I’ll be waiting for price to retrace into the 4H imbalance zone and establish a bearish Change of Character on the 15-minute timeframe, ideally accompanied by the formation of a Fair Value Gap (FVG) or minor imbalance.
Once the 15M imbalance is retested and a bearish candlestick pattern confirms order flow alignment, a short position can be considered after a break below the low of that bearish pattern.
This setup aligns multiple timeframe confluences, reflecting a potential shift in market structure from bullish to bearish.
US30 – Rising Wedge on Thin Ice ! The Dow has been pushing higher for weeks, but the structure it’s building isn’t the most comfortable for bulls. Right now, price is sitting inside a rising wedge — a pattern that often looks strong until momentum fades and it breaks lower.
What’s happening now?
Buyers are still trying to defend near the top of the wedge, but every new push looks weaker than the last.
The candles are tightening, which usually signals a volatility squeeze. Once it snaps, the move tends to be quick.
Momentum hasn’t kept pace with price. That mismatch is an early warning sign.
Levels I’m watching
Target 1: 45900–46000. First line of support. If this gives way, short-term weakness will expand.
Target 2: 45200. A deeper pullback zone where profit-taking could slow the drop.
Final zone: 44200–44300. If the wedge fully unwinds, this is where I expect the sell-off to stretch, followed by a bounce attempt.
Short-term view:
For bulls, the only way to flip sentiment is a clean breakout above the wedge resistance. Until then, upside looks limited while the downside risk is gradually opening up. Chasing longs here carries more risk than reward. A confirmed break below support would tilt momentum decisively bearish. Trade safe!

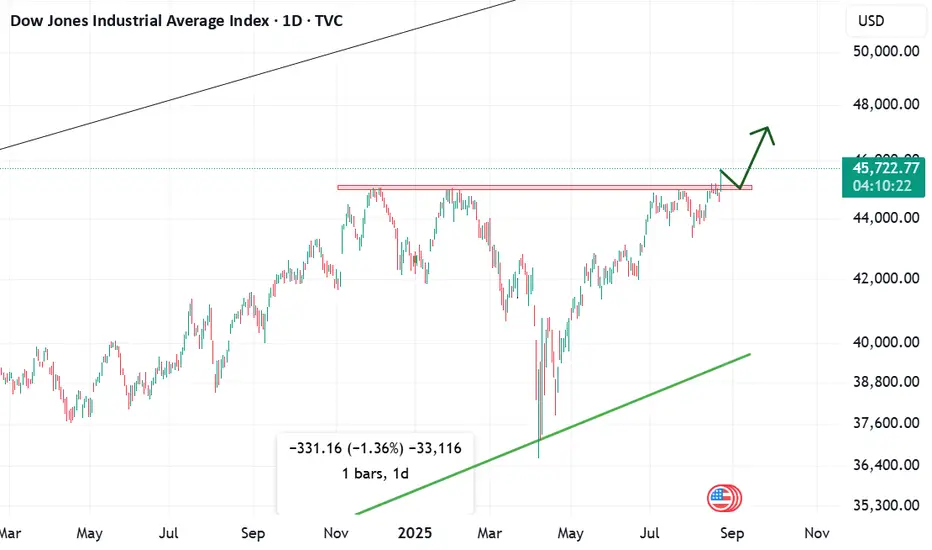
Chart Analysis - Dow Jones (Breaking Important Resistance)The US30 index has successfully broken through an important resistance level today, which is a key technical development. This breakout suggests the potential beginning of a strong bullish trend, provided the index is able to sustain itself above the red zone. If it continues to hold above this zone, buyers will likely remain in control, paving the way for higher upside targets in the coming sessions.
However, if the index fails to stay above this red zone and falls back below it, the breakout will be considered a false breakout, which could lead to renewed selling pressure and possible downside movement. In short, the red zone is the make-or-break level that will decide whether the trend continues upward or reverses.
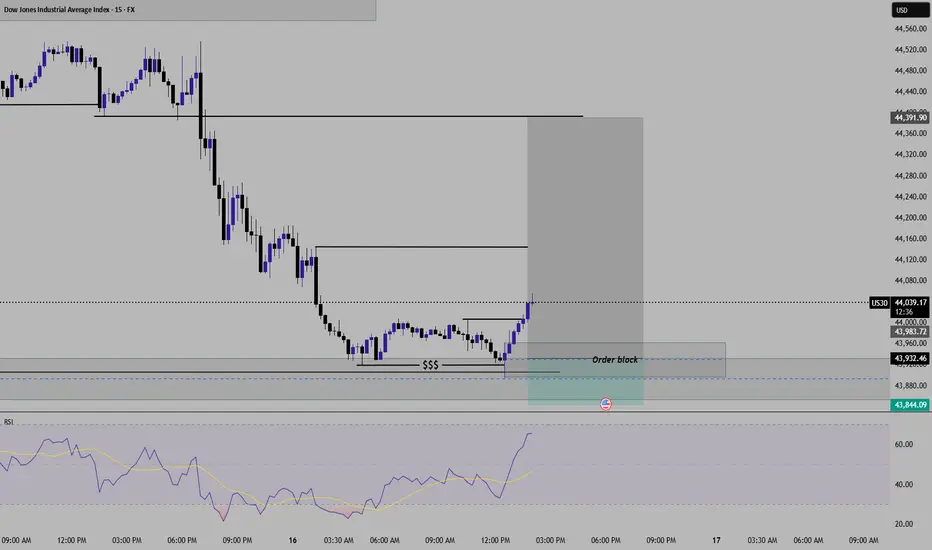
US30 Analysis for smaller time frameUS30 Buy setup With HTF Liquidity Grab Confirmation and lower time frame Entry module.
Buy @ 43925
Stop loss @43845
1st Target - @44140
2nd Target - 44390
(This publication is only for education purpose. consult your financial advisor before any investment)
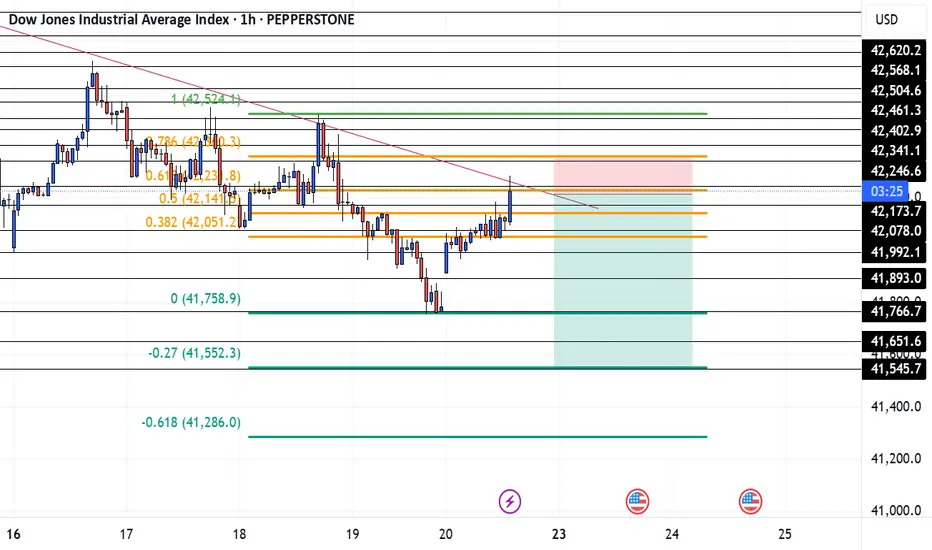
US30 JUNE 20Happy Friday, I see that price is around my key area, the top of the trendline and on my Fib extension. Everything about this trade is telling me to sell. But at the end of the day price does what she wants. So be careful and wait for a break and retest of the key level or trendline before you get in. If you have any questions don't be afraid to ask. Have fun and trust yourself
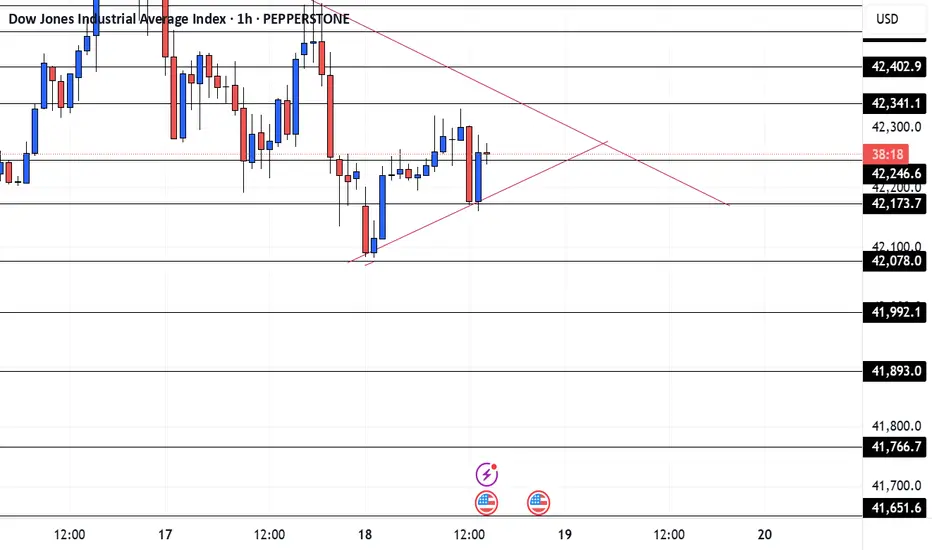
US30 JUNE 18Price looking fine like lemon lime in the summertime. I am just going to follow the trendlines today. I'm either going to wait for a bounce to sell or buy or a break and retest through the trendline. And my take profit will just be the next key area.
I hope this helps. LMK is you don't understand.
Stay safe and have fun
US 30 / Dow Jones / DJI forming bullish patternLooking at US30 US market is forming a bullish pattern called inverted Head and shoulder breakout can lead to a target of all time high.
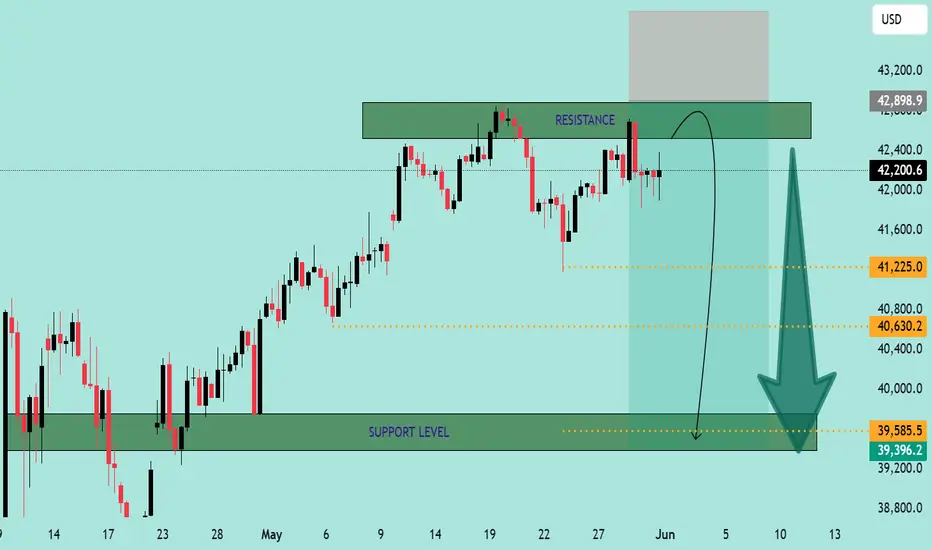
US30 Bearish Rejection at Resistance – Potential Drop Ahead📉 US30 Bearish Rejection at Resistance – Potential Drop Ahead 🚨
The US30 (Dow Jones Industrial Average) is exhibiting signs of bearish weakness after rejecting a strong resistance zone around 42,898.9 - 43,800.8. Here's a breakdown of the current market structure and outlook:
🔍 Technical Analysis
📌 Resistance Zone (Sell Pressure)
Price has failed to break above the marked resistance area multiple times.
Strong wicks and rejections indicate seller dominance near the top.
A short-term bounce into the resistance is anticipated before a likely reversal.
📌 Support Zone (Buy Interest)
The key support is at 39,396.2 - 39,585.5.
This zone has previously served as a strong demand area, with multiple bullish reversals in the past.
📌 Bearish Projection Path
Chart shows a potential rejection pattern playing out.
Price is expected to retest the resistance, then decline towards the support zone.
Intermediate support levels:
41,225.0
40,630.2
🔄 Outlook
🛑 Scenario A (Likely):
Price tests the upper resistance again and forms a double top or shooting star before declining toward the 39.5k support zone.
✅ Scenario B (Invalidation):
If price closes above 43,800 with strong volume, bearish bias will be invalidated, and a bullish continuation can be expected.
🧭 Trade Idea (Not Financial Advice)
🔹 Entry: Short near 42,800–43,000 (after confirmation)
🔹 Target 1: 41,225
🔹 Target 2: 40,630
🔹 Final Target: 39,585
🔹 Stop Loss: Above 43,800
Conclusion:
⚠️ The chart indicates a high-probability short setup unless bulls manage a strong breakout above resistance. Eyes on the price action near resistance for confirmation. 📉📊
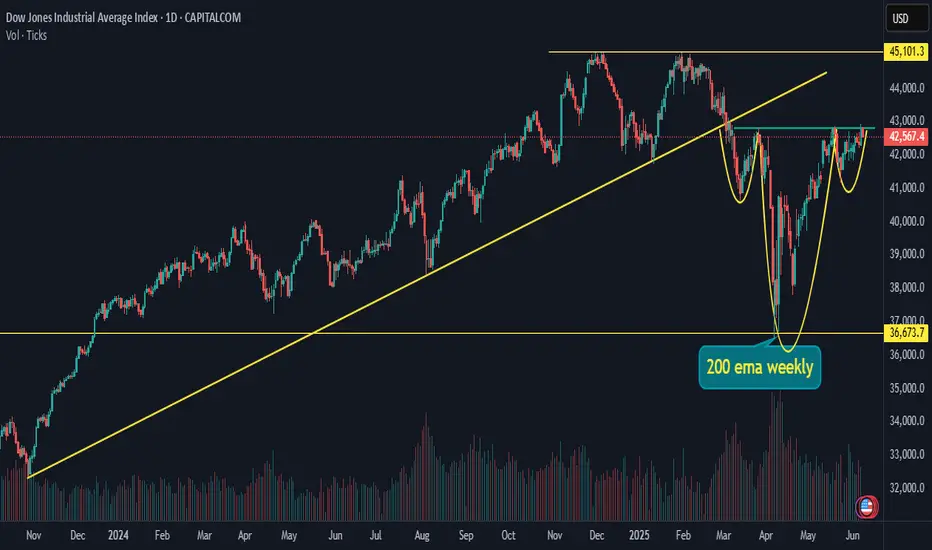
DJI Dow Jones US futuresUS30 futures are currently on a support of weekly 200 EMA.
also this is a retest of previous breakout range 36600- 36800.
This can be a good level to bounce if market wants to reverse so accumulation can be done in small quantity.
But everything is in hands of Trump chacha.

Trade Idea: BUY GOLD (XAUUSD) at 2,993 – Target 3,035🔍 Technical Analysis (1H Chart):
Strong support zone at 2,993 – 2,984 USD:
This area has held well multiple times in recent sessions.
Confluence with the EMA33 low (2,998 USD) acting as dynamic support.
Price previously rebounded from this zone with a noticeable increase in volume.
Structure:
After a pullback to 2,993, the price rebounded to 3,017, indicating bullish demand.
A retracement back to 2,993 would offer a good entry point for a trend continuation buy.
Resistance / Profit Target at 3,035 USD:
This is the most recent local high and aligns with the downtrend line and higher EMA levels.
If price breaks above 3,035, the next potential target zone would be around 3,045–3,050 USD.
🧾 Trade Setup:
Entry: Buy Limit @ 2,993 USD
Stop Loss: Below 2,984 USD
Take Profit:
TP1: 3,031 – 3,033 USD (minor resistance)
TP2: 3,035 USD (major resistance)
🎯 Risk-to-Reward Ratio (R:R): ~1.8 to 2.5 – suitable for intraday or short swing trade setups.
⚠️ Risk Management Tips:
If price doesn't pull back to 2,993 and breaks 3,035 directly, wait for a retest of 3,031 for a breakout-entry strategy.
Keep an eye on upcoming U.S. economic news or Fed events, which could bring volatility.
Adjust stop-loss or secure partial profits during U.S. session for safety.

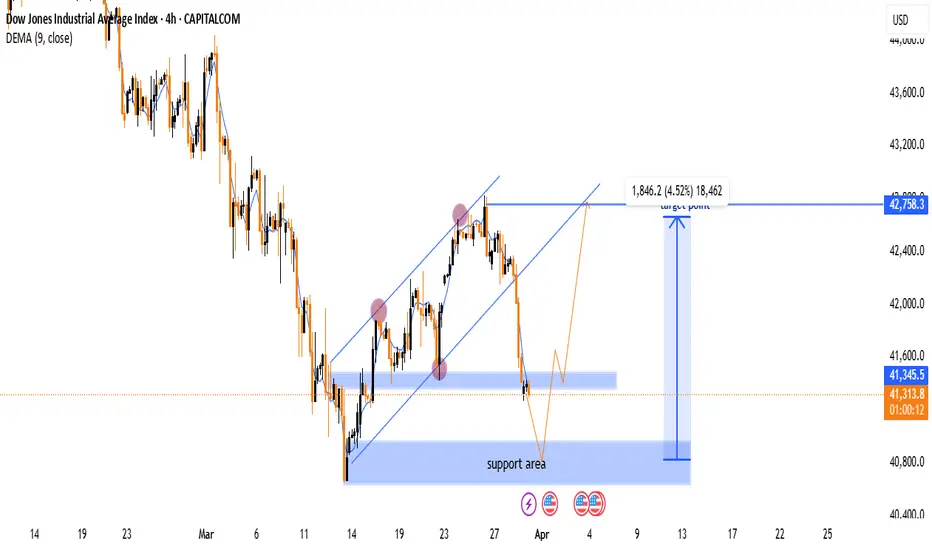
Dow Jones 4H Chart Analysis: Support Test & Potential Reversal 📉 Downtrend: The price was falling sharply before forming an upward channel.
📊 Channel Break: The price broke below the ascending channel 🚨.
🟦 Support Zone: The blue area marks a strong support region 📌.
🔵 Bounce Expected? If the price holds, a rebound could happen 📈.
🎯 Target: The projected upside target is 42,758.3 🚀.
⚠️ Risk: If the support fails, the price may drop further ⛔.
🔴 Watch for: A confirmed reversal near support or further breakdown!
Khuyến nghị giao dịch ETH/USDT(15p): BUY 1830-1835ETH/USDT Trading Recommendation
Optimal Entry Zone: 1,830 – 1,835
Target Take Profit: 1,900
Stop Loss: 1,809
Risk-to-Reward Ratio: ~2.5R (Optimized profit/risk)
Analysis & Outlook:
ETH is in a recovery phase after a strong correction. The price structure indicates:
✅ Strong support around 1,830 – 1,835, where accumulation is evident.
✅ Short-term uptrend with price maintaining above the ascending trendline.
✅ Nearest resistance: 1,900, where price may react before the next move.
Trading Strategy:
Prefer to wait for a pullback to 1,830 – 1,835 before entering a long position.
Strict risk management with stop loss at 1,809 to protect capital.
Expecting ETH to reach 1,900 in the short term, with potential continuation toward 2,050 next week if bullish momentum persists.
🚀 Follow me for more high-probability trading opportunities! 🚀

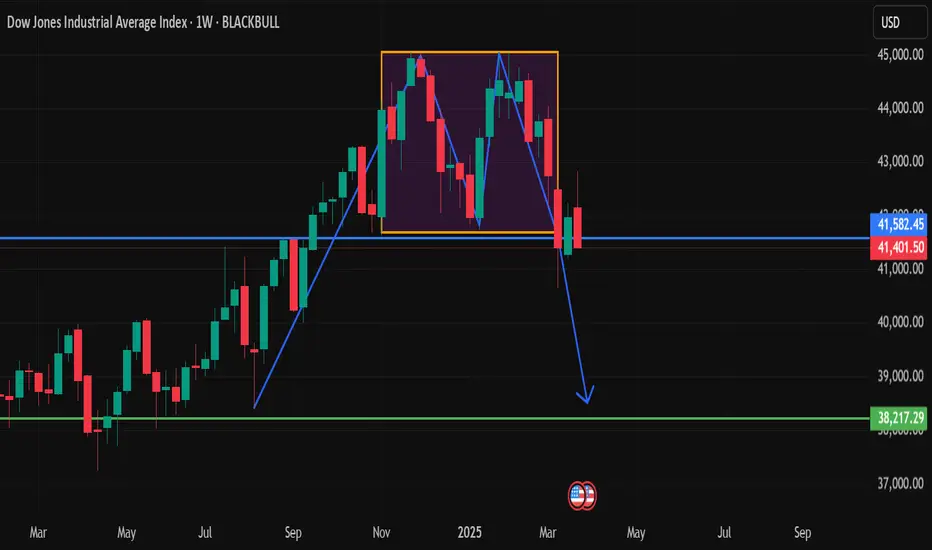
US30 Weekly Analysis: Double Top Breakdown and Bearish OutlookThe Dow Jones Industrial Average (US30) has exhibited a clear double top formation on the weekly timeframe, signaling a potential bearish reversal. The price recently broke below the neckline support around 41,400, confirming the pattern and suggesting further downside movement.
Price action
Analysis
1. Double Top Formation
• A double top is a classic reversal pattern that occurs after an extended uptrend.
• The two peaks were formed around 42,819.50, where bullish momentum failed to sustain further highs.
• The rejection from this level indicated that buyers were losing strength.
2. Neckline Break and Confirmation
• The neckline support at 41,400 was a critical level that held price consolidation for some time.
• A break below the neckline has confirmed the bearish structure, signaling further downside potential.
• If the price retests 41,400 and rejects, it could provide another opportunity for short positions.
3. Bearish Target Projection
• The double top pattern suggests a measured move equal to the distance between the peaks and neckline (approximately 1,400-1,500 points).
• This projects a downside target of 38,217, aligning with the next major support zone (green line on the chart).
Trading Strategy: Bearish Continuation
• Entry: Wait for a retest of 41,400 and a rejection with a bearish confirmation candle.
• Stop Loss: Place above 41,800, as a break above invalidates the bearish setup.
• Take Profit: First target 39,500, final target 38,217.
• Risk Management: Use proper position sizing to manage risk in case of a false breakout.
Conclusion
US30 is showing strong bearish momentum after confirming the double top breakdown. A successful retest of 41,400 as resistance will likely accelerate selling pressure towards 38,217. We should watch price action closely for confirmation before entering short positions.
Strategy: Short US30 from 44,000 to 42,100 – Weekly Trade Plan1. Market Overview & Context
US30 (Dow Jones) is recovering but still faces pressure from macroeconomic factors:
U.S. bond yields: The 10-year yield is slightly rising, putting pressure on stocks.
Monetary policy: The Fed maintains a cautious stance on rate cuts, limiting strong market rallies.
Investor sentiment: Signs of profit-taking after the recent rebound.
Given these factors, the strategy of shorting US30 from the 44,000 - 44,484 zone down to 42,100 is highly feasible.
2. Trading Strategy
Entry Point:
Sell in the 44,000 - 44,484 zone, a key resistance area likely to trigger strong selling pressure.
Stop Loss (SL):
Above 44,850, as a break above this level could invalidate the short setup.
Take Profit (TP):
Target 1: 43,664 - 43,765 (Take 50% profit to secure gains).
Target 2: 42,100 - 42,132 (Fully close the trade to capitalize on the expected drop).
Risk Management:
Minimum Risk/Reward (R:R) ratio of 1:3, ensuring an effective trade setup.
Use a trailing stop to maximize profits if the price moves in the desired direction.
Alternative Scenarios
If US30 breaks above 44,850, the short setup is invalid. Wait for a new confirmation signal.
If the price drops quickly to 43,664 before entry, wait for a rebound near 44,000 before shorting again.

EURUSD - 1H LONGFOREXCOM:EURUSD
Hello traders , here is the full multi time frame analysis for this pair, let me know in the comment section below if you have any questions, the entry will be taken only if all rules of the strategies will be satisfied. wait for more Smart Money to develop before taking any position . I suggest you keep this pair on your watchlist and see if the rules of your strategy are satisfied...
Keep trading
Hustle hard
Markets can be Unpredictable, research before trading.
Disclaimer: This trade idea is based on Smart money concept and is for informational purposes only. Trading involves risks; seek professional advice before making any financial decisions. Informational only!!!

US 30 - What Next ?Since November 2023, the index has been moving in a rising parallel channel. This time, again, it comes to the lower edge of the channel.
If shows a reversal from the lower edge, may go into a bullish phase. MACD shows a reversal sign too. But merely this is not enough. should wait for some more confirmations. However, this is a good time to exercise a position with a low risk.
If gives a bounceback around these levels, may go around 44500 or more..
This illustration is only for learning and sharing purposes, it is neither a prediction nor a trading advice in any way.
All the best for your trading plans.

DOW JONES - SWING TRADESymbol - DJI
DJI is currently trading at 42545
Dow Jones is making double bottom at larger time frame & I'm seeing a trading opportunity on buying side.
Buying DJI Futures at CMP 42545
I will add more position if 42345 comes & will hold with SL 42100
Targets I'm expecting are 43100 - 43340 - 43580 & 42820
Disclaimer - Do not consider this as a buy/sell recommendation. I'm sharing my analysis & my trading position. You can track it for educational purposes. Thanks!

nas100 or Nasdaq can touch 27000 in next year 2025i think nas100 can touch 27000 in nxt year , this analysis is base on Fibonacci retracement.
Chart time frame is monthly. I believe that monthly analysis is best for Future predictions it can gives us 90-95 percentage. lets see what happen in next year.
