Gold 1H – Pullback Expected as USD Softens After Jobless Claims🟡 XAUUSD – Intraday Trading Plan | by Ryan_TitanTrader
📈 Market Context
Gold is trading within a corrective structure today as the U.S. dollar weakens slightly following higher-than-expected Jobless Claims.
Market sentiment remains mixed ahead of upcoming Fed speeches, which could provide clues about December policy expectations.
• A more hawkish tone could trigger a deeper downside move toward unfilled discount zones.
• Conversely, any dovish signals may push gold into a short-term liquidity grab before resuming its corrective trend.
Liquidity remains concentrated near the $4,030 area, where price may tap into resting buy-side liquidity before forming the next bearish leg.
🔎 Technical Analysis (1H / SMC Style)
• Structure: Current bias shows corrective bearish intent following recent ChoCH → BOS sequence on H1.
• Premium Zone: The 4030–4028 region aligns with an unmitigated H1 supply — ideal for continuation shorts.
• Liquidity Sweep: Price may reach 4030 to sweep early breakout buyers before confirming downside continuation.
• Discount Zone: Strong demand sits at 3932–3934, overlapping with previous bullish displacement and unmitigated demand.
🔴 Sell Setup
• Entry: 4030 – 4028
• Stop-Loss: 4040
• Take-Profit Targets: → 3980 → 3964 → 3934 (major demand zone)
🟢 Buy Setup (Countertrend Reaction)
• Entry: 3932 – 3934
• Stop-Loss: 3925
• Take-Profit Targets: → 3964→ 3995 → 4020
(Only valid if liquidity sweep and bullish reaction occur at the demand zone)
⚠️ Risk Management Notes
• Wait for M15 BOS/ChoCH confirmation at both zones to avoid premature entries.
• Avoid trading directly at the minor support around 3964 — it is not a valid SMC entry zone.
• Prioritize the sell setup; intraday bias remains corrective-bearish within a broader range.
• Secure partial profits at the first liquidity target and trail stops according to structure.
✅ Summary
Gold is likely to seek premium liquidity near 4030 before resuming its corrective move lower.
The 4030–4028 supply area offers a clean continuation-short entry, while 3932–3934 remains the strongest discount zone for reactive long setups.
Stay adaptable — the market maintains a mild bearish tone while waiting for further Fed guidance.
FOLLOW RYAN_TITANTRADER for daily SMC setups ⚡
Dailychart

XAUUSD – Intraday H1 Plan: Liquidity Sweep or Reversal Base?Date: November 4, 2025
Timeframe: H1
🌐 MARKET CONTEXT
Gold is consolidating between $3,976 and $4,006 after a volatile session yesterday.
Market sentiment remains mixed, as traders weigh the rebound in U.S. Treasury yields against ongoing geopolitical and inflation concerns.
Recent move: Gold rebounded from the $3,975 low after a minor liquidity sweep below last week’s range.
Sentiment: Neutral-to-bullish in the short term — safe-haven demand still provides a soft floor.
Sessions to watch:
London session: Expect retracement and liquidity grab below intraday lows.
New York session: Possible expansion to the upside if $4,000 zone holds as support.
Macro Bias: Mildly bullish if price maintains structure above $3,980–$3,985; potential liquidity sweep downside before reversal.
📉 TECHNICAL ANALYSIS (SMC + LIQUIDITY STRUCTURE)
Market Structure:
H1 is forming a short-term accumulation range with liquidity resting below $3,976 (SSL) and above $4,006 (BSL).
A break and close above $4,005.5 may trigger a short-term BOS → potential push toward $4,015–$4,020.
Key SMC Confluences:
$4,200–4,230 Extended Resistance – higher untested supply if momentum returns.
Demand Zone: $3,978–$3,980 → aligned with FVG + previous sweep low.
Supply Zone: $4,004–$4,006 → previous OB + high liquidity.
🔑 KEY PRICE ZONES
Price Zone Type Explanation
4,006–4,004 🔴 Supply Previous high + BSL liquidity
3,996–3,994 🟡 Resistance Equilibrium rejection zone
3,986–3,984 🟢 Demand OB + CHoCH base support
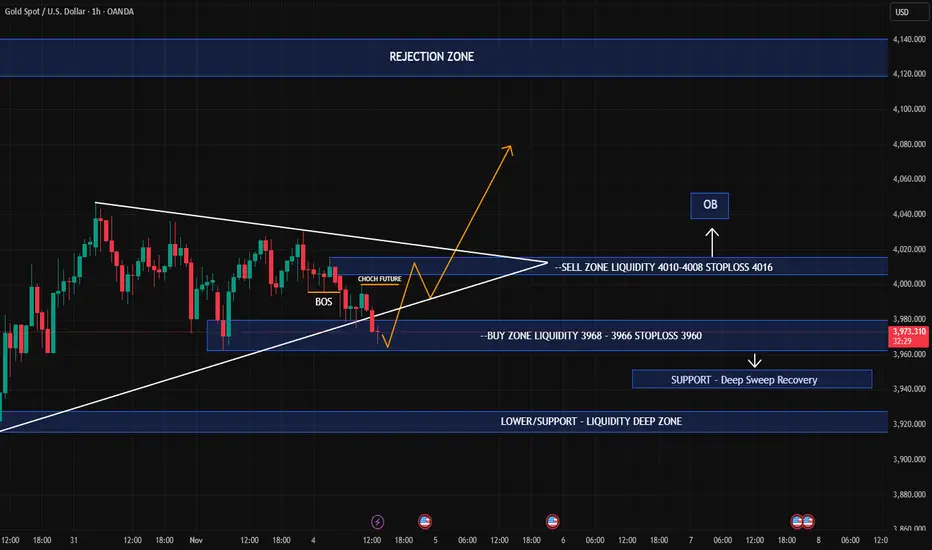
3,980–3,978 🟢 Strong Demand SSL sweep + FVG confluence
3,976–3,974 ⚠️ Liquidity Sweep Deep liquidity / stop-hunt zone
⚙️ TRADE SETUPS
✅ BUY SCENARIO 1– Deep Sweep Recovery
Entry: 3,968–3,966
Stoploss: 3,960
TP1: 3,988
TP2: 3,996
TP3: 4,004
Logic: SSL sweep below the range + FVG mitigation → bullish reaction expected during London open.
🚫 SELL SCENARIO – Supply Rejection
Entry: 4,010–4,008
Stoploss: 4,016
TP1: 3,994
TP2: 3,986
TP3: 3,980
Logic: Price sweeps the previous BSL liquidity above $4,006 → look for bearish CHoCH + confirmation candle M5 before entry.
⚠️ SCALPING SELL – Aggressive Short
Entry: 4,008–4,009
Stoploss: 4,012
TP: 3,998 – 3,990 – Open
Logic: High-risk scalp at liquidity spike above day’s high; confirm rejection with volume drop.
🧠 NOTES / SESSION PLAN
Prioritize long setups near $3,980–3,984 zone during London open.
Look for liquidity sweep before entering — avoid premature entries.
During NY session, re-evaluate if gold re-tests the $4,004–$4,006 supply zone.
Avoid overtrading; use smaller position sizing due to narrow range ($30).
Always wait for H1 close confirmation before committing.
🏁 CONCLUSION
Gold remains range-bound within $3,976–$4,006, but the structure hints at a potential bullish bias if liquidity below $3,978 is swept first.
The preferred buy zones are $3,984–$3,986 and $3,978–$3,980, while sell reactions may occur near $4,004–$4,006.
Expect whipsaw volatility between London and NY overlap; trade only with clear SMC confirmations and proper risk control.
Gold 1H – Slight Correction or Bullish Reaccumulation Ahead?XAUUSD – Intraday Trading Plan | by Khang_Trader
📈 Market Context
Gold is currently trading around $4,110/oz as traders digest a mix of macroeconomic signals and shifting expectations surrounding the Federal Reserve’s next moves.
The market focus today centers on U.S. housing-starts and jobless-claims data.
Strong data → could trigger short-term selling pressure on gold.
Weak data → may fuel safe-haven demand, extending the current rally.
Treasury yields remain steady, while dovish rate-cut bets for early 2026 are gaining traction.
Expect liquidity sweeps around session highs/lows before a clear directional move, as institutional traders fine-tune their positioning within the week’s range.
🔎 Technical Analysis (1H / SMC Perspective)
The overall market structure remains bullish, with recent BOS confirming continuation after a prior accumulation phase.
A minor Change of Character (ChoCH) has appeared, signaling a short-term correction — likely a liquidity grab before the next bullish leg.
Liquidity below $4,090-$4,100 has been swept, bringing price into the discount zone near $4,050-$4,080.
A potential re-accumulation zone is forming around that area — buyers should wait for M15/M30 BOS or ChoCH confirmation before entering.
Upside liquidity targets align with the $4,350-$4,380 region — a premium supply zone where sellers may re-enter.
🔴 Sell Setup
Entry: 4378 – 4376
Stop-Loss: 4386
Take-Profit Targets:
1️⃣ 4325
2️⃣ 4260
📌 Only consider this setup if price reaches the supply zone and shows bearish confirmation (BOS/ChoCH on lower timeframe).
🟢 Buy Setup
Entry: 4050 – 4080
Stop-Loss: 4045
Take-Profit Targets:
1️⃣ 4150
2️⃣ 4300
3️⃣ 4350 +
📌 Look for BOS or ChoCH confirmation on M15 before execution. Avoid entering right before U.S. data releases.
⚠️ Risk Management Tips
Avoid trading during high-impact news — spreads can widen and cause slippage.
Scale in/out gradually; take partial profits at liquidity zones.
Once structure confirms continuation, trail stop-loss to lock profits.
A clean break below $4,000 would invalidate the bullish continuation scenario — re-evaluate bias if that happens.
Maintain a clear Risk : Reward ratio (ideally 1 : 3 or better).
✅ Summary
Bias: Bullish as long as price holds above $4,000.
Buy zone: 4050-4080 (watch for confirmation).
Sell zone: 4376-4378 (look for reaction and BOS down).
Key invalidation: Below 4000.
Watch U.S. data this session — it will likely dictate short-term volatility and direction.
FOLLOW RYAN FOR MORE USEFUL TRADING IDEAS!!!

Gold 1H – Bearish Reaction After Consecutive Gains🟡 XAUUSD – Intraday Trading Plan | by Ryan_TitanTrader
📈 Market Context
After several sessions of steady gains, gold is showing signs of exhaustion as U.S. Treasury yields stabilize and traders reassess the Federal Reserve’s next move.
The market’s focus today is on U.S. housing data and Fed officials’ remarks, which could shape expectations for the December policy outlook.
• A hawkish tone from policymakers may strengthen the dollar and pressure gold lower.
• Conversely, softer remarks could briefly trigger buying around key discount zones, but the overall tone remains corrective after the recent rally.
Market liquidity is concentrated near the ₹4,230 area — where price may tap into unmitigated supply before continuing its bearish leg.
🔎 Technical Analysis (1H / SMC Style)
• Structure: The overall bias has shifted bearish following consecutive ChoCH and BOS formations.
• Premium Zone: The 4,230–4,228 area aligns with an H1 order block and previous liquidity pool — a prime zone for short re-entry.
• Liquidity Sweep: The recent upside push toward 4,230 may sweep late buyers before the next bearish leg unfolds.
• Discount Zone: Short-term liquidity may rest around 4,080–4,100, which aligns with previous sell-side imbalance (SSI) and acts as an intraday reaction zone.
🔴 Sell Setup
• Entry: 4,230 – 4,228
• Stop-Loss: 4,240
• Take-Profit Targets: 4,100 → 4,080 → 4,050+
🟢 Buy Scalp Setup (Short-Term Countermove)
• Entry: 4,081 – 4,083
• Stop-Loss: 4,074
• Take-Profit Targets: 4,100 → 4,115
(Only valid if liquidity sweep confirms reaction within discount zone)
⚠️ Risk Management Notes
• Confirm M15 BOS/ChoCH before entry — avoid blind orders during news.
• Reduce position size for scalp entries; primary directional bias remains bearish.
• Lock partial profits near first liquidity targets and trail stops as structure confirms continuation.
✅ Summary
Gold faces near-term correction pressure after multiple bullish sessions.
The 4,230–4,228 zone offers a clean premium OB entry for continuation shorts, while reactive buyers may scalp intraday from 4,081 if liquidity sweeps occur.
Stay adaptive — today’s sentiment is short-term bearish within a larger range-bound structure.
FOLLOW RYAN_TITANTRADER for daily SMC setups ⚡

Gold 1H – Can Gold Hold Above 4247 as Powell Takes the Stage?XAUUSD – Intraday Trading Plan | by Ryan_TitanTrader
📈 Market Context
Gold holds firm near ₹4,230, with traders cautiously awaiting U.S. Retail Sales data and Fed Chair Powell’s remarks later today.
After a series of softer inflation reports, market sentiment has tilted mildly dovish — yet the U.S. dollar remains steady as investors hesitate to price in early rate cuts.
The Fed’s tone today will be critical: a hawkish Powell could trigger short-term profit-taking on gold, while any dovish signals may reignite safe-haven bids.
Expect choppy intraday movement with liquidity sweeps around key zones before a confirmed directional move emerges.
🔎 Technical Analysis (1H / SMC Style)
• The structure remains bullish, confirmed by previous Breaks of Structure (BOS) and a Change of Character (ChoCH) earlier in the week.
• Price is now approaching a premium supply zone at 4247–4249, where potential short-term sell reactions could appear before retracement.
• Below, the discount demand zone at 4184–4186 aligns with prior BOS support and acts as a high-probability reaccumulation area.
• If price revisits the buy zone and forms bullish confirmation on M15, continuation toward new highs around 4260+ is favored.
🔴 Sell Setup: 4247 – 4249
SL: 4255 – 4257
TP targets: 4210 → 4195
🟢 Buy Setup: 4184 – 4186
SL: 4174
TP targets: 4210 → 4245 → 4260+
⚠️ Risk Management Tips
• Wait for M15 BOS/ChoCH confirmation before executing either setup.
• Watch for volatility spikes around Powell’s speech and U.S. Retail Sales release — spreads may widen.
• Consider partial profits at intra-day liquidity points and trail stops once structure confirms.
✅ Summary
XAUUSD maintains its bullish structure but may face a liquidity sweep above 4247–4249 before a deeper retracement into 4184–4186.
Institutional activity could drive accumulation near the discount zone if macro data supports dovish sentiment.
The intraday bias remains “Buy the Dip”, with tactical sells possible at premium resistance for short-term scalps.

Gold 1H – Slight Correction or Bullish Reaccumulation Ahead?XAUUSD – Intraday Trading Plan | by Ryan_TitanTrader
📈 Market Context
Gold extends its rebound near ₹4 250 as traders weigh the recent uptick in U.S. Treasury yields against growing expectations of a softer Federal Reserve stance.
After the latest mixed U.S. economic data, markets are leaning toward a mildly dovish outlook — rate-cut bets for early 2026 are gaining traction, while the dollar remains steady.
Today’s focus centers on U.S. housing-starts and jobless-claims data, which could steer short-term volatility.
A stronger-than-expected report may trigger temporary selling pressure on gold, while weaker figures could revive safe-haven demand and extend the rally toward ₹4 380 +.
Expect liquidity hunts before any clear directional move, as institutional players refine positions near the week’s range extremes.
🔎 Technical Analysis (1H / SMC Style)
• Market structure remains bullish, with previous Breaks of Structure (BOS) confirming continuation after the earlier accumulation phase.
• A short-term Change of Character (ChoCH) signals corrective movement — likely a liquidity sweep before the next bullish leg.
• Liquidity resting below ₹4 200 has already been taken, aligning with the discount zone around ₹4 196 – ₹4 198.
• A potential re-accumulation is forming; buyers may look for confirmation (M15 BOS/ChoCH) inside this demand zone.
• Upside liquidity targets cluster near ₹4 375 – ₹4 380, coinciding with a premium supply zone where sellers might re-enter.
🔴 Sell Setup
Entry: 4378 – 4376
Stop-Loss: 4386
Take-Profit Targets: 4325 → 4260
🟢 Buy Setup
Entry: 4196 – 4198
Stop-Loss: 4190
Take-Profit Targets: 4250 → 4370 → 4380 +
⚠️ Risk Management Tips
• Wait for lower-timeframe BOS/ChoCH confirmation before execution.
• Be cautious around U.S. macro data releases — spreads and volatility can widen temporarily.
• Use partial take-profits at nearby liquidity zones and trail stops once market structure confirms continuation.
✅ Summary
Gold maintains its bullish bias above ₹4 200 after sweeping liquidity.
A short-term correction could retest ₹4 196 – ₹4 198 for fresh buy entries, while the broader trend remains upward.
Only a clean structural break below ₹4 190 would invalidate the bullish continuation scenario.
FOLLOW RYAN FOR MORE USEFUL TRADING IDEAS!!!

Gold 1H – Bullish Rebound After Strong Correction🟡 XAUUSD – Intraday Trading Plan | by Ryan_TitanTrader
📈 Market Context
Gold is attempting to rebound near $4,320 after a sharp correction earlier this week, as traders weigh the recent pullback in U.S. Treasury yields and renewed expectations of a dovish Federal Reserve tone.
Markets are now positioning ahead of key U.S. housing and manufacturing data, which could shape short-term sentiment for both the dollar and real yields.
• Softer economic numbers may reinforce the case for policy easing in early 2026, supporting gold’s safe-haven appeal.
• Conversely, stronger data could momentarily pressure XAUUSD, yet the broader uptrend remains intact amid central-bank accumulation and geopolitical tension.
Expect a liquidity-driven environment, with price potentially sweeping lower before reclaiming bullish momentum.
🔎 Technical Analysis (1H / SMC Style)
• Structure: Overall bias remains bullish following consecutive Breaks of Structure (BOS) and a confirmed Change of Character (ChoCH) indicating corrective retracement.
• Discount Zone: The $4,270–$4,272 demand area sits within the discount zone of the recent range (swing low to 4454 high), ideal for re-accumulation.
• Liquidity Sweep: Recent wicks near $4,300 suggest liquidity has been collected, potentially setting up for another bullish push.
• Premium Zone: Upside liquidity clusters near $4,454–$4,452, aligning with a premium supply area where short-term selling may appear.
🔴 Sell Setup
• Entry: 4454 – 4452
• Stop-Loss: 4463
• Take-Profit Targets: 4400 → 4330
🟢 Buy Setup
• Entry: 4270 – 4272
• Stop-Loss: 4260
• Take-Profit Targets: 4340 → 4380 → 4450 +
⚠️ Risk Management Notes
• Wait for M15 BOS/ChoCH confirmation before triggering entries.
• Avoid entries during high-volatility windows around U.S. data releases.
• Secure partial profits near intermediate liquidity zones, trail stops after BOS confirmation.
✅ Summary
Gold maintains a bullish re-accumulation structure following a healthy correction.
A retest into the discount zone around $4,270 offers potential long entries targeting the premium zone near $4,450+.
Only a decisive break below $4,260 would invalidate the intraday bullish scenario.
FOLLOW RYAN_TITANTRADER for more SMC trading insights ⚡

Markets Brace for U.S. Retail Sales & Fed Volatility XAUUSD – Intraday Trading Plan | by Ryan_TitanTrader
📈 Market Context
Gold prices hover near ₹4,190 after an early-week rally as traders brace for U.S. Retail Sales data and a new round of Federal Reserve speeches later today.
Recent gains were fueled by softer inflation readings, yet the dollar remains resilient amid hawkish undertones from Fed officials. Markets are now balancing between expectations of slower growth and persistent rate-cut caution.
A stronger-than-expected Retail Sales print could pressure gold temporarily, but any dovish signal from Fed speakers may quickly restore bullish momentum. Expect liquidity hunts on both sides before a confirmed direction forms.
🔎 Technical Analysis (1H / SMC Style)
• Structure remains bullish after multiple Breaks of Structure (BOS) and a recent Change of Character (ChoCH) confirmation.
• Price is approaching the Premium Zone (4211–4209) — a potential liquidity sweep area where short-term sellers may react.
• Below, the H1 FVG Buy Zone (4145–4149) offers a discount entry aligned with recent BOS support and previous mitigation points.
• Maintaining a bullish bias while awaiting clean reaction within the FVG zone is key for continuation toward new highs.
🔴 Sell Setup: 4211 – 4209
SL: 4218
TP targets: 4190 → 4175 → 4155
🟢 Buy Setup: 4145 – 4147
SL: 4138
TP targets: 4170 → 4190 → 4220+
⚠️ Risk Management Tips
• Wait for M15 ChoCH/BOS confirmation before entry to avoid false breaks.
• Expect high volatility around Retail Sales and Fed remarks — spread widening is likely.
• Partial take-profits near intra-day liquidity points are recommended.
✅ Summary
XAUUSD remains bullish on structure but faces a potential liquidity grab around 4211–4209 before retracing into the H1 FVG buy zone (4145–4149).
Smart money may seek to accumulate long positions after a controlled pullback, especially if Fed commentary echoes a slower policy tightening path.
Intraday bias leans Buy the Dip, with caution around macro-driven volatility spikes.

Gold 1H – Price Reaction Ahead of U.S. Retail Sales & Fed RemarkXAUUSD – Intraday Trading Plan | by Ryan_TitanTrader
📈 Market Context
Gold is trading around the ₹4,110 mark, consolidating after a strong impulsive rally earlier this week.
Traders are now shifting focus to U.S. Retail Sales data and a series of Federal Reserve remarks due later today — both key drivers that could influence near-term expectations for the next rate decision.
After last week’s soft inflation signals, gold initially extended higher, but rising Treasury yields and cautious sentiment ahead of today’s macro releases have slowed momentum.
Any hawkish Fed tone or stronger consumer spending data could weigh on XAUUSD, triggering a liquidity sweep from the premium zones before the next accumulation phase begins.
🔎 Technical Analysis (1H / SMC Style)
• Structure shows a confirmed BOS on lower timeframes, signaling the end of the previous impulsive leg.
• Price currently sits within a Mitigation Zone (4117–4110), reacting to prior imbalance after a clean sweep of internal liquidity.
• The Premium Liquidity Zone (4217–4215) aligns with a Rejection Block and is likely to act as a short-term Sell Zone.
• Below, the 4056–4058 area marks a Buy-Side Support, overlapping with a previous ChoCH and internal discount OB.
• Expect a short-term sell reaction from premium zones before a possible bullish mitigation bounce off support.
🔴 Sell Setup: 4217–4215
SL: 4224
TP targets: 4200 → 4175 → 4160
🟢 Buy Setup: 4056–4058
SL: 4050
TP targets: 4070 → 4090 → 4100+
⚠️ Risk Management Tips
• Wait for M15 ChoCH / BOS confirmation before executing either setup.
• Be cautious during Fed remarks — volatility spikes are common around liquidity levels.
• If price reacts impulsively from 4217 with displacement, partial shorts are favored.
• Conversely, if 4056 holds and forms clean bullish structure, it could serve as the base for the next expansion leg.
✅ Summary
Gold is likely to engineer a liquidity grab in the premium zone (4217–4215) before retracing into the mitigation area near 4056–4058, where smart money may accumulate long positions.
The day’s direction will hinge on how markets interpret upcoming U.S. Retail Sales data and Fed tone — expect volatility and false breaks before the true directional move forms.

Gold 1H – Potential Liquidity Sweep Before Fed SpeechesXAUUSD – Intraday Trading Plan | by Ryan_TitanTrader
📈 Market Context
Gold remains steady near ₹4,065, as traders eye upcoming U.S. PPI data and Fed officials’ speeches later today for new guidance on the inflation outlook.
The recent rise in Treasury yields has slightly capped gold’s upside momentum, but underlying safe-haven demand persists amid ongoing geopolitical and economic uncertainty.
If the PPI print shows softer inflation, gold could attract renewed buying; however, a hotter reading may spark another liquidity sweep lower before any sustained rally.
🔎 Technical Analysis (1H / SMC Style)
• ChoCH confirmed at 4060+, showing potential exhaustion in the current short-term uptrend.
• Price tapped the premium zone (4080–4078), aligning with previous liquidity and imbalance — ideal for a short-term sell setup.
• A BOS formed at 4017, opening the way for retracement toward the discount zone (3999–3997).
• The 3997–3999 area is a strong demand zone, overlapping with a prior ChoCH and liquidity void — a potential reversal area for bulls.
• Expect a liquidity grab at 3990 before a bullish reaction if structure holds.
🔴 Sell Setup: 4080–4078
SL: 4087
TP targets: 4040 → 4015 → 4000
🟢 Buy Setup: 3999–3997
SL: 3990
TP targets: 4035 → 4060 → 4100+
⚠️ Risk Management Tips
• Wait for M15 ChoCH / BOS confirmation before triggering entries.
• Avoid over-leverage during Fed speech hours — price may fake out around liquidity levels.
• If price sweeps 4080 liquidity and rejects impulsively, partial short entries are favored.
• Conversely, if 3997 holds firm with strong bullish structure, watch for re-entry confirmation to ride the next expansion.
✅ Summary
Gold is currently playing within a premium-to-discount framework, as smart money may engineer a sweep of 4080 liquidity before driving price down toward 3997–3999 to collect buy-side orders.
After that, a strong bullish reaction is expected from the demand zone if macro conditions (like soft PPI or dovish Fed tone) support it.
Stay patient — structure confirmation is key before entering either direction.

Gold 4H – Bullish Setup Ahead of Fed & CPI Week🥇 XAUUSD – Weekly Smart Money Plan | by Ryan_TitanTrader
📈 Market Context
Gold continues to trade near the ₹4,000 mark as traders brace for a volatile week driven by the U.S. CPI release and Federal Reserve remarks.
Recent Fed comments hint that policymakers are open to rate cuts if inflation cools further, boosting gold’s appeal as a hedge against policy easing and market uncertainty.
Meanwhile, tensions in the Middle East and strong central bank demand for gold continue to provide underlying bullish momentum, though short-term pullbacks remain likely.
🔎 Technical Analysis (4H / SMC Style)
• The higher-timeframe BOS (Break of Structure) confirms that gold remains in a bullish market phase, with buyers defending every major retracement.
• The current pullback could target the Potential Reaccumulation Zone around 3947, where liquidity may be swept before the next bullish impulse.
• The Discount Demand Zone (3873–3875) aligns with strong 4H imbalance and previous structure support — ideal for a high-probability buy setup.
• The Premium Supply Zone (4134–4132) is positioned as a liquidity target, where price may react for short-term corrections.
🟢 Buy Zone: 3873–3875
SL: 3866
TP targets: 3947 → 4020 → 4050 → 4130+
🔴 Sell Zone: 4134–4132
SL: 4141
TP targets: 4080 → 4020 → 3950
⚠️ Risk Management Tips
• Wait for H1 ChoCH / BOS confirmation before executing positions.
• Anticipate liquidity hunts near 3950–3970 ahead of CPI or Fed events.
• Use partial scaling and secure partial profits once the structure confirms continuation.
• Avoid entering during the first 15 minutes of major news releases to reduce slippage risk.
✅ Summary
Gold remains structurally bullish on the 4H timeframe, with potential retracement opportunities offering premium entries.
Smart Money may induce a liquidity sweep into 3873–3875 before pushing toward 4130+, where a reaction from institutional supply is likely.
With major macro catalysts this week, traders should expect sharp volatility and manipulative moves before the next major leg develops.
🔔 Stay patient — let the market reveal its intent before entering.
Premium buys remain favored above 3870 while watching for potential distribution near 4130.

Gold 1H – Price Reaction Ahead of U.S. CPI DataXAUUSD – Intraday Trading Plan | by Ryan_TitanTrader
________________________________________
📈 Market Context
Gold prices remain steady around $3,975, as traders await the U.S. CPI data release later today — a key event that could shape expectations for the Fed’s next rate move.
If inflation cools, the dovish sentiment may boost gold’s safe-haven appeal; however, a hotter CPI print could trigger renewed dollar strength and short-term pressure on XAUUSD.
Market volatility is expected to spike near the release, so liquidity grabs and false breaks are likely before the true direction forms.
________________________________________
🔎 Technical Analysis (H1 / SMC Style)
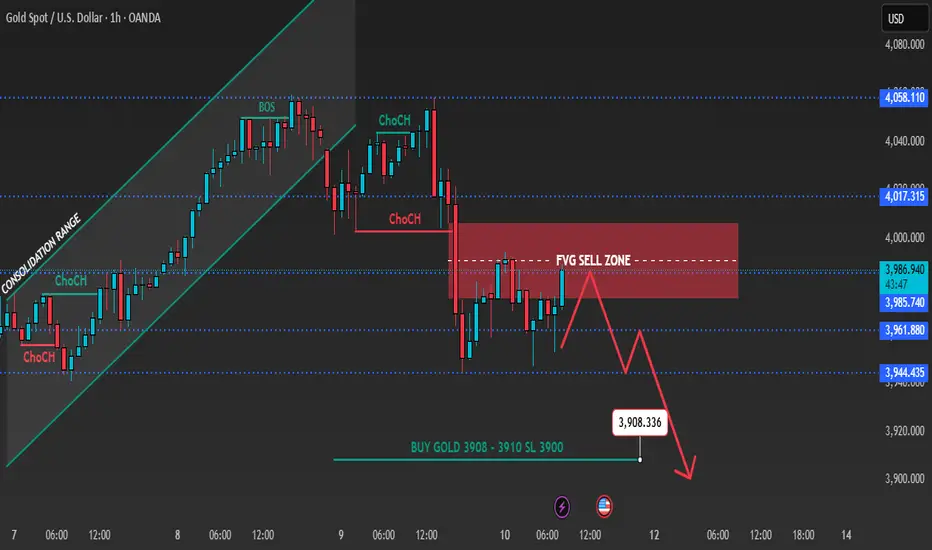
• The recent Change of Character (ChoCH) confirms short-term bearish control after breaking the bullish structure near 4017.
• FVG Sell Zone (4015–4017) aligns with premium imbalance and prior liquidity — ideal for short setups if price retests that zone.
• BOS to the downside was confirmed at 3960, showing sellers in control.
• The discount zone 3908–3910 is a strong demand area where buyers may step in after liquidity sweep below 3910.
________________________________________
🟢 Buy Zone: 3908–3910
SL: 3900
TP targets: 3920 → 3940 → 3960+
🔴 Sell Zone: 4015–4017
SL: 4022
TP targets: 4000 → 3985 → 3970
________________________________________
⚠️ Risk Management Tips
• Wait for M15 ChoCH / BOS confirmation before entering either side.
• Use partial position sizing around CPI release — volatility may cause large wicks.
• Watch for liquidity hunts near 3980–3990 before CPI, then confirm structure direction.
________________________________________
✅ Summary
Gold is consolidating below key resistance while awaiting U.S. inflation data.
Smart money may engineer a liquidity sweep toward 4015–4017 (FVG) before resuming the bearish leg into 3910.
However, if CPI comes in softer than expected, buyers may defend 3908–3910, sparking a recovery back toward 3980+.
🔔 Stay alert around CPI release hours — expect manipulative price action and confirm structure breaks before committing to directional trades.
Gold 1H – Watch for Liquidity Hunt Before Fed Minutes💎 XAUUSD – Intraday Trading Plan | by Ryan_TitanTrader
📈 Market Context
Gold continues to shine past the ₹4,000 mark, driven by persistent safe-haven demand amid U.S. government shutdown risks and growing expectations for multiple Fed rate cuts this year.
The upcoming Fed minutes will be a pivotal catalyst—if the tone leans dovish, gold could accelerate. But any hawkish surprises may provoke a short squeeze or shakeout.
🔎 Technical Analysis (H1 / SMC Style)
• Structure around 4070–4068 marks a premium liquidity zone, likely a sweep or reversal point.
• The lower band 3987–3989 serves as a discount zone / support base from which buyers may re-enter.
• Watch for clean Breaks of Structure (BOS) or Change of Character (ChoCH) on lower timeframes as confirmation.
• Always expect potential liquidity sweeps before major news reactions.
🟢 Buy Zone: 3987–3989
SL: 3980
TP targets: 4000 → 4015 → 4025 → 4040+
🔴 Sell Zone: 4068–4070
SL: 4077
TP targets: 4060 → 4045 → 4030 → 4015
⚠️ Risk Management Tips
• Let the price show intent (reject / sweep / BOS) before jumping in.
• On Fed minutes release, volatility may spike—use partial sizing and tighter trailing stops.
• Avoid trading right at the release; look for reactions and structural confirmation.
✅ Summary
Gold remains bullish structurally, but intraday plays hinge on how markets interpret the Fed minutes. Expect a liquidity sweep around 4068 before potential shorting, and a resilient support zone around 3987–3989 for re-entries aligned with the bigger bullish structure.
🔔 Stay alert for live updates and structure breaks around the Fed minutes to fine-tune entries.

Gold 1H – Bulls Seek Re-Entry Before Fed Minutes💎 XAUUSD – Intraday Trading Plan | Ryan_TitanTrader
📈 Market Context
Gold extends its advance above $4,030 as traders position ahead of this week’s FOMC minutes and key U.S. inflation expectations data. The metal remains supported by persistent geopolitical risk and renewed central-bank demand, while Treasury yields hover near monthly lows.
However, sentiment is mixed after the IMF warned of slower global growth, keeping the dollar steady and prompting potential short-term corrections before continuation.
🔎 Technical Analysis (H1/H4)
Price structure shows a clean Break of Structure (BOS) to the upside following a higher-low formation. The market is currently reacting near premium liquidity at 4068–4066, where a rejection could trigger a retracement toward the discount buy zone at 3969–3971 before resuming the bullish leg.
🟢 Buy Zone: 3969–3971 (Discount Demand / FVG) – potential re-entry area for continuation buyers.
🔴 Sell Zone: 4068–4066 (Premium Liquidity) – possible engineered sweep zone for short-term sellers.
🔑 Key Levels
• BUY Zone: 3969–3971 (main support 3960)
• SELL Zone: 4068–4066 (liquidity pool)
• Psychological Resistance: 4070
• Intraday Pivot: 4035
💡 Trading Scenarios & Plan
🟢 BUY ZONE: 3969–3971
SL: 3960
TP: 3980 – 3990 – 4005 – 4020 – 4035+
🔴 SELL ZONE: 4068–4066
SL: 4075
TP: 4050 – 4035 – 4020 – 4000
⚠️ Risk Management Notes
Expect liquidity sweeps near 4068 before the U.S. session. Wait for lower-timeframe confirmation (ChoCH / BOS) before entry.
Volatility may spike around the Fed minutes, so partial profits and tight stop management are advised.
✅ Summary
Gold remains structurally bullish above 3960, with intraday retracements likely before continuation.
Ryan_TitanTrader anticipates buy reactions around 3970 and short-term rejections at 4068, aligning with the current SMC structure and macro catalysts ahead of FOMC updates.
🔔 Follow Ryan_TitanTrader for live setups, liquidity plays, and real-time gold structure updates!

Gold 1H – Pullback Expected Before Key CPI Data💎 XAUUSD – Intraday Trading Plan | Ryan_TitanTrader
📈 Market Context
Gold is stabilizing below the $4,000 mark as traders await this week’s U.S. CPI data and fresh remarks from the Federal Reserve. After a strong multi-week rally, the metal is showing early exhaustion near premium liquidity zones, where engineered pullbacks often occur before continuation.
While the mid-term bias remains bullish, several analysts — including those from Citi and UBS — caution that gold could face short-term corrections if the dollar regains strength. The market continues to price in around a 65% probability of a December rate cut, keeping volatility elevated and sentiment uncertain.
🔎 Technical Analysis (H1/H4)
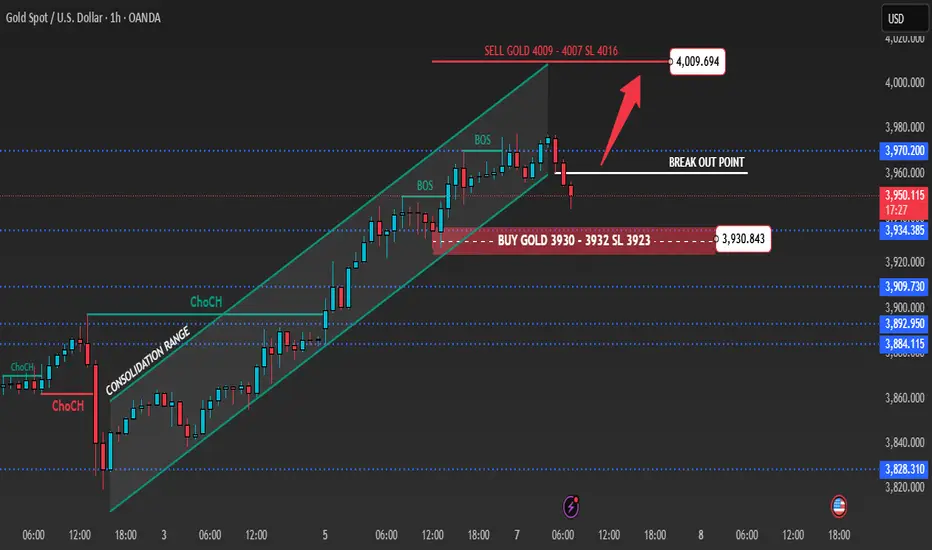
Price has slipped slightly below the ascending channel after consecutive BOS signals, indicating a potential short-term retracement before resuming the uptrend.
🟢 Buy Zone: 3932–3930 (Breakout & FVG zone) – an ideal discount area where buyers may re-enter the market.
🔴 Sell Zone: 4009–4007 (Premium liquidity) – a key region for short setups if price rejects strongly.
🔑 Key Levels
• BUY Zone: 3932–3930 (main support 3923)
• SELL Zone: 4009–4007 (liquidity reaction area)
• Psychological Resistance: 4000
💡 Trading Scenarios & Plan
🟢 BUY ZONE: 3932–3930
SL: 3923
TP: 3945 – 3955 – 3965 – 3975 – 3980+
🔴 SELL ZONE: 4009–4007
SL: 4016
TP: 3995 – 3980 – 3975 – 3965 – 3955
⚠️ Risk Management Notes
The 4000–4010 region acts as a high-liquidity magnet, where false breakouts and engineered sweeps may occur before reversals.
Wait for lower-timeframe confirmation (BOS or rejection candle) before entry.
Avoid overleveraging ahead of CPI — expect volatility spikes and rapid shifts in sentiment.
✅ Summary
Gold remains structurally bullish but vulnerable to intraday retracements near 4009–4007. Ryan_TitanTrader anticipates potential buy reactions from 3932–3930 and short-term rejections near 4009–4007. Holding above 3923 keeps the bullish outlook intact with upside targets toward 3970–3980.
🔔 Follow Ryan_TitanTrader for real-time updates, live setups, and advanced SMC insights as gold reacts to CPI data this week!
Nifty 50 Daily, Trend Based Fibonacci Extension (Natural levels)Hey Traders, I hope you all are doing well in your life.
Market is nature's response and Price is the God.
Let's check the market with the help of natural levels tool : Trend Based Fibonacci Extension .
After forming a ' W ' pattern on Daily chart, Nifty50 has given a pull-back ( base for Fib-Extension level tool, 24587 ).
Most near level is the re-test of 38.2% level ( 24980 ), for a new UP trend ( investors ).
" Buy 🟢 " above 25110 with the stop loss 🔻 of 24980, for the
🎯 Target 1: 25402
🎯 Target 2: 25650
🎯 Target 3: 26260
🎯 Target 4: 26500.
" Sell 🔴 " below 24960 with the stop loss 🔺 of 25110, for the
🎯 Target 1: 24880
🎯 Target 2: 24780
🎯 Target 3: 24680
🎯 Target 4: 24500.
Smart Levels is Smart Trading. 👨🎓
⚠ RISK DISCLAIMER :
All content provided by "TradeWithKeshhav" is for information & educational purposes only.
It does not constitute any financial advice or a solicitation to buy or sell any securities of any type. All investments / trading involve risks. Past performance does not guarantee future results / returns.
Always do your own analysis before taking any trade.
Regards :
@TradeWithKeshhav & team
Happy Trading and Investing!

Gold 1H – Liquidity Plays Between 3794 and 3918Gold on the 1H timeframe is fluctuating within a defined range after multiple ChoCH signals, with liquidity concentrated at both premium supply and discount demand. Current price action suggests engineered sweeps remain likely: upside liquidity sits near 3918–3916, while downside support aligns with 3794–3796. This dual structure sets up both tactical sell and buy plays depending on liquidity grabs.
From the macro perspective, gold traders are balancing caution ahead of upcoming U.S. data releases with the backdrop of a resilient dollar and persistent geopolitical risks. These drivers reinforce intraday volatility, where engineered liquidity hunts at extremes provide clearer opportunities.
⸻
📌 Key Structure & Liquidity Zones (1H):
• 🔴 SELL GOLD 3918–3916 (SL 3925): Premium supply sweep zone. Downside targets at 3896 → 3872 → 3853.
• 🟢 BUY GOLD SUPPORT 3794–3796 (SL 3788): Discount demand aligned with structural lows. Upside targets at 3819 → 3853 → 3872+.
⸻
📊 Trading Ideas (Scenario-Based):
🔻 Sell Setup – Liquidity Grab at 3918–3916
• Entry: 3918–3916
• Stop Loss: 3925
• Take Profits:
• TP1: 3896
• TP2: 3872
• TP3: 3853
🔺 Buy Setup – Discount Demand at 3794–3796
• Entry: 3794–3796
• Stop Loss: 3788
• Take Profits:
• TP1: 3819
• TP2: 3853
• TP3: 3872+
⸻
🔑 Strategy Note
Gold remains liquidity-driven and range-bound, with engineered sweeps expected at both premium highs and discount lows. Flexibility is crucial: fade rallies into the 3918 supply zone, while preparing to scale into longs if liquidity clears into the 3794 demand base.

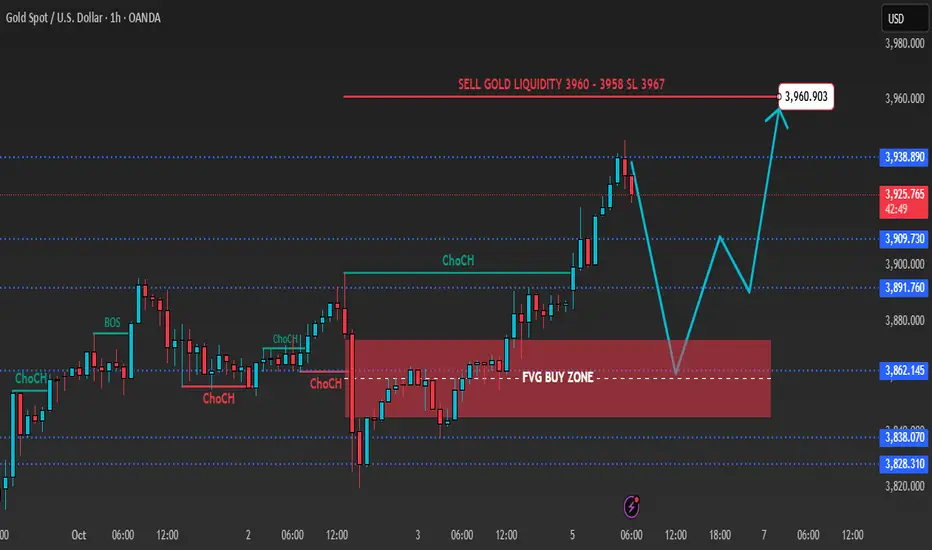
Gold 1H – Will CPI Repricing Push Gold Into FVG Reversal?Gold on the 1H timeframe is reacting near 3,928 after a clean structure break and buildup toward the premium zone 3960–3958, where liquidity remains above recent highs. Market structure shows a bullish impulse leg forming, but engineered sweeps at premium supply are likely before continuation. The defined FVG buy zone around 3840–3842 marks discount territory for potential re-entry if price retraces deeper.
From the macro side, gold is consolidating as traders brace for this week’s U.S. CPI data and renewed Treasury yield volatility. The dollar’s firm tone and cautious risk sentiment following stronger U.S. job figures are keeping gold capped near short-term supply. Still, geopolitical tensions and central-bank demand continue to provide underlying support, reinforcing the buy-on-dip narrative toward year-end.
________________________________________
📌 Key Structure & Liquidity Zones (1H):
• 🔴 SELL GOLD 3960–3958 (SL 3967): Premium liquidity sweep zone targeting retracement toward 3940 → 3900.
• 🟢 BUY ZONE 3840–3842 (SL 3833): Discount demand and FVG mitigation aligned with higher-timeframe support. Upside targets 3860 → 3880 → 3900+.
________________________________________
📊 Trading Ideas (Scenario-Based):
🔻 Sell Setup – Liquidity Sweep at 3960–3958
• Entry: 3960–3958
• Stop Loss: 3967
• Take Profits:
• TP1: 3940
• TP2: 3920
• TP3: 3900
🔺 Buy Setup – FVG Mitigation at 3840–3842
• Entry: 3840–3842
• Stop Loss: 3833
• Take Profits:
• TP1: 3860
• TP2: 3880
• TP3: 3900+
________________________________________
🔑 Strategy Note
Gold remains liquidity-driven within a mid-range structure. Expect engineered sweeps into 3960–3958 before deeper pullbacks into discount demand near 3840–3842. Tactical bias favors fading rallies at premium while preparing to join the continuation move from discount FVG support if CPI-related volatility clears the liquidity pools.
Gold 1H – Will Liquidity Above 3903 Fuel Reversal?Gold on the 1H timeframe is consolidating near 3,872 after multiple ChoCHs, with the next liquidity cluster resting above 3903–3901. Market structure shows engineered liquidity sweeps possible at premium supply, aligning with short-term sell opportunities. On the downside, a defined FVG buy zone and discount demand around 3832–3834 provide scope for continuation if tapped.
From the macro side, traders remain cautious ahead of upcoming U.S. economic data, while a resilient dollar and persistent geopolitical risks in energy markets continue to shape volatility. This backdrop supports tactical plays: fading rallies into premium supply while preparing to join the move from discount demand zones.
________________________________________
📌 Key Structure & Liquidity Zones (1H):
• 🔴 SELL GOLD 3903–3901 (SL 3910): Premium liquidity sweep zone. Downside targets at 3880 → 3860 → 3845.
• 🟢 BUY ZONE SUPPORT 3832–3834 (SL 3825): Discount demand aligned with FVG mitigation. Upside targets at 3855 → 3875 → 3890+.
________________________________________
📊 Trading Ideas (Scenario-Based):
🔻 Sell Setup – Liquidity Sweep at 3903–3901
• Entry: 3903–3901
• Stop Loss: 3910
• Take Profits:
• TP1: 3880
• TP2: 3860
• TP3: 3845
🔺 Buy Setup – FVG Mitigation at 3832–3834
• Entry: 3832–3834
• Stop Loss: 3825
• Take Profits:
• TP1: 3855
• TP2: 3875
• TP3: 3890+
________________________________________
🔑 Strategy Note
Gold remains range-bound but liquidity-driven. Expect engineered sweeps above 3903 before deeper corrections, while discounted dips into 3832–3834 offer potential continuation setups. Flexibility is key: fade rallies at premium, but scale into buys if liquidity clears into discount demand.

Gold 1H – Correction or Continuation After Supply Test?Gold on the 1H timeframe is trading near 3,861 after consolidating below a premium supply zone at 3876–3874. Structure shows a recent BOS to the upside, but current rejection signals potential engineered liquidity sweeps into the nearby FVG and discount demand zones. The first support rests at 3796–3798, aligning with discount territory and previous accumulation, offering scope for continuation if price reacts positively.
From the macro side, today’s headlines point to persistent U.S. dollar strength as traders await fresh Federal Reserve guidance on inflation and rate path. Meanwhile, heightened geopolitical concerns in energy markets are maintaining safe-haven flows, adding volatility to gold’s intraday swings.
This dual backdrop sets up a tactical approach: fading rejections at supply while being prepared to enter on discounted dips at demand.
________________________________________
📌 Key Structure & Liquidity Zones (1H):
• 🔴 SELL GOLD 3876–3874 (SL 3883): Premium supply zone, downside targets at 3850 → 3835 → 3815.
• 🟢 BUY ZONE SUPPORT 3796–3798 (SL 3790): Discount demand zone aligned with BOS, upside targets at 3820 → 3845 → 3860+.
________________________________________
📊 Trading Ideas (Scenario-Based):
🔻 Sell Setup – Supply Rejection (3876–3874)
• Entry: 3876–3874
• Stop Loss: 3883
• Take Profits:
TP1: 3850
TP2: 3835
TP3: 3815
🔺 Buy Setup – Demand Mitigation (3796–3798)
• Entry: 3796–3798
• Stop Loss: 3790
• Take Profits:
TP1: 3820
TP2: 3845
TP3: 3860+
________________________________________
🔑 Strategy Note
Gold remains in a corrective phase after testing supply. Expect liquidity sweeps into discount levels before continuation. With the dollar strengthening and Fed commentary in focus, intraday traders should:
• Fade supply rejections at 3876–3874.
• Scale into buys around 3796–3798 if liquidity is cleared.

Gold 1H – Will the Breakout from Range Sustain?Gold on the 1H timeframe has broken out of its previous consolidation range and is now testing a premium supply zone near 3828–3826. The structure shows a clear BOS after the range, supported by strong bullish momentum. However, engineered liquidity sweeps remain likely before the market establishes sustained direction.
From the macro side, today’s headlines highlight persistent inflation worries and a stronger U.S. dollar as traders anticipate upcoming remarks from Federal Reserve officials. Geopolitical tensions in energy markets have also underpinned safe-haven flows, adding volatility to gold price action.
This alignment of macro drivers and technical liquidity pools suggests two tactical scenarios: fading rejections at supply while preparing to buy dips into the defined demand zone.
________________________________________
📌 Key Structure & Liquidity Zones (1H):
• 🔴 SELL GOLD 3828–3826 (SL 3835): Premium supply zone with upside liquidity sweep potential, offering downside targets at 3810 → 3790 → 3775.
• 🟢 BUY GOLD 3757–3759 (SL 3750, Demand Zone): Discount demand area aligned with BOS, with upside targets at 3765 → 3780 → 3795+.
________________________________________
📊 Trading Ideas (Scenario-Based):
🔻 Sell Setup – Supply Rejection (3828–3826)
• Entry: 3828–3826
• Stop Loss: 3835
• Take Profits:
TP1: 3810
TP2: 3790
TP3: 3775
🔺 Buy Setup – Demand Mitigation (3757–3759)
• Entry: 3757–3759
• Stop Loss: 3750
• Take Profits:
TP1: 3765
TP2: 3780
TP3: 3795+
________________________________________
🔑 Strategy Note
Gold remains volatile after breaking out of consolidation. Expect engineered sweeps into both supply and demand zones before directional clarity develops. With macro headlines keeping the dollar firm and inflation risks alive, traders should watch for sharp intraday reversals:
• Fade supply rejections if momentum stalls at 3828–3826.
• Buy dips into demand if liquidity is swept cleanly around 3757–3759.
The broader narrative supports a two-sided strategy until the Fed provides clearer guidance.

Traders Watch Gold Surge Ahead of Fed’s Next MoveGold 1H – Consolidation Before Fed Clarity
Gold on the 1H timeframe is currently trading around 3,746, moving within a well-defined consolidation range. Price action highlights a premium supply zone at 3,775–3,773 and a discount demand zone at 3,723–3,725. The market structure shows earlier signs of BOS and ChoCH, with engineered liquidity sweeps becoming evident. A potential Mitigation → Expansion sequence is in play, where a liquidity grab near discount demand could fuel a bullish leg toward premium supply.
From a macro perspective, today’s headlines underscore the cautious stance across financial markets as investors await the Federal Reserve’s upcoming guidance. Lingering inflationary concerns, coupled with speculation around the timing of future rate cuts, have kept volatility elevated. Meanwhile, geopolitical risks continue to underpin safe-haven demand for gold, adding an extra layer of support at discount levels.
This combination of technical liquidity zones and macro uncertainty sets the stage for tactical plays: fading moves into the supply zone while remaining prepared for dip-buying opportunities at defined demand areas.
________________________________________
📌 Key Structure & Liquidity Zones (1H):
• 🔴 SELL GOLD 3,775–3,773 (SL 3,782): Supply zone coinciding with a buy-side liquidity pool above 3,780, offering downside targets at 3,760 → 3,745 → 3,730.
• 🟢 BUY GOLD 3,723–3,725 (SL 3,718): Discount demand aligned with liquidity grab potential, with upside targets at 3,745 → 3,760 → 3,775+.
________________________________________
📊 Trading Ideas (Scenario-Based):
🔻 Sell Setup – Supply Rejection (3,775–3,773)
• Entry: 3,775–3,773
• Stop Loss: 3,782
• Take Profits:
TP1: 3,760
TP2: 3,745
TP3: 3,730
🔺 Buy Setup – Demand Mitigation (3,723–3,725)
• Entry: 3,723–3,725
• Stop Loss: 3,718
• Take Profits:
TP1: 3,745
TP2: 3,760
TP3: 3,775+
________________________________________
🔑 Strategy Note
With the Fed’s next move looming, traders should anticipate engineered sweeps into both premium and discount liquidity pools before the market establishes clearer direction. The tactical edge comes from aligning intraday setups with liquidity hunts:
• Fade supply at 3,775–3,773 if rejection confirms.
• Buy dips into 3,723–3,725 if liquidity is swept cleanly.
The broader narrative of inflation concerns, dollar sensitivity, and safe-haven flows reinforces the case for two-sided opportunities. Expect gold to remain volatile within this consolidation range, with sharp moves likely as liquidity is targeted ahead of Fed clarity.

Gold 1H – Will Gold Correction Extend Toward Discount Zones?Gold on the 1H timeframe is trading close to 3,745 after a series of bearish pushes, with premium resistance placed at 3,780–3,778 and another resistance pocket at 3,748–3,746. On the downside, discount demand is noted at 3,713–3,706, with a deeper support near 3,665. Recent CHoCH signals highlight short-term bearish bias, indicating that liquidity sweeps into resistance zones may occur before price retraces towards discount areas.
Today’s headlines around renewed U.S. inflation concerns and expectations of a slower Fed pivot are dampening sentiment, while geopolitical tensions in the Middle East continue to support safe-haven bids. This combination is likely to keep intraday volatility elevated, with liquidity grabs around resistance zones expected before a clearer directional move emerges.
________________________________________
📌 Key Structure & Liquidity Zones (1H):
• 🔴 SELL GOLD LIQUIDITY 3,780–3,778 (SL 3,787): Premium resistance where sweeps may trigger rejection toward 3,760 → 3,740 → 3,730.
• 🔴 SELL GOLD 3,748–3,746 (SL 3,755): Intraday resistance aligned with 0.5–0.618 retracement, targeting 3,730 → 3,720 → 3,715.
• 🟢 BUY ZONE 3,697–3,699 (SL 3,692): Discount demand with liquidity confluence, offering upside targets at 3,715 → 3,730 → 3,745+.
________________________________________
📊 Trading Ideas (Scenario-Based):
🔻 Sell Setup – Liquidity Run (3,780–3,778)
• Entry: 3,780–3,778
• Stop Loss: 3,787
• Take Profits:
TP1: 3,760
TP2: 3,740
TP3: 3,730
🔻 Sell Setup – Intraday Rejection (3,748–3,746)
• Entry: 3,748–3,746
• Stop Loss: 3,755
• Take Profits:
TP1: 3,730
TP2: 3,720
TP3: 3,715
🔺 Buy Setup – Discount Demand (3,697–3,699)
• Entry: 3,697–3,699
• Stop Loss: 3,692
• Take Profits:
TP1: 3,715
TP2: 3,730
TP3: 3,745+
________________________________________
🔑 Strategy Note
With U.S. inflation concerns and geopolitical risks creating mixed drivers for gold, intraday strategies can look to fade liquidity sweeps into premium resistance while keeping an eye on buy opportunities from well-defined discount demand zones. Expect sharp moves around 3,780 liquidity grabs before corrections extend down into the 3,713–3,706 area.
