GOLD 29/08: Monthly Candle Closing. DON’T BUY FOMOGold is sitting at a crucial level. As the monthly candle closes, traders must avoid emotional entries. With Smart Money Concepts (SMC) and Elliott Wave Theory, here are the clear trading zones to watch.
🔎 Market Structure (SMC + Elliott)
Elliott Wave: Waves III – IV – V completed. Wave V hit the D1 trendline, showing signs of exhaustion.
SMC Insights:
Multiple BMS (Break of Market Structure) → institutional liquidity play.
EQH (Equal Highs) & EQL (Equal Lows) → liquidity pools ready to be taken.
Demand Zones:
3398 – 3396 (EQH + BMS support)
3372 – 3370 (EQL / deep liquidity sweep)
Resistance: D1 trendline remains the key dynamic cap.
📌 Trading Plan
Scenario 1 – Short-term Sell (Counter-trend):
Entry: 3319 – 3321
SL: 3327
Target: 3398 – 3396
Scenario 2 – Buy at Demand Zone 1 (Main Setup):
Entry: 3398 – 3396
SL: 3390
Target: 3410 – 3415
Scenario 3 – Buy at Demand Zone 2 (Deeper Sweep):
Entry: 3372 – 3370
SL: 3365
Target: 3400 – 3410
✅ Best Risk–Reward setup with liquidity sweep + Elliott retracement.
✅ Conclusion
Bias: Still bullish in the bigger picture.
Risk: Expect liquidity sweeps before continuation.
Advice: Don’t chase price. Wait for demand zone confirmations.
Focus: Safer buys from 3398–3396 or 3372–3370 instead of impulsive FOMO buys near highs.
Dailytrading

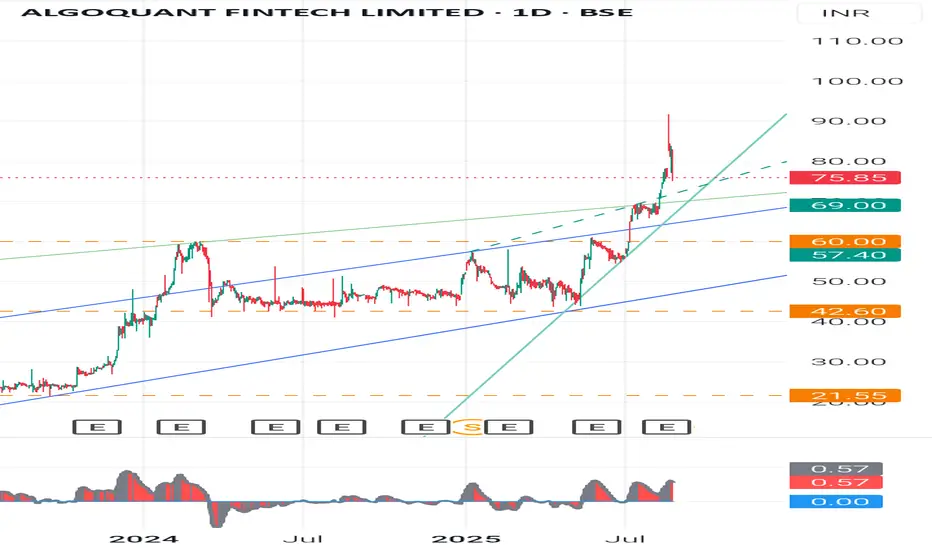
Stock Analysis - chart pattern analysis & fundamepinchStock Analysis - step by step for Algoquant Fintech Ltd.
Chart & Price Action Analysis (Weekly Chart)-:
-Current Price: 78.95 (-3.84%)
+Recent Move: Stock gave a strong breakout above its long consolidation channel ( 42- 69).
-Candlestick: The latest candle is a long wick candle after a strong breakout - This signals profit booking after a sharp rally.
- Support Levels
69 - Recent breakout retest zone
60 - Strong support from previous swing highs
42.6 - Major base support (long-term)
- Resistance Levels
85- 88 - Immediate resistance (due to long upper wick supply)
100+ - Psychological round level
120 - Next major target if momentum sustains
🕯️ Candlestick & Swing Analysis
Pattern: Breakout candle with long wick - suggests short-term profit booking, but trend remains positive.
Swing Trend: Stock formed higher highs & higher lows since mid-2023, a sign of strong uptrend.
Risk: If it falls below 69 on weekly closing, trend may weaken.
- Fundamental Comparison (with Fintech peers like Infibeam Avenues, IndiaMart, and small fintech players)
Metric Algoquant Fintech Infibeam Avenues IndiaMart Intermesh
P/E Ratio Very High (Loss-making / low EPS stage) -38x -45x
Revenue Growth Very high (small base effect) Moderate Stable
Debt Low Low Very Low
Business Stage Emerging (High growth, high risk) Mid-sized, stable Established, B2B stronghold
👉 Learning: Algoquant is in an early stage compared to peers - higher growth potential but also higher risk.
📘 Basic Learnings for Students (Investment Education)
1. Candlestick Learning - Long upper wicks after breakout = profit booking - watch for retest of breakout levels.
2. Swing Analysis - Trend is up as long as higher highs-higher lows structure is maintained.
3. Chart Pattern - Breakout from long channel = momentum can continue if volumes sustain.
4. Fundamental Insight - Always compare with industry peers on P/E, revenue growth, debt, margins.
5. Risk Management - In emerging companies, volatility is high. Always keep a stop-loss.
⚠️ Disclaimer
This analysis is for educational purposes only. It is not investment advice. Stock markets are subject to risks. Please do your own research (DYOR) or consult a SEBI-registered advisor before investing.
#Algoquant #FintechStocks #StockMarketIndia #TechnicalAnalysis #CandlestickPatterns #SwingTrading #InvestingForBeginners #FundamentalAnalysis #StockMarketEducation #DYOR
18/07 Gold Outlook – Final Friday Liquidity Moves Ahead!🟡 Gold Outlook – Final Friday Liquidity Moves Ahead!
Will Gold maintain its bullish pace or face weekend volatility? Stay ahead of the market!Why Gold is Moving – Key Macro Drivers
Gold bounced back sharply after a dip caused by stronger-than-expected US economic data. Here’s what Indian traders need to keep in mind:
📊 Rate cut hopes remain high as US core inflation remains sticky.
💣 Middle East tensions continue, with Israel launching more airstrikes on Syria.
🌐 Trade war risks increase as EU threatens $84B in tariffs on US goods.
🟡 Gold is acting as a safe haven in times of inflation concerns and global uncertainty.
👉 All of these factors support gold’s upside — especially heading into the weekend when low liquidity can cause price swings.
📉 Technical Picture – Zones in Play
Gold reversed from FLZ H2 (3310) — a key liquidity and demand zone. Sellers took profits, triggering a surge in buy volume. The price has since tested the OBS Sell Zone + Continuation Pattern (CP) around 334x with strong resistance.
Today, we expect price to revisit lower liquidity pools on the M30–H2 timeframe before the next breakout.
🧭 Key Levels for Friday – Watch Closely
✅ Buy Zone: 3318 – 3316
SL: 3312
TP Targets: 3322 – 3326 – 3330 – 3335 – 3340 – 3345 – 3350 – 3360
💼 Scalp Buy Zone: 3326 – 3324
SL: 3320
TP: 3330 – 3335 – 3340 – 3345 – 3350 – 3360
⚠️ Sell Zone: 3363 – 3365
SL: 3370
TP: 3360 – 3355 – 3350 – 3346 – 3342 – 3338 – 3335 – 3330
🔔 Important Notes for Indian Traders
Today is Friday, and even though there’s no major economic news, the risk of liquidity sweeps and volatility is high. Protect your capital with solid risk management and stick to your TP/SL strategy.
📌 Plan your entries from strong technical zones and don’t chase price — let the market come to you.

SYMPHONY TRIANGLE PATTERN INTRADAY TRADE The stock has formed TRIANGLE PATTERN pattern on the
15 MINUTES TIME FRAME chart.
One can enter above 1740 with a strict Stoploss of 1696
Target 1 - 1770
Target 2 - 1800
Target 3 - 1820
#INTRADAY TRADE
What is your view please comment it down and also boost the idea this help to motivate us. All views shared on this channel are my personal opinion and is shared for educational purpose and should not be considered advise of any nature.

JAYAGROGN - Breakout 850+ daysDetailed View about this Breakout:
No.of Resistance: 6
No.of Support: 8
Consolidation days : 850+ days
I Post educational chart for 3 Swing / Potential Stocks Everyday.
Check Related Ideas section for more Swing Stock analysis.

Zomato Ltd (ZOMT) break out Zomato Ltd (ZOMT) break out level 1Hr daily chart pattern
BUY above 62.50
Volume break out with storng volume and momentum.
Time to go long in Zomato
Thank you.
