THANGAMAYIL: Breakout Retest Holds | Price & Volume SpeakTimeframe: Daily
Stock: THANGAMAYIL
Market: NSE
📦 Base → Breakout
Price spent multiple weeks inside a well-defined consolidation box, indicating balance and accumulation.
On 07 January 2026, price cleanly broke above this range with strong bullish expansion and clear volume participation — confirming buyer initiative.
🔁 Retest With Clear Rejection (21 January 2026)
Price revisited the breakout zone today and formed a bullish rejection candle on the daily timeframe.
Important clarity:
This is not a perfect bullish hammer
It is not a textbook dragonfly doji
However, the lower rejection wick is long and decisive enough to confirm rejection of lower prices
Price acceptance above the breakout zone is what matters — not candle names.
📊 Volume Validates the Move
Breakout → high volume
Retest → even higher volume
This indicates strong absorption of supply and confirms that buyers defended structure aggressively.
🎯 Trade View (Price-Based)
Swing Trade
Stop Loss: Below today’s retest candle low
Positional Trade
Stop Loss: ₹2970 (lower boundary of the earlier consolidation box)
Targets
₹4150 as first objective
Thereafter, trail stops and ride the trend
Suitable for swing and positional traders.
✅ Summary
No indicators.
No news.
No opinions.
Just structure, breakout, retest, rejection, and volume.
📌 Disclaimer
This is not financial advice.
Shared strictly for educational and analysis purposes.
Please manage risk responsibly and trade as per your own plan.
👍 If you found this useful, consider boosting 👍 and following for more clean price–volume setups.
💡 Feel free to suggest stocks or structures you’d like me to analyse next.
Darvasbox

NACL Inds cmp 167.40 by Daily Chart viewNACL Inds cmp 167.40 by Daily Chart view
- Support Zone 150 to 160 Price Band
- Resistance Zone 174 to 184 Price Band
- Considerate Darvas Box Setup with Bullish Rounding Bottoms
- Technical Indicators seems like turning to a positive momentum

HLE Glascoat cmp 436.50 by Daily Chart viewHLE Glascoat cmp 436.50 by Daily Chart view
- Support Zone 406 to 433 Price Band
- Resistance Zone 467 to 494 Price Band
- Volumes in close sync with average traded quantity
- Falling Resistance Trendline Breakout seems sustained
- Darvas Box setup repeated, hope for price trend upside

Sai Life Sciences cmp 921.70 by the Daily Chart view since listeSai Life Sciences cmp 921.70 by the Daily Chart view since listed
- Support Zone 865 to 895 Price Band
- Resistance Zone 923 to ATH 943 Price Band
- Volumes are regularly spiking well above the average traded quantity
- Darvas Bos Setup seems like repeated basis the current technical chart setup
- Rising Price Channels are in good sync to each other at ending and fresh new start
- Considerate Bullish Rounding Bottoms and/or Rising VCP pattern, as one may interpret
- Darvas Box Setup : Stock trending within 845 to ATH 943 price band since ATH on 25-Aug-2025

IRIS Clothing cmp 35.66 by Weekly Chart viewIRIS Clothing cmp 35.66 by Weekly Chart view
- Support Zone 28 to 31 Price Band
- Resistance Zone 36.50 to ATH 40.71 Price Band
- Volumes above average traded quantity over past 2 weeks
- Darvas Box - Price trending between 30 to 35.50 since June 2025
- Long Bullish Rounding Bottom followed by small one's made within Darvas Box

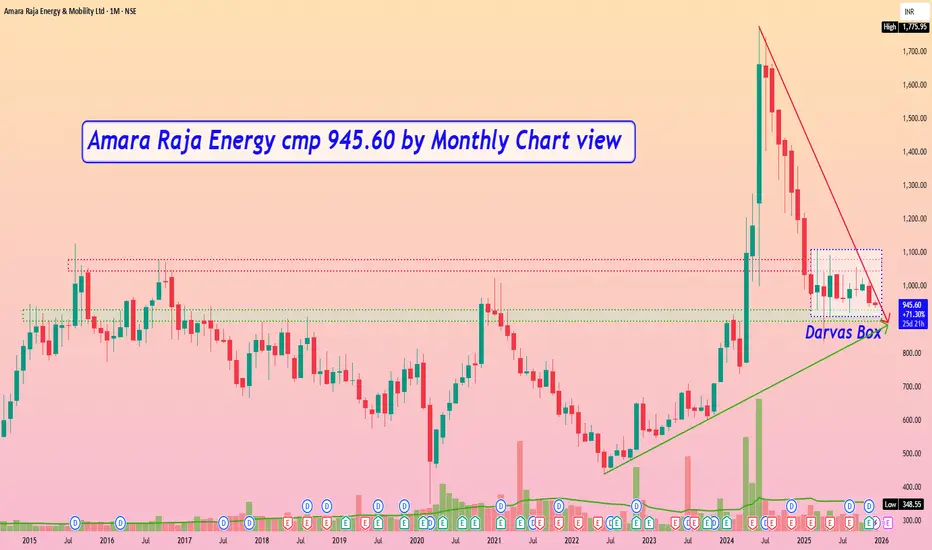
Amara Raja Energy cmp 945.60 by Monthly Chart viewAmara Raja Energy cmp 945.60 by Monthly Chart view
- Support Zone 895 to 930 Price Band
- Resistance Zone 1045 to 1080 >> 1110 Price Band
- Volumes seen closely flat to falling since hitting ATH in June 2024
- Volumes indicate consolidation and accumulation since February 2025
- Darvas Box : Price trending within 910 to 1110 range since February 2025
- Support Zone well respected over past few months but Price retracing at the Resistance Zone
MAN IND, DARVAX BOX BREAKOUTMAN IND 465 good Darvax box breakout happening backed up by volumes.
support near 435-438 range while target expected 490 to 520 first.

MARUTI, DARVAS BOX BREAKOUTBUY MARUTI 13400 TILL 13100 for 13650/14200 in short term. Clear Darvas box breakout happening with volumes. Stock after multi year breakout above 10000 is now heading towards 18500 as medium term investment bet (Fibonacci extension levels)

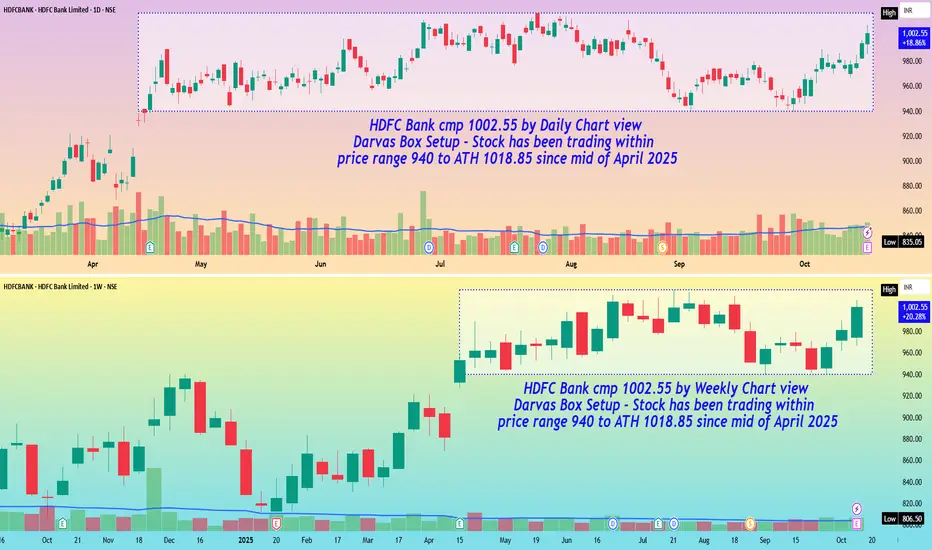
HDFC Bank cmp 1002.55 by Daily and Weekly Chart viewHDFC Bank cmp 1002.55 by Daily and Weekly Chart view
- Darvas Box Setup : Stock has been trading within price range 940 to ATH 1018.85 since mid of April 2025
- Stock chart has made Bullish Rounding Bottoms on both timeframes providing a technically logical upside target of +/- 1100 in the near future
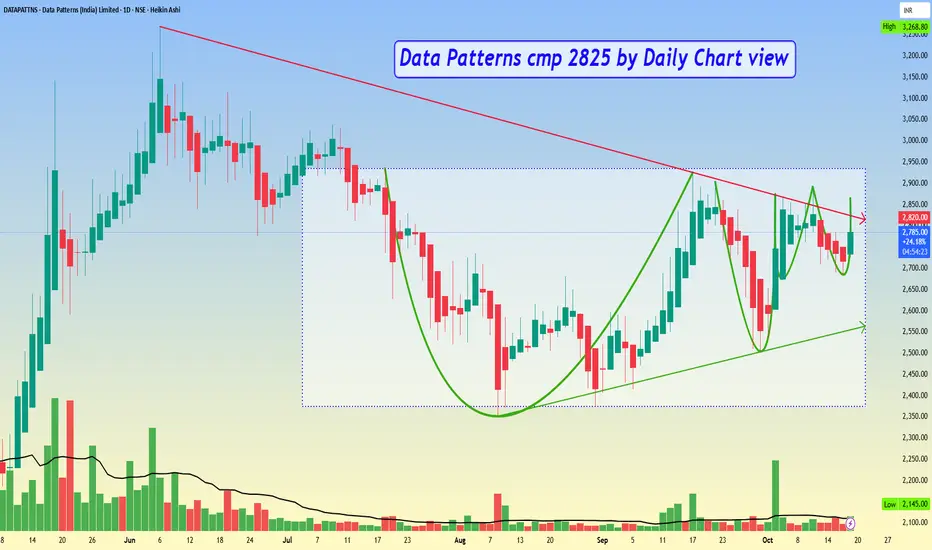
Data Patterns cmp 2825 by Daily Chart viewData Patterns cmp 2825 by Daily Chart view
* Support Zone 2585 to 2685 Price Band
* Resistance Zone 2935 to 3065 Price Band
* Stock has made a near tight and contracting VCP pattern
* Falling Resistance Trendline Breakout in the making process
* Darvas Box pattern with price trending between 2375 to 2935
* Bullish Rounding Bottom formed by the Resistance Zone neckline
* Volumes spiking intermittently by good numbers over past few weeks
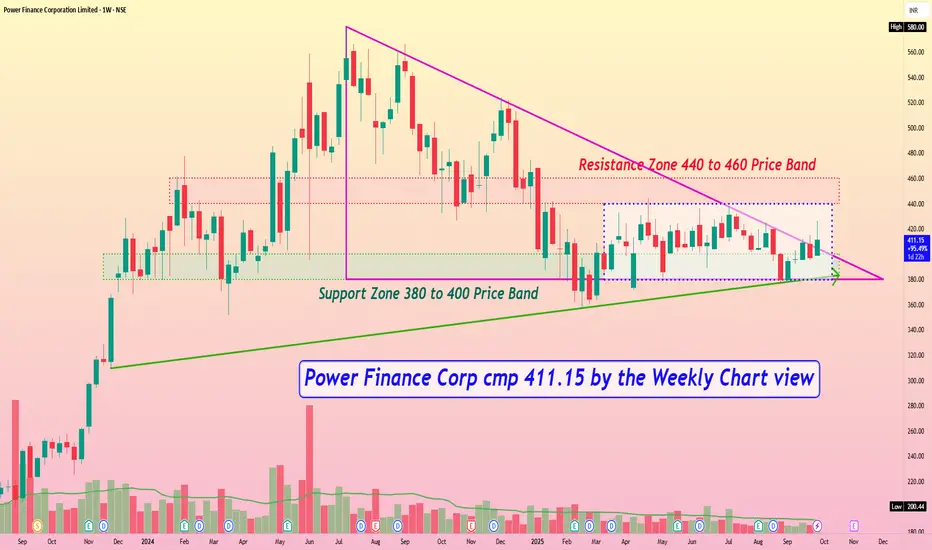
Power Finance Corp cmp 411.15 by the Weekly Chart viewPower Finance Corp cmp 411.15 by the Weekly Chart view
- Support Zone 380 to 400 Price Band
- Resistance Zone 440 to 460 Price Band
- Price traversing within Descending Triangle pattern after ATH
- Rising Support Trendline well respected by touch points since close to 2 years
- Price seen majorly trending inside Darvas Box since Mar 2025 in a range of 380 to 440
- Volumes in close sync with avg traded qty on Daily Chart and in steady stream by Weekly Chart
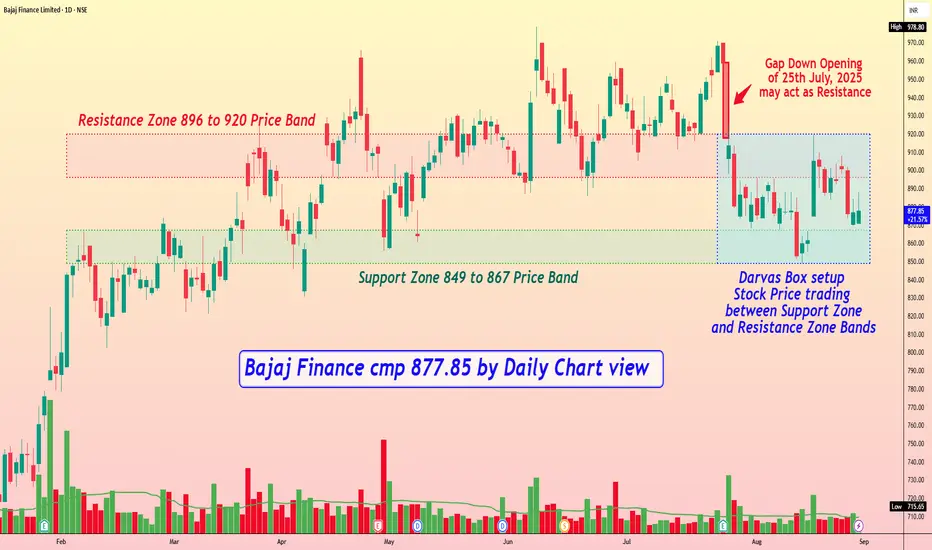
Bajaj Finance cmp 877.85 by Daily Chart viewBajaj Finance cmp 877.85 by Daily Chart view
- Support Zone 849 to 867 Price Band
- Resistance Zone 896 to 920 Price Band
- Gap Down Opening of 25th July, 2025 may act as Resistance
- Volumes in close sync with the average traded quantity over the past few days
- Darvas Box setup : Stock Price trading between Support Zone and Resistance Zone Bands
- Most of the Technical Indicators BB, EMA, MACD, RSI seem getting in the positive momentum
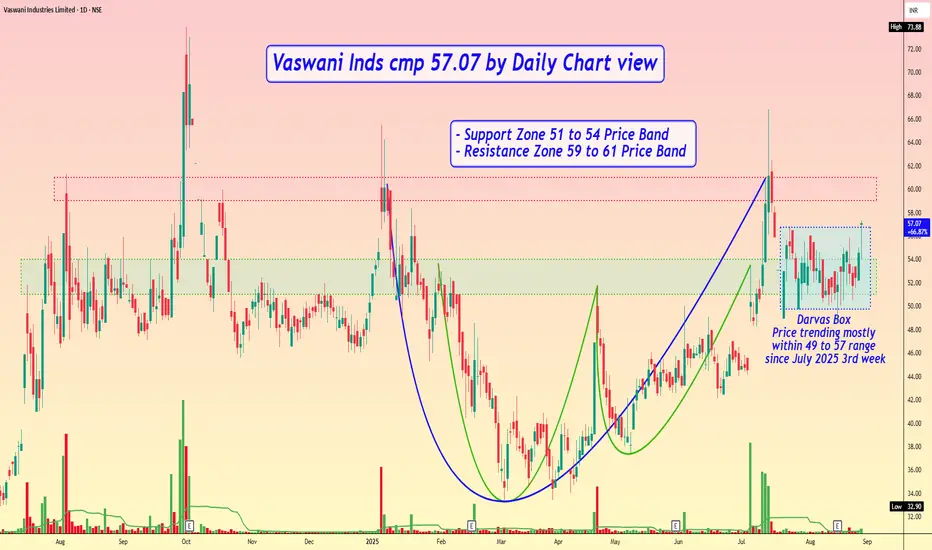
Vaswani Inds cmp 57.07 by Daily Chart viewVaswani Inds cmp 57.07 by Daily Chart view
- Support Zone 51 to 54 Price Band
- Resistance Zone 59 to 61 Price Band
- Volumes are in good sync with average traded quantity
- Bullish Rounding Bottoms made by Support Zone neckline
- Another Large Bullish Rounding Bottom made by Resistance Zone neckline
- Darvas Box - Price trending mostly within 49 to 57 range since July 2025 3rd week
HeranbaSwing Trade -
Look interesting at current level - still closing pending
If today close above break out level
Maybe we can see Good move upside.
Risk around 8-10% around
Target next resistance

GODREJAGRO – Base Breakout Attempt | Sector Tailwind📈 GODREJ AGROVET (GODREJAGRO) – Base Breakout Attempt | Sector Tailwind
🔍 Technical Overview:
Attempting a breakout from a broad base structure.
Entry: Above ₹814 only if accompanied by strong volume.
Current volume is picking up, but a decisive spike is still awaited for confirmation.
A VCP (Volatility Contraction Pattern) was forming earlier, but recent market volatility disturbed the structure — hence, wait for a clean breakout.
📊 Price Levels:
📍 Entry Trigger: ₹814+
📍 Stop Loss: ₹734.50 (around 10% risk, on closing basis)
📍 First Resistance / Target: ₹879.50 (previous ATH)
🎯 Strategy:
Position Sizing is crucial. Risk 1–1.5% of your capital depending on your style.
Gradual buying is advised. Avoid full allocation on a single entry.
Add on strength if price crosses ₹879.50 cleanly with strong volume.
🌾 Sector Outlook:
Agro / Fertilizer / Agrochem sectors are showing early strength amid broader market uncertainty.
Tailwinds include food security, rural demand, and government focus on the agri sector.
🌐 Macro View:
2025 remains highly unstable globally (geopolitical tensions, macro uncertainty).
Shakeouts and pullbacks are common — hence, disciplined risk management is imperative.
"In unstable markets, discipline is your best edge. Protect your capital, let opportunities come to you."
⚠️ Disclaimer: This analysis is for educational purposes only and not a recommendation to buy or sell. Always do your own research or consult your financial advisor before investing. Manage your risk as per your trading style.

Welspun Corp Ltd - Breakout Trade Setup📌 Trade Plan
📈 Entry: Above ₹892
📉 Stop Loss (SL): ₹758 (Closing Basis) (Risk: ~15% from entry)
🔄 Retest Level to Watch: ₹844 (Wait for a retest for further addition)
📍 CMP: ₹872
📌 Why This Setup is Interesting?
✅ Strong Uptrend – Higher High (HH) & Higher Low (HL) structure intact
✅ Resilient Stock – Minimal decline during market corrections
✅ Base Breakout – Consolidated for 7 months, now breaking out
✅ No Overhead Resistance – Trading in open space with no historical supply
✅ Above Key DMAs – Trading above critical moving averages
✅ Channel Structure – Stock is inside a rising channel; 📌 Channel top might act as resistance
✅ Breakout Volume – Today’s volume confirms strength
📌 Market Context & Risks ⚠️
⚠️ Nifty & Overall Market just closed above the 50 DMA but is still weak. Wait for 200 DMA reclaim for confirmation.
⚠️ Breakouts are risky in a fragile market. FOMO can be costly—trade with patience.
⚠️ Position Sizing is Key! – Do not go all in; start small and scale gradually. If the market corrects and the stock remains strong, add later.
📌 Fundamental Snapshot 📊
Market Cap: ₹22,865 Cr
Stock P/E: 15.4
Book Value: ₹230
Dividend Yield: 0.61%
ROCE: 20.2%
ROE: 19.8%
Face Value: ₹5
📈 Pros:
✔️ Reduced Debt
✔️ Healthy Dividend Payout (34.9%)
✔️ Improving Sales YoY
⚠️ Cons:
❌ Stock trades at 3.51x Book Value
❌ Low ROE (11.5%) over the last 3 years
❌ Earnings include ₹873 Cr of other income
🛑 Disclaimer:
This is not financial advice. Risk management is crucial – ensure proper position sizing & stop-loss discipline. The market is still fragile, and breakouts can fail. Always do your own research before taking any trade. 🚀

Narayana Hrudayalaya Ltd - Trade Setup📊 Trade Plan:
Ideal Entry: ₹1,455 (Breakout level)
Current Entry: Small position above ₹1,701, wait for a possible retest to ₹1,455
Stop Loss: ₹1,290 (Closing basis)
Risk Percentage (From ₹1,701 to ₹1,290): 24.15%
Target: To be assessed post-retest confirmation
📈 Why This Stock?
✅ Strong Volume Spike: Recent breakout was supported by 4x-5x volume surge
✅ Broke Out of Consolidation: Now sustaining above previous range
✅ Resilient to Market Correction: Held strong despite broader weakness
✅ Trading Above Key DMAs: Indicates bullish structure
✅ Trading Inside a Strong Uptrend Channel: Stock has been respecting the trendline consistently
✅ RSI in Healthy Zone: Indicating potential room for further upside
✅ Clear Higher Highs & Higher Lows: Confirms the bullish momentum
📊 Key Fundamentals:
Market Cap: ₹33,616 Cr
Current Price: ₹1,645
52-Week High/Low: ₹1,692 / ₹1,080
Stock P/E: 42.9 (Relatively Low vs Sector Peers)
Book Value: ₹157
Dividend Yield: 0.24%
ROCE: 26.5% (Strong Capital Efficiency)
ROE: 31.4% (Healthy Profitability)
⚠️ Risks Involved:
❌ Deep Stop Loss (24.15%) – Requires high conviction, not suitable for short-term traders
❌ Potential Retest of ₹1,455 – Need to watch for confirmation before aggressive entry
❌ Sector Sensitivity: Hospitals & healthcare stocks can be affected by regulatory changes
🚨 Disclaimer:
⚠️ This is not financial advice. The trade involves high risk (24.15% SL) and we are trading against the broader trend. Ensure you do your own analysis and manage risk appropriately before taking any position. Trade cautiously! 🚀

India Shelter Finance (NSE:INDIASHLTR) - Early Breakout Alert📌 Trade Setup:
Entry: Above ₹811 (Preferably wait for a daily close above this level).
Stop Loss: ₹699 (Closing basis).
Target: ₹1,050+ (Positional).
Risk-Reward Ratio (R:R): ~2.0+ (Depending on entry confirmation).
📊 Technical Overview:
✅ The stock has been consolidating in a base and is attempting a breakout today.
✅ The candle structure looks strong and wide, indicating momentum.
✅ RSI is in a good zone, signaling strength.
✅ Trading above 200 DMA and 50 DMA, indicating bullish structure.
✅ The finance sector is showing early signs of recovery.
💡 Volume is key! While there's a slight improvement, we need stronger volume confirmation for conviction.
📈 Key Fundamentals:
Metric Value
Market Cap ₹8,770 Cr.
Current Price ₹813
Stock P/E 25.3
Book Value ₹231
Dividend Yield 0.00%
ROCE (Return on Capital Employed) 12.2%
ROE (Return on Equity) 14.0%
Face Value ₹5.00
💡 Fundamental View: The stock is trading at a P/E of 25.3, which is reasonable for a growing financial company. ROE of 14% and ROCE of 12.2% indicate decent profitability. No dividend yield as the company is focused on growth.
⚠️ Risk Considerations:
🚨 This is a counter-trend trade! The broader market is still uncertain, so we are taking a test position, NOT an aggressive bet.
🚨 This is NOT a guaranteed move up. The trade idea is to alert about a potential mover once the dust settles.
🚨 Risk management is crucial. Do NOT go all-in, thinking the market has found a bottom. Another round of fall is still possible.
📌 Trade Plan:
Buy in small quantities above ₹811 and wait for follow-through confirmation or a potential retest.
If the breakout sustains, consider adding more positions gradually.
If the stock closes below ₹699, exit.
📌 Do your due diligence! This is an early-stage breakout attempt, and risk-reward should be managed carefully. 🚦
📢 Disclaimer:
This analysis is for educational purposes only and NOT financial advice. Stock markets are subject to risks, and past performance does not guarantee future results. Do your own research before making any investment decisions. 🚨

Nicholas Darvas: The Dancer Who Became a Trading Legend!Hello Traders! Imagine going from being a professional dancer to one of the most successful traders of all time! That’s the story of Nicholas Darvas , a self-taught trader who turned $25,000 into $2.25 million in just a few years using his famous Darvas Box Trading Strategy . His journey proves that you don’t need to be a Wall Street expert to make it big in trading! Let’s dive into his trading principles and strategy.
1. Who Was Nicholas Darvas?
Darvas was a professional dancer who stumbled into the stock market while touring the world.
He developed a technical approach to trading , known as the Darvas Box Theory , which helped him ride strong trends and avoid noise.
Without any insider knowledge, he used chart patterns, price momentum, and volume breakouts to make millions in the market.
2. Darvas’ Key Trading Principles
Follow the Trend: Darvas only bought stocks in strong uptrends. He believed in riding momentum rather than predicting reversals.
Ignore Market Noise: He didn’t listen to news, tips, or opinions —only price action and volume mattered to him.
Let Winners Run, Cut Losers Quickly: He never sold his winning stocks early and immediately exited losing trades without hesitation.
Use Stop-Losses & Protect Capital: Darvas always set stop-losses below key levels to avoid deep losses.
Only Trade High-Volume Stocks: He focused on stocks that showed strong volume spikes, as these indicated institutional interest.
3. The Darvas Box Trading Strategy
Identify a Stock in a Strong Uptrend: Darvas looked for stocks that were consistently making new highs with rising volume.
Draw a "Box": He identified support and resistance levels , creating a box around price action.
Buy on Breakout: He entered only when price broke above the box’s resistance level, signaling a continuation of the uptrend.
Set a Stop-Loss: His stop-loss was placed just below the support level of the box.
Sell When the Trend Weakens: If price broke below the lower boundary of the box, he exited immediately.
4. What Traders Can Learn from Darvas
Price Action is King: You don’t need complex indicators— price and volume are enough.
Stick to Strong Stocks: Focus on high-momentum stocks rather than chasing random trades.
Discipline Beats Emotion: Trade with a clear system , don’t rely on market opinions.
Have a Risk Management Plan: Always use stop-losses and protect your capital.
Trend Trading Works: The best profits come from riding big trends—not predicting tops and bottoms.
Conclusion
Nicholas Darvas’ journey from a dancer to a millionaire trader proves that anyone can succeed in the stock market with the right strategy, discipline, and risk management. His box trading strategy is still used by traders today, helping them ride trends and maximize profits while minimizing risk.
Have you tried the Darvas Box strategy? Let’s discuss in the comments!

Kamat Hotels - Bullish Breakout with Massive VolumeKamat Hotels - Bullish Breakout with Massive Volume 🚀
📊 Timeframe: Daily
Trade Setup
🔹 Entry Level: ₹273.20
🔹 Stop Loss (SL): ₹226.11 (~17.23% below entry)
🔹 Target Levels:
T1 (Pivot High of April 2024): ₹315.45 (+15.46%) 🟢
T2 (Positional Target - ATH): ₹374.00 (+36.93%) 🏆
Risk-to-Reward Ratio (R:R):
R:R for T1: 0.89
R:R for T2: 2.14
Technical Highlights
🔥 Volume Spike:
Breakout supported by 4-5x higher volumes than recent sessions. Volume is the key reason for this suggestion.
📈 Price Journey:
The stock started its upward journey in March 2020, slowly rising while trading inside a channel.
Made a peak (ATH) in January 2024, followed by a sharp fall.
After the fall, the stock formed a base and consolidated, leading to the current breakout.
📈 Resistance Levels:
Immediate Resistance: ₹292.45 (Pivot High from May 2024 – 8 months ago).
Target 1: ₹315.45 (April 2024 Pivot High).
🌟 Candle Analysis:
Strong, clean candle with no upper shadow, showing bullish strength.
📊 Trend Consideration:
While technically bullish, keep in mind this is against the broader trend, which increases the risk of failure.
💡 Pyramiding Opportunity:
Consider adding positions gradually (pyramiding) on follow-through price action.
Fundamental Perspective
⚠️ Fundamentals: Nothing extraordinary here; this is purely a technical trade driven by a volume-backed breakout.
Actionable Advice & Risks
🔍 Wait and Watch:
Look for follow-through price action before committing significant capital.
⚡ Sharp Retracement Risk:
Breakouts can often retrace sharply, especially against the trend. Consider adding only small quantities or trade according to your risk appetite.
❗ Trend Risk:
2 out of 3 trades fail if the market sentiment turns bearish, so trade cautiously when going against the prevailing trend.
Disclaimer
This idea is for educational purposes only and is not financial advice. Please consult your financial advisor and trade according to your risk tolerance.
Summary:
The stock shows a technically strong breakout, supported by massive volume, and has been gradually rising since March 2020, trading inside a channel. It made an ATH in January 2024, followed by a sharp fall, formed a base, and consolidated before breaking out. Immediate resistance lies at ₹292.45, followed by T1 at ₹315.45, and positional traders can aim for the ATH of ₹374. While fundamentals are not strong, the volume-backed breakout and clean price action make this a compelling technical setup. Be cautious of retracements and manage your risk effectively.

Asso Alcohol-Darvas box breakout and Retest done.
✅Stock is in an uptrend
✅Broke out of a base and retested
✅Trading above Key DMAs
✅consolidating right above the base forming base on
base with narrow-range candles
Keep this in your sight and find long opportunity.
CMP: 1128.75
Entry: 1132
SL: 935(Closing Basis)
Risk: 17.3%
Reward: 20.7%
The view shared is for educational purposes. Please do your due diligence.

Genesys Trying to breakout from ConsolidationStock: Genesys Intl Corp Ltd (GENESYS)
Entry: ₹1,055.35 (after a closing above this level for confirmation)
Stop Loss: ₹919.70 (on a closing basis)
Target: ₹1,230.85
Setup Overview:
Pattern: Trying to Breakout from a consolidation zone.
Volume: Moderate, confirming a breakout attempt, but needs more conviction.
Key Levels:
Entry after a confirmed close above ₹1,055.35 for safe traders.
Target: ₹1,230.85
Risk Considerations:
Trading against the broader trend; breakout setups in such cases have a higher failure probability.
Manage risk with appropriate position sizing.
Trade light to mitigate potential losses.

Mahanagar Gas Limited: A Breakout OpportunityThe stock is in a solid consolidation phase, forming a bullish pattern of higher highs and higher lows. Patience is key, so I'm playing it smart by waiting for a decisive breakout above ₹1339 on a closed candle. Once confirmed, I'll buy above that high for a strong entry point.
📊 Technical Insight:
RSI is showing strength, hinting at momentum building up. Fingers crossed that we get a smooth breakout without an overly sharp spike!
💼 Fundamentals Check:
With robust financials and a leading position in the gas distribution sector, Mahanagar Gas is a powerhouse in the energy space. Strong market fundamentals and positive technical signals make it one to watch closely!
Let’s see if this one fuels up for a big move!
