Dashusd

Dash Short Setup Once Dash hits the resistance and gets rejected I'll look for a short entry at least till 38$ rest depends on BTC let's hope for the best
TP 1 = 39$
TP 2 = 38$
TP 3 = 36.8$

💡Don't miss the great buy opportunity in DASHUSD @DashpayTrading suggestion:
". There is a possibility of temporary retracement to the suggested support line (128.6).
. if so, traders can set orders based on Price Action and expect to reach short-term targets."
Technical analysis:
. DASHUSD is in a range bound, and the beginning of an uptrend is expected.
. The price is above the 21-Day WEMA, which acts as a dynamic support.
. The RSI is at 49.
Take Profits:
TP1= @ 134.3
TP2= @ 137.9
TP3= @ 143.7
TP4= @ 147.5
TP5= @ 155.4
SL= Break below S2
❤️ If you find this helpful and want more FREE forecasts in TradingView
. . . . . Please show your support back,
. . . . . . . . Hit the 👍 LIKE button,
. . . . . . . . . . Drop some feedback below in the comment!
❤️ Your support is very much 🙏 appreciated!❤️
💎 Want us to help you become a better Forex / Crypto trader?
Now, It's your turn!
Be sure to leave a comment; let us know how you see this opportunity and forecast.
Trade well, ❤️
ForecastCity English Support Team ❤️

DASH Chart Pattern: On the Verge of a Possible Breakout?# KUCOIN:DASHUSDT Dash is consolidating for long after steep correction $273 USD to $ 223 for more than 2.5 months. It even touched the low of $144 USD.
On the daily chart, it has recovered significantly since then. As evident from the above chart, the consolidation seems to be coming to over as symmetrical triangle pattern seems to be completed.
The Rate of Change Indicator on both 9 days, 25 days and 45 days is above zero line which shows that momentum strength has started building up.
William’s Alligator lines is looking to converge smoothly and green candles have crossed this convergence of three lines. There is a good possibility that Alligator may wake up and open its mouth, which is a possible signal of price rise.
And most importantly, the Hurst Time Cycle line ( as shown by the white perpendicular line) has also fallen exactly at the place where three seems to be converging exactly at the same place signifying that time has come for a possible breakout.
So, on the Dash Chart, the platform is set and you should be looking for it.
On the hourly chart, #Dash has already given a solid breakout as evident from the chart.


💡Don't miss the great buy opportunity in DASHUSD @DashpayMidterm forecast:
While the price is above the support 101.85, beginning of uptrend is expected.
We make sure when the resistance at 250.00 breaks.
If the support at 101.85 is broken, the short-term forecast -beginning of uptrend- will be invalid.
Technical analysis:
A trough is formed in daily chart at 109.35 on 07/19/2021, so more gains to resistance(s) 165.20, 178.70, 216. 05 and maximum to Major Resistance (250.00) is expected.
Price is above WEMA21, if price drops more, this line can act as dynamic support against more losses.
Relative strength index ( RSI ) is 56.
Take Profits:
TP1= @178.70
TP2= @216. 05
TP3= @250.00
TP4= @293. 40
TP5= @336.00
TP6= @399.65
TP7= @475.85
TP8= @542.90
❤️ If you find this helpful and want more FREE forecasts in TradingView
. . . . . Please show your support back,
. . . . . . . . Hit the 👍 LIKE button,
. . . . . . . . . . Drop some feedback below in the comment!
❤️ Your support is very much 🙏 appreciated!❤️
💎 Want us to help you become a better Forex / Crypto trader?
Now, It's your turn!
Be sure to leave a comment; let us know how you see this opportunity and forecast.
Trade well, ❤️
ForecastCity English Support Team ❤️

💡Don't miss the great buy opportunity in DASHUSD
Trading suggestion:
". There is a possibility of temporary retracement to suggested support line (327.80).
. if so, traders can set orders based on Price Action and expect to reach short-term targets."
Technical analysis:
. DASHUSD is in an uptrend and the continuation of uptrend is expected.
. The price is above the 21-Day WEMA which acts as a dynamic support.
Take Profits:
TP1= @ 385.00
TP2= @ 420.00
TP3= @ 461.19
TP4= @ 545.00
TP5= @ 617.37
SL= Break below S2
❤️ If you find this helpful and want more FREE forecasts in TradingView
. . . . . Please show your support back,
. . . . . . . . Hit the 👍 LIKE button,
. . . . . . . . . . Drop some feedback below in the comment!
❤️ Your Support is very much 🙏 appreciated! ❤️
💎 Want us to help you become a better Forex trader ?
Now, It's your turn !
Be sure to leave a comment let us know how you see this opportunity and forecast.
Trade well, ❤️
ForecastCity English Support Team ❤️

Don't miss the great buy opportunity in DASHUSDT @ dashTrading suggestion:
. There is a possibility of temporary retracement to 250/255$ or support trendline.
. traders can set orders based on Price Action and expect to reach short & long term targets.
Technical analysis:
. Dash is in a uptrend and the continuation of uptrend is expected.
. The price is above 190/250$ zone leads more upside.
Take Profits:
TP1= 355$
TP2= 434$
tp3= 588$
SL = 180$
If you find this is helpful and want more FREE view in TradingView
. . . Please show your support back,
. . . . Hit the ?? LIKE button,
. . . . . Drop some feedback below in the comment!
Your Support is very much ?? appreciated!
Now, It's your turn!
Wish you happy Trade
KITE crypto! (Free Telgram)

💡Don't miss the great buy opportunity in DASHUSDTrading suggestion:
". There is a possibility of temporary retracement to suggested support line (63.65).
. if so, traders can set orders based on Price Action and expect to reach short-term targets."
Technical analysis:
. DASHUSD is in a range bound and the beginning of uptrend is expected.
. The price is above the 21-Day WEMA which acts as a dynamic support.
. The RSI is at 50.
Take Profits:
TP1= @ 75.30
TP2= @ 79.90
TP3= @ 87.90
TP4= @ 104.40
TP5= @ 117.10
TP6= @ 142.15
TP7= @ 184.55
TP8= @ 260.75
TP9= @ 399.65
TP10= @ 622.50
TP11= @ 803.35
TP12= @ 984.00
TP13= @ 1568.35
❤️ If you find this helpful and want more FREE forecasts in TradingView
. . . . . Please show your support back,
. . . . . . . . Hit the 👍 LIKE button,
. . . . . . . . . . Drop some feedback below in the comment!
❤️ Your Support is very much 🙏 appreciated! ❤️
💎 Want us to help you become a better Forex trader ?
Now, It's your turn !
Be sure to leave a comment let us know how you see this opportunity and forecast.
Trade well, ❤️
ForecastCity English Support Team ❤️

There is a trading opportunity to buy in DASHUSDMidterm forecast:
While the price is above the support 32.75, beginning of uptrend is expected.
We make sure when the resistance at 87.90 breaks.
If the support at 32.75 is broken, the short-term forecast -beginning of uptrend- will be invalid.
Technical analysis:
The Falling Wedge taking shape and as a bullish pattern suggests we will soon see another leg higher if price breaks and closes above downtrend.
While the RSI downtrend #1 is not broken, bearish wave in price would continue.
A peak is formed in daily chart at 76.15 on 07/13/2020, so more losses to support(s) 66.10, 57.90, 48.30 and minimum to Major Support (32.75) is expected.
Price is below WEMA21, if price rises more, this line can act as dynamic resistance against more gains.
Relative strength index (RSI) is 53.
Trade Setup:
We opened 12 BUY trade(s) @ 71.81 based on 'Valley' entry method at 2020.07.22.
Take Profits:
TP1: 79.90
TP2: 87.90
TP3: 117.10
TP4: 142.15
TP5: 184.55
TP6: 260.75
TP7: 399.65
TP8: 622.50
TP9: 803.35
TP10: 984.00
TP11: 1568.35
TP12: Free
❤️ If you find this helpful and want more FREE forecasts in TradingView
. . . . . Please show your support back,
. . . . . . . . Hit the 👍 LIKE button,
. . . . . . . . . . . Drop some feedback below in the comment!
❤️ Your Support is very much 🙏 appreciated! ❤️
💎 Want us to help you become a better Forex trader ?
Now, It's your turn !
Be sure to leave a comment let us know how do you see this opportunity and forecast.
Trade well, ❤️
ForecastCity English Support Team ❤️

A trading opportunity to buy in DASHUSDTechnical analysis:
. Dash/Dollar is in a range bound and the beginning of uptrend is expected.
.The price is above the 21-Day WEMA which acts as a dynamic support.
. The RSI is at 51.
Trading suggestion:
. There is a possibility of temporary retracement to suggested support zone (72.500 to 56.200). if so, traders can set orders based on Price Action and expect to reach short-term targets.
Beginning of entry zone (72.500)
Ending of entry zone (56.200)
Entry signal:
Signal to enter the market occurs when the price comes to " Buy zone " then forms one of the reversal patterns, whether " Bullish Engulfing ", " Hammer " or " Valley " in other words, NO entry signal when the price comes to the zone BUT after any of reversal patterns is formed in the zone. To learn more about " Entry signal " and the special version of our " Price Action " strategy FOLLOW our lessons :
Take Profits:
TP1= @ 102.700
TP2= @ 139.000
TP3= @ 175.000
TP4= @ 210.000
TP5= @ 280.000
TP6= @ 410.000
TP7= @ 530.000
TP8= @ 628.500
TP9= @ 806.000
TP10= @ 982.500
TP11= Free

A trading opportunity to buy in DASHUSDTechnical analysis:
. Dash/Dollar is in a range bound and the beginning of uptrend is expected.
.The price is below the 21-Day WEMA which acts as a dynamic resistance.
. The RSI is at 38.
Trading suggestion:
. There is a possibility of temporary retracement to suggested support zone (104.00 to 84.00). if so, traders can set orders based on Price Action and expect to reach short-term targets.
Beginning of entry zone (104.00)
Ending of entry zone (84.00)
Entry signal:
Signal to enter the market occurs when the price comes to "Buy zone" then forms one of the reversal patterns, whether "Bullish Engulfing" , "Hammer" or "Valley" in other words,
NO entry signal when the price comes to the zone BUT after any of the reversal patterns is formed in the zone.
To learn more about "Entry signal" and the special version of our "Price Action" strategy FOLLOW our lessons:
Take Profits:
TP1= @ 139.000
TP2= @ 175.000
TP3= @ 210.000
TP4= @ 280.000
TP5= @ 410.000
TP6= @ 530.000
TP7= @ 640.000
TP8= @ 806.000
TP9= @ 982.000
TP10= Free

A trading opportunity to buy in DASHUSDTechnical analysis:
. Dash/Dollar is in a range bound and the beginning of uptrend is expected.
. The price is below the 21-Day WEMA which acts as a dynamic resistance.
. The RSI is at 39.
. While the RSI downtrend and the price downtrend in the daily chart are not broken, bearish wave in price would continue.
Trading suggestion:
. There is a possibility of temporary retracement to suggested support zone (104.000 to 84.000). if so, traders can set orders based on Price Action and expect to reach short-term targets.
Beginning of entry zone (104.000)
Ending of entry zone (84.000)
Entry signal:
Signal to enter the market occurs when the price comes to " Buy zone " then forms one of the reversal patterns, whether " Bullish Engulfing ", " Hammer " or " Valley " in other words, NO entry signal when the price comes to the zone BUT after any of reversal patterns is formed in the zone. To learn more about " Entry signal " and the special version of our " Price Action " strategy FOLLOW our lessons :
Take Profits:
TP1= @ 139.000
TP2= @ 175.000
TP3= @ 210.000
TP4= @ 280.000
TP5= @ 410.000
TP6= @ 530.000
TP7= @ 640.000
TP8= @ 806.000
TP9= @ 982.000
TP10= Free

A new trading opportunity to buy in DASHUSDTechnical analysis:
. DASH/DOLLAR is in a range bound and the resumption of uptrend is expected.
. The price is above the 21-Day WEMA which acts as a dynamic support.
. The RSI is at 50.
Trading suggestion:
. If you missed our first HUNT, you have a second chance to buy above the new suggested support zone.
. There is still a possibility of temporary retracement to suggested support zone (221.0 to 153.0). if so, traders can set orders based on Price Action and expect to reach short-term targets.
Beginning of entry zone (221.0)
Ending of entry zone (153.0)
Entry signal:
Signal to enter the market occurs when the price comes to "Buy zone" then forms one of the reversal patterns, whether "Bullish Engulfing" , "Hammer" or "Valley" in other words,
NO entry signal when the price comes to the zone BUT after any of the reversal patterns is formed in the zone.
To learn more about "Entry signal" and the special version of our "Price Action" strategy FOLLOW our lessons:
We have already opened 10 BUY trade(s) @ 235.259 based on 'Two-Day reversal candle ( Hammer in D2 time frame)' entry method at 2018.06.29 in our previous suggested support zone (231.0 to 153.0).
Total Profit: 133410
Closed trade(s): 45741 Profit
Open trade(s): 87669 Profit
Closed Profit:
TP1 @ 281.0 touched at 03.21.2018 with 23392 Profit.
Open Profit:
Profit for one trade is 245.000(current price) - 235.259(open price) = 9741
9 trade(s) still open, therefore total profit for open trade(s) is 9741 x 9 = 87669
All SLs moved to Break-even point.
New Take Profits:
TP1= @ 281.0
TP2= @ 327.0
TP3= @ 407.0
TP4= @ 541.0
TP5= @ 640.0
TP6= @ 749.0
TP7= @ 915.0
TP8= @ 1182.0
TP9= @ 1625.0
TP10= Free

There is a trading opportunity to buy in DASHUSD Technical analysis:
. DASH/DOLLAR is in a downtrend but the beginning of uptrend is expected.
. The price is below the 21-Day WEMA which acts as a dynamic resistance.
. The RSI is at 45.
. The RSI downtrend #1 & The price downtrend in the daily chart are broken, so the probability of resumption of uptrend is increased.
Trading suggestion:
. We have already opened 10 BUY trade(s) @ 235.259 based on 'Two-Day reversal candle (Hammer in D2 time frame)' entry method at 2018.06.29 in our suggested support zone (231.0 to 153.0).
Beginning of entry zone (231.0)
Ending of entry zone (153.0)
Entry signal:
Signal to enter the market occurs when the price comes to "Buy zone" then forms one of the reversal patterns, whether "Bullish Engulfing" , "Hammer" or "Valley" in other words,
NO entry signal when the price comes to the zone BUT after any of reversal patterns is formed in the zone.
To learn more about "Entry signal" and the special version of our "Price Action" strategy FOLLOW our lessons:
Take Profits:
TP1= @ 281.0
TP2= @ 327.0
TP3= @ 407.0
TP4= @ 510.0
TP5= @ 650.0
TP6= @ 809.0
TP7= @ 939.0
TP8= @ 1182.0
TP9= @ 1625.0
TP10= Free

There is possibility for the beginning of uptrend in DASHUSD .Technical analysis:
DASH/DOLLAR is in a range bound and beginning of up trend is expected.
The price is below the 21-Day WEMA which acts as a dynamic resistance.
The RSI is at 47.
Trading suggestion:
The price is in a range bound, but we forecast the uptrend would begin.
There is possibility of temporary retracement to suggested support zone (417 to 281), if so, traders can set orders based on Daily-Trading-Opportunities and expect to reach short-term targets.
Beginning of entry zone (417)
Ending of entry zone (281)
Entry signal:
Signal to enter the market occurs when the price comes to "Buy zone" then forms one of the reversal patterns, whether "Bullish Engulfing" , "Hammer" or "Valley" , in other words,
NO entry signal when the price comes to the zone BUT after any of reversal patterns is formed in the zone.
To learn more about "Entry signal" and special version of our "Price Action" strategy FOLLOW our lessons:
Take Profits:
TP1= @ 510
TP2= @ 650
TP3= @ 809
TP4= @ 939
TP5= @ 1182
TP6= @ 1625
TP7= Free

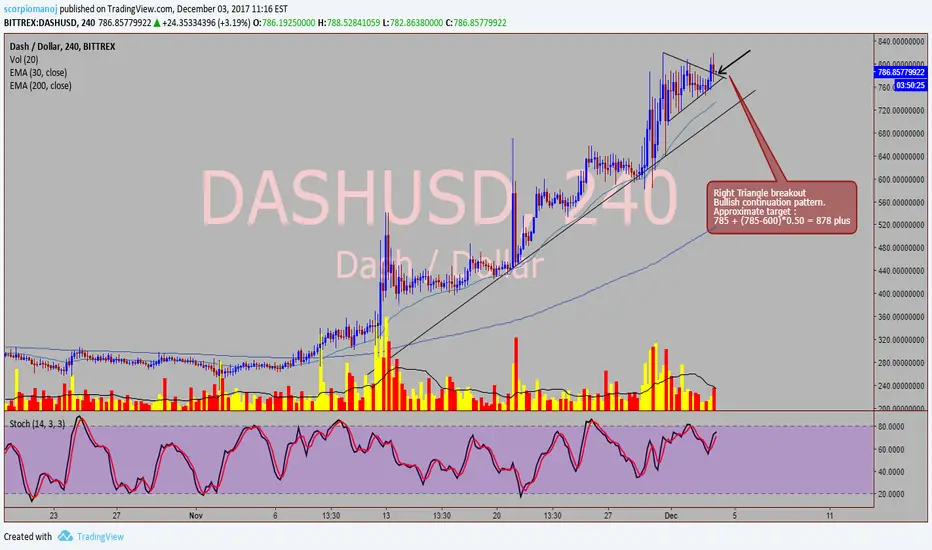
Dash / USD Bullish continuation pattern in 4 hr chart.Dash USD - CMP 783.
All EMAs sloping upwards coupled with a right triangle (penant) breakout pattern.
Price moving towards 850 plus highly probable.
Stop at base of the penant.

Dash / USD - Bullish continuation pattern - 4 hour chartDash USD - CMP 783.
All EMAs sloping upwards coupled with a right triangle (penant) breakout pattern.
Price moving towards 850 plus highly probable.
Stop at base of the penant.